ISSN Online: 2164-5175 ISSN Print: 2164-5167
DOI: 10.4236/ajibm.2019.98111 Aug. 23, 2019 1699 American Journal of Industrial and Business Management
The Implicit Association Test on Place-of-Origin
Stereotyping for Mobile Phone Brands Based
on User Preferences Data Processing
Ying Ge
1*#, Jibo He
1,2*, Huishan Pang
1,3#, Yuanyan Hu
1, Yangcan Gong
11Key Laboratory of Emotion and Mental Health in Chongqing, User Experience and Human-Computer Interaction Technology
Institute, Chongqing University of Arts and Sciences, Chongqing Collaborative Innovation Center for Brain Science, Chongqing, China
2Department of Psychology, School of Social Sciences, Tsinghua University, Beijing, China 3School of Education Science, Minnan Normal University, Zhangzhou, China
Abstract
People may have a tendency to prefer local or national products, a phenome-non often referred as local protectionism. In the meanwhile, consumption of oversea or well-known products is a symbol of social status. An important question for both non-Chinese and Chinese manufacturers and researchers is whether Chinese prefer local or oversea products? Previous studies have shown that explicit survey is often not reliable, thus an Implicit Association Test (IAT) study is conducted with80 Chinese college students (40 males and 40 females) to investigate their implicit place-of-origin stereotypes about Chinese and foreign mobile phone brands. The results show that implicit place-of-origin stereotypes about mobile phone brands do exist among Chi-nese college students. They implicitly prefer, to various extents, foreign mo-bile phone brands, and male college students in particular are less interested in Chinese mobile phone brands. This study demonstrated an important ap-plication of the Implicit Association Test and has important apap-plication in guiding the marketing of products.
Keywords
Mobile Phone Brands, Place-of-Origin Stereotypes, Implicit Association Test (IAT), Marketing
1. Introduction
As economic globalization runs its course, brand is becoming enterprises’ pri-*Co-first authors.
How to cite this paper: Ge, Y., He, J.B., Pang, H.S., Hu, Y.Y. and Gong, Y.C. (2019) The Implicit Association Test on Place-of- Origin Stereotyping for Mobile Phone Brands Based on User Preferences Data Processing. American Journal of Industrial and Business Management, 9, 1699-1711. https://doi.org/10.4236/ajibm.2019.98111
Received: July 18, 2019 Accepted: August 20, 2019 Published: August 23, 2019
Copyright © 2019 by author(s) and Scientific Research Publishing Inc. This work is licensed under the Creative Commons Attribution International License (CC BY 4.0).
DOI: 10.4236/ajibm.2019.98111 1700 American Journal of Industrial and Business Management mary means of competition in the marketplace. It is an intangible value-adding asset composed of specially designed name and logo that differentiates its owner from competitors. Existing consumer impression determines the value of a brand [1]. With the booming of mobile Internet, mobile phone, the terminal products of mobile communication industry, are facing fierce competition in the market. In China, premium-quality, high-priced foreign brands have a large market share, whilst Chinese brands, with a better price/performance ratio, have their hands on particular market segments. When comparing domestic and for-eign mobile phones, consumers tend to have place-of-origin stereotypes, espe-cially implicit preferences, about brands. Currently, college students are the main driver of consumption, but there has been no research on this group’s ste-reotyping of mobile phone brands. In consequence, to facilitate better marketing of domestic and foreign products in China, it is vital for both Chinese and in-ternational manufacturers and researchers to know how factors like gender, consumer ethnocentrism and symbolic benefits impact purchase products in the huge Chinese marketplace. Most importantly, investigating Chinese college stu-dents’ implicit stereotypes about domestic and foreign mobile phone brands will also inform the building of mobile phone brand image from a new perspective.
2. Literature Review
A stereotype is the social cognitive structure comprising knowledge, ideas, and concepts of a social organization [2]. As a special social cognitive schema, ste-reotype is a cognitive process in which people, for all the influences that society has on them, keep prior views of certain people and things. Stereotypes and im-plicit processes are interrelated. The information processing involved is largely subconscious and can guide collective and individual expectations in informa-tion processing [3]. Stereotype research covers gender stereotypes, racial stereo-types, occupational stereostereo-types, age stereostereo-types, discipline stereostereo-types, and geo-graphical stereotypes [4]. In recent years, researchers have begun to focus on brand stereotypes. Jin [5] points out that domestic consumers generally think that the quality of foreign TV set brands is superior to that of domestic ones; Li [6] studied Chinese college students’ attitudes toward luxury brands, and his re-search results show that compared with average brands, luxury brands tend to be more popular with college students; Pan’s research on clothing brand aesthetics shows that compared with mass-market brands, premium clothing brands like Chanel are implicitly preferred by the subjects [7]; Zhao [8] finds that online clothing brands fit consumers’ stereotype of the low-quality, low-priced category that habitually conceals and deceives.
DOI: 10.4236/ajibm.2019.98111 1701 American Journal of Industrial and Business Management from economically underdeveloped countries [13]. American consumers, like consumers in developing countries, prefer multinational brands [14]. The con-cept “stereotype about place of origin” is explicitly raised in Wang’s studies, in which he points out that a place-of-origin stereotype is essentially a stable con-cept, image or cognitive schema that consumers form for a particular type of commodity produced in a particular country or region and that such stereo-types, about French perfumes or Swiss watches, for example, are not easily changed [15] [16]. The appearance of place-of-origin stereotypes is shaped by the society and culture of the country or region that produces it. It is consistent and is perpetuated and reinforced as the socialization process of the individual proceeds [17].
In the decision to purchase domestic or foreign products, two major factors may be considered, the consumer ethnocentrism of domestic products and the symbolic benefits of foreign products [18] [19] [20]. Consumer ethnocentrism, or consumer nationalisms (e.g. patriotic emotions) impact domestic product preferences of consumers. Symbolic benefits, such as modernity, prestige, and associations with foreign lifestyles, constitute one of the primary motivating forces of Chinese consumers to purchase nondomestic products, including products that may not be commonly regarded as conspicuous [21].
According to the study on consumer behavior, males and females may differ in their product purchase decisions, especially in their weighting of consumer ethnocentrism and symbolic benefits. Gender and age are reported to be impor-tant moderators of the consumer ethnocentrism of product purchase [18]. Males tend to impulsively buy instrumental and leisure items projecting independence and activity, while females tend to buy symbolic and self-expressive goods con-cerned with appearance and emotional aspects of self [22]. It is learned from a research that in the US, males pursue the identity of a man through daily con-sumption and display success, responsibility, independence and adventure through specific consumption [23]. There are also studies reporting null gender effect on ethnocentrism when purchasing products [18]. Moreover, a unique brand personality is created and spread to show orientation of a product. As an anthropomorphic trait of a brand, brand personality refers to an expectation of particular impression formed by consumers towards a specific brand, connect-ing a certain brand with specific personality [24] [25]. For example, people who use Apple products are regarded as workaholics and worshippers of power and achievements. People of different genders have stereotyped preference towards brands fitting their own personality due to the existence of brand personality.
DOI: 10.4236/ajibm.2019.98111 1702 American Journal of Industrial and Business Management [29]. These are the findings of preliminary studies on mobile phone brands.
Implicit Association Test (IAT) was proposed by Greenwald et al. in 1998 as a measure of implicit mental operation [30]. Implicit attitude, Greenwald argues, is an imprint of the past experiences often overlooked by or unidentifiable to the individual, which affects their like, assessment, and cognition of things [31]. It uses the computer as a tool and the reaction time as a basic indicator to distin-guish between task categories, indirectly measure auto-correlation between con-cept (target category) words and attribute words, and on this basis, explore the individual’s implicit attitude and their various preferences [32]. Take “insects” and “horrors” as an example. If you think insects are scary, the reaction time you spend establishing a correlation between “insects” and “horrors” will be shorter than that involved in establishing a correlation between “insects” and “beauty.” This would be your implicit attitude toward insects.
In view of the above, mobile phone brands lack of some researches focusing on brand stereotypes and place-of-origin stereotypes, especially without under-taking experimental research on implicit preferences. The active consumer group- college students-has not been getting attention.
Therefore, this study will do Implicit Association Tests (IAT) on Chinese col-lege student subjects and focus on implicit place-of-origin stereotypes about mobile phone brands. The assumption is that Chinese college students, male and female, have implicit place-of-origin stereotypes about Chinese and foreign mo-bile phone brands—that is, they have subconscious preferences for particular mobile phone brands.
The article is organized as follows: introduction, literature review, research hypothesis, methods, research results, discussion and analysis, limitations and future research.
3. Methods
3.1. Participants
A group of 30 college students are randomly selected as preliminary open-ended interview and another group of 10 college students are selected for preliminary test participants. Then, a third group of 40 participants from three other univer-sities are recruited for assessment of experimental materials. Inlater Implicit As-sociation Test, a fourth group of 80 college students (40 males and 40 females) are screened from these universities. Normal visual acuity or corrected visual acuity, good health, and zero prior experience in such tests are required. Each participant is reimbursed with RMB20. The participants were selected in batches to meet different objectives in the research process.
3.2. Experiment Design
DOI: 10.4236/ajibm.2019.98111 1703 American Journal of Industrial and Business Management implicit place-of-origin stereotypes affect the choice of mobile phone brands. It follows the 2 (male, female) × 2 (Chinese brands, foreign brands) mixed-factor experimental design. The independent variables include subject types and brand types, and the dependent variables are the reaction times of the subjects in the implicit association test.
3.3. Experimental Materials
Target category words (brand names and logos of Chinese and foreign mobile phones) and attribute words (like “good handfeel” and “poor handfeel”) are created for the IAT, based on the results of preliminary interview and assess-ment of experiassess-mental materials. Top five Chinese and top five foreign mobile phone brands—a total of 10—are finally selected. Domestic mobile phone brands include Xiaomi, Meizu, Huawei, ZTE, and OPPO; foreign mobile phone brands include Apple, Samsung, Blackberry, Nokia, and Sony. The attribute words in-volved in the tests include 10 positive attribute words (large memory size, high screen resolution, superior material quality, good handfeel, excellent signal re-ception, great acoustic fidelity, fast processing speed, being intelligent, low radi-ation, and high pixel resolution); 10 negative attribute words (short standby time, low screen resolution, limited functions, long loading time, poor handfeel, short product life, poor after-sales services, low pixelresolution, poor signal re-ception, frequent system crashes).
A program is written using the E-prime software to perform tests on target category words and attribute words. Mobile phone brands are displayed in gray-background color pictures with 600 × 435 pixel resolution, which include lo-gos and names; attributes, expressed in words, are displayed in gray-background pictures with 600 × 435 pixel resolution.
3.4. Experimental Procedures
3.4.1. Experimental PreparationsTen Chinese college students are randomly selected for preliminary tests. The results show that the well-designed initial tests can be immediately applied in formal tests.
Test rehearsals are held before formal tests begin, so that the subjects can bet-ter understand the experimental procedures and invalid data are kept at a min-imum after the formal tests end, thereby achieving better results. In the formal tests, the subjects are required to keep quiet from the beginning to the end in laboratories with good sound insulation. After the subjects hear the test organiz-er announce the test requirements, they are to, at the prompt of the test pro-gram, complete the implicit association tests independently. This study uses computers with a 19-inch display, and the subjects are to react by pressing the corresponding keys at the prompts.
3.4.2. Test Steps
for-DOI: 10.4236/ajibm.2019.98111 1704 American Journal of Industrial and Business Management eign mobile phone brands are randomly displayed. The subjects are asked to classify the pictures displayed and make quick reactions by pressing keys. They are to press the F key when the picture of a foreign mobile phone brand appears and press the J key when the picture of a Chinese mobile phone brand appears.
Step 2: Attribute words identification (rehearsal). Pictures of ten positive and ten negative words are displayed. The subjects are asked to make judgments about the pictures displayed and make quick reactions by pressing keys. They are instructed to press the F key when the picture of a positive word appears and press the J key when the picture of a negative word appears.
Step 3: Compatibility task (rehearsal). Pictures of five Chinese and five foreign mobile phone brands, and pictures of five positive and five negative words are randomly displayed. The subjects are asked to react quickly by pressing keys. When the picture of a foreign mobile phone brand or a positive word appears, the subjects are to press the F key; when the picture of a Chinese mobile phone brand or a negative word appears, they are to press the J key.
Step 4: Compatibility task (test). Pictures of five Chinese and five foreign mo-bile phone brands, and pictures of ten positive and ten negative words are ran-domly displayed. The subjects are asked to react quickly by pressing keys. When the picture of a foreign mobile phone brand or a positive word appears, the sub-jects are to press the F key; when the picture of a Chinese mobile phone brand or a negative word appears, they are to press the J key.
Step 5: Opposite category identification (rehearsal). Pictures of five Chinese and five foreign mobile phone brands are randomly displayed. The subjects are asked to classify the pictures displayed and make quick reactions by pressing keys. When the picture of China’s mobile phone brand appears, the subjects are to press the F key; when the picture of the foreign mobile phone brand appears, the subjects are to press the J key.
Step 6: Incompatibility task (rehearsal). Pictures of five Chinese and five for-eign mobile phone brands, and pictures of five positive and five negative words are randomly displayed. The subjects are asked to react quickly by pressing keys. When the picture of a Chinese mobile phone brand or a positive word appears, the subjects are to press the F key; when the picture of a foreign mobile phone brand or a negative word appears, they are to press the J key.
Step 7: Incompatibility task (test). Pictures of five Chinese and five foreign mobile phone brands, and pictures of ten positive and ten negative words are randomly displayed. The subjects are asked to react quickly by pressing keys. When the picture of a Chinese mobile phone brand or a positive word appears, the subjects are to press the F key; when the picture of a foreign mobile phone brand or a negative word appears, they are to press the J key.
The experimental procedure and flow chart are shown in Table 1 and Figure 1.
DOI: 10.4236/ajibm.2019.98111 1705 American Journal of Industrial and Business Management
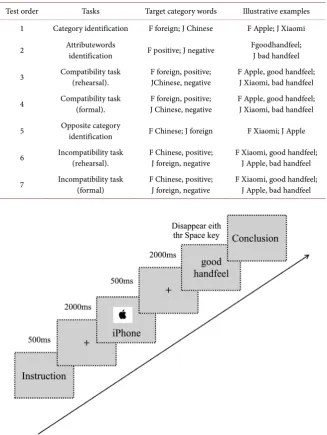
Table 1. Implicit association test (IAT) procedure.
Test order Tasks Target category words Illustrative examples 1 Category identification F foreign; J Chinese F Apple; J Xiaomi
2 Attributewords identification F positive; J negative Fgoodhandfeel; J bad handfeel
3 Compatibility task (rehearsal). F foreign, positive; JChinese, negative F Apple, good handfeel; J Xiaomi, bad handfeel
4 Compatibility task (formal). F foreign, positive; J Chinese, negative F Apple, good handfeel; J Xiaomi, bad handfeel
5 Opposite category identification F Chinese; J foreign F Xiaomi; J Apple
6 Incompatibility task (rehearsal). F Chinese, positive; J foreign, negative F Xiaomi, good handfeel; J Apple, bad handfeel
7 Incompatibility task (formal) F Chinese, positive; J foreign, negative F Xiaomi, good handfeel; J Apple, bad handfeel
Figure 1. Implicit association test (IAT) flow chart.
paired to positive words); Steps 6 and 7 are incompatibility tasks (Chinese mo-bile phone brands are paired to positive words). The computer automatically records the reaction times of the subjects and their correct answer rates and then shows them in the Results section. All the stimulus words are shown in the cen-ter of the screen, and prompts appear in the upper left and right corners. During the test, participants sit approximately 65 cm in front of the computer screen.
3.5. Data Processing
DOI: 10.4236/ajibm.2019.98111 1706 American Journal of Industrial and Business Management and 7 are kept, and data about the subjects who did not complete the test and whose accuracy is below 80% are eliminated; reaction times shorter than 300 ms and longer than 10,000 ms are eliminated, and the wrong-answer reaction times are replaced by the sum of the average of these reaction times and 600 ms. The results of the data processing above show that 80 participants—40 males and 40 females—have been effectively tested. The difference between incompatibility and compatibility reaction times is then divided by the standard deviation of the total reaction times to obtain a quotient, and the result obtained by dividing the rehearsal tasks by the formal task is the value D. According to Greenwald’s cal-culation method, the mean of compatibility reaction times is equal to the sum of the reaction times of Steps 3 and 4, the mean of incompatibility reaction times is equal to the sum of the reaction times of Steps 6 and 7, and the IAT value is the difference obtained when the mean of compatibility reaction times is subtracted from the mean of incompatibility reaction times. The higher the IAT value, the more obvious the implicit stereotype. Finally, a paired sample t-test is conducted on the data regarding compatibility and incompatibility tasks. In this study, data are processed by statistical package SPSS18.0, and then the effect size and statis-tical test force are calculated by software G-power3.1.9.2. Effect size is measured using Cohen’s d. 0.8 of Cohen’s d indicates large effect, 0.5 indicates medium ef-fect and 0.2 indicates smaller efef-fect [34].
4. Research Results
4.1. Analysis of Overall Difference
A single sample t-test is conducted on value D of the test data of the subjects. The results are shown in Table 2. Overall, the subjects have notable implicit place-of-origin stereotypes about mobile phone brands, with t(79) = 4.345, p <
0.001, d = 0.492, and a statistical test force of 1.000. Both male and female college students have implicit place-of-origin stereotypes about mobile phone brands, with tmale(39) = 2.356, p < 0.001, d = 0.378, and a statistical test force of 0.95; t fe-male(39) = 3.981, p < 0.001, d = 0.638, and the statistical test force is 1.000.
4.2. Implicit Stereotypes
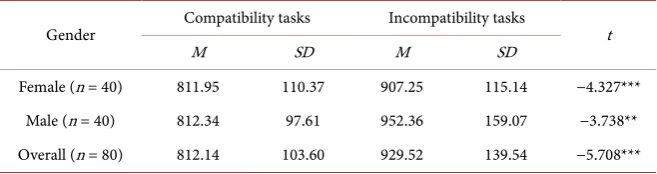
A paired t-test is conducted on the compatibility and incompatibility tasks in the implicit stereotype tests and on the reaction times of both genders. The results are shown in Table 3. The differences between the two parts of the test are nota-ble, with t(79) = −5.708, p < 0.001, d = 0.935, and a statistical test force of 1.000.
And, the gender-specific differences in the results of the two parts are also sig-nificant, with tfemale(39) = −4.327, p < 0.001, and an effect size of 0.845 and a
statis-tical test force of 1.000; tmale(39) = −3.738, p < 0.05, d = 0.737 and the statistical test
DOI: 10.4236/ajibm.2019.98111 1707 American Journal of Industrial and Business Management
Table 2. Gender differences in value d.
Gender M SD t
Male (n = 40) 0.38 1.01 2.356***
Female (n = 40) 0.52 0.81 3.981***
Total (n = 80) 0.45 0.91 4.345***
Note: *p < 0.05; **p < 0.01; ***p < 0.001.
Table 3. Comparison of reaction times involved in compatibility and incompatibility
tasks (ms).
Gender Compatibility tasks Incompatibility tasks t
M SD M SD
Female (n = 40) 811.95 110.37 907.25 115.14 −4.327*** Male (n = 40) 812.34 97.61 952.36 159.07 −3.738** Overall (n = 80) 812.14 103.60 929.52 139.54 −5.708*** Note: *p < 0.05; **p < 0.01; ***p < 0.001.
4.3. Gender Differences in IAT Effect
An independent sample t-test is further conducted to explore gender differences in IAT effect [35]. The results of Table 4 show that the IAT value is positive. This means both male and female college students have implicit place-of-origin stereotypes. It is not hard to find that both male and female college students tend to choose foreign mobile phone brands, although the effect of the gender of the subjects on IAT effect size is found to be insignificant during the significance test on gender-specific differences shown in place-of-origin stereotype IATs. It can therefore be asserted that when it comes to place-of-origin stereotypes, male and female college students show no difference in their implicit stereotypes about Chinese and foreign mobile phone brands. Their stereotypes tend to be identical, both preferring foreign brands.
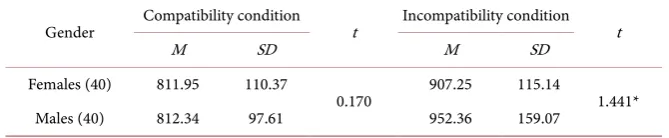
Specific differences in male and female college students’ preferences for Chi-nese and foreign mobile phone brands should be studied through a paired t-test on the means of the reaction times involved in performing compatibility and incompatibility tasks. As can be seen from Table 5, there is no significant dif-ference between male and female college students in the mean of the reaction times involved in performing compatibility tasks (p > 0.05). This indicates that both male and female college students show preference for foreign mobile phone brands and that their place-of-origin stereotypes tend to be identical. But there is a significant difference between male and female college students in the mean of the reaction times they spend in performing incompatibility tasks, with t(39) =
[image:9.595.210.539.217.304.2]DOI: 10.4236/ajibm.2019.98111 1708 American Journal of Industrial and Business Management
Table 4. Gender differences in IAT value D (n = 80).
gender M SD t P
Females (40) 140.02 161.22
1.09 0.28 Males (40) 95.30 202.10
Note: *p < 0.05; **p < 0.01; ***p < 0.001.
Table 5. Effect of gender on compatibility and incompatibility mean (n = 80).
Gender Compatibility condition t Incompatibility condition t
M SD M SD
Females (40) 811.95 110.37
0.170 907.25 115.14 1.441* Males (40) 812.34 97.61 952.36 159.07
Note: *p < 0.05; **p < 0.01; ***p < 0.001.
5. Discussion and Conclusions
5.1. Mobile Phone Brands Have a Very Significant IAT Effect on
Chinese College Students. Both Male and Female Students
Show a Preference for Foreign Brands
The IAT on mobile phone brands find that both male and female college stu-dents’ reaction times in performing compatibility tasks are shorter than those involved in performing incompatibility tasks. This shows that Chinese college students tend to associate foreign brands with positive words,but are less likely
to associate them with negative words, and that they tend to associate domestic brands with negative words but are less closely associate them with positive words. Overall, an implicit place-of-origin stereotype has emerged that “college students prefer foreign mobile phone brands.”
[image:10.595.207.542.189.258.2]DOI: 10.4236/ajibm.2019.98111 1709 American Journal of Industrial and Business Management phones are a symbol of the latest fashion and design, and demonstrating the same taste is the ticket to the in-group.
5.2. The Place-of-Origin Stereotypes of College Students, Males
and Females, Show Varied Preferences. Males Are Less Likely
than Females to Prefer Domestic Brands
The results of independent sample and paired t-tests show that there is no sig-nificant difference between male and female college students in IAT values and the mean of the reaction times involved in performing compatibility tasks, which marks a general preference for foreign mobile phone brands. There are differ-ences between the means of the reaction times that male and female college stu-dents spend in performing incompatibility tasks. Females react more quickly than males—evidence that preferences for domestic mobile phone brands vary across genders and that boys are less likely than girls to prefer domestic brands. Studies have shown that male consumers prefer international brands, especially foreign brands, more than their female counterparts, and that perceptual con-sumption as a consumer attitude rises continuously [38]; the spending behavior of male consumers differs from that of female consumers. Male consumers are identifiable as being practical, shopping quickly, having a strong sense of self- esteem, etc. [39]. Society places men in the center of social activities, and men in turn value self-esteem, identity and social status. For men, the mobile phone is not only a practical tool, but also a symbol of social status and authority. There-fore, men may have a comparatively more obvious bias against domestic brands.
6. Limitations and Future Research
This study used the Implicit Association Test to demonstrate the implicit prefe-rences of Chinese consumers for domestic and foreign products. A symbolic benefit effect of foreign products, instead of consumer ethnocentrism of domes-tic products, is found. However, this effect may be limited to the pardomes-ticipant re-presentativeness,product categories and research methods. Future studies
should consider recruiting participants from a wider age group and including more product categories, not just cell phone. Simultaneously, more econometric methods should be adopted.
Conflicts of Interest
The authors declare no conflicts of interest regarding the publication of this paper.
References
[1] Li, Y.C. (2011) Study on the Influencing Factors in Brand Value Based on Custom-er’s Purchase Decision. Kunming University of Science and Technology, Kunming. [2] Wang, P. (2002) Theory and Research on Stereotype. Gansu Education Press,
Lanzhou, 20-22.
DOI: 10.4236/ajibm.2019.98111 1710 American Journal of Industrial and Business Management
[4] Wang, P. and He, W. (2015) Social Cognitive Psychology. Beijing Normal Univer-sity Press, Beijing, 34-38.
[5] Jin, X. (2008) Experimental Research on Consumers’ Implicit Stereotype of the Quality of Television Brands. Northeast Normal University, Changchun.
[6] Li, D.W. (2012).Study on College Students’ Social Attitude towards Luxury Brands. East China Normal University, Shanghai.
[7] Pan, F. (2012) Study on Aesthetic Appreciation of Brand Clothing. East China Normal University, Shanghai.
[8] Zhao, J. (2015) Study on the Stereotype and Rebranding of the Clothing Brands in Chinese Online Market. Beijing Jiaotong University, Beijing.
[9] Jiang, H.Y., Wang, H.Z. and Chen, Z.X. (2013) The Effects of Mental Processing Mode on the Changeover of Country-of-Origin Related Stereotypes—How to View the “New Clues” of Emerging Countries. Journal of Sun Yatsen University (Social Science Edition), 53, 189-200.
[10] Li, D., Zhang, Y.T. and Tang, G. (2015) Research on the Relationship between Consumers’ Interaction and the Image of Brand Origins. Commercial Research, 57, 116-122.
[11] He, X.Z. and Liu, D.B. (2014) Research on the Place-of-Origin Stereotype and Con-sumer Behavior Model. Journal of Systems Engineering, 29, 160-170.
[12] Wang, H.Z. and Zhao, P. (2004).Country of Brand Effect: An Empirical Study in China and Its Marketing Managerial Implications. China Industrial Economy, 1, 78-86.
[13] Vrlegh, P.W.J. and Steenkamp, J.B.E.M. (1999) A Review and Meta-Analysis of Country-of-Origin Research. Journal of Economic Psychology, 20, 521-546.
https://doi.org/10.1016/S0167-4870(99)00023-9
[14] Dimofte, C.V., Johansson, J.K. and Ronkainen, I.A. (2008) Cognitive and Affective Reactions of U.S Consumers to Global Brands. Journal of International Marketing, 16, 113-135. https://doi.org/10.1509/jimk.16.4.113
[15] Wang, S.J. (2010) Experimental Research on College Students’ Stereotype of the Origin Place of Laptop. Anhui Normal University,Wuhu.
[16] Wang, S.J. (2011) Implicit Research on College Students’ Stereotype of the Origin Place of Laptop. Journal of Jincheng Institute of Technology, 4, 85-88.
[17] Janna, S. and Rao, C.P. (1997) The Effect of Country-of-Origin Related Stereotypes and Personal Beliefs on Product Evaluation. Psychology and Marketing, 14, 689-702.
https://doi.org/10.1002/(SICI)1520-6793(199710)14:7<689::AID-MAR4>3.0.CO;2-C
[18] Josiassen, A., Assaf, A.G. and Karpen, I.O. (2011) Consumer Ethnocentrism and Willingness to Buy: Analyzing the Role of Three Demographic Consumer Charac-teristics. International Marketing Review, 28, 627-646.
https://doi.org/10.1108/02651331111181448
[19] Klein, J.G. (2002) Us versus Them, or Us versus Everyone? Delineating Consumer Aversion to Foreign Goods. Journal of International Business Studies, 33, 345-363.
https://doi.org/10.1057/palgrave.jibs.8491020
[20] Knight, G.A. (1999) Consumer Preferences for Foreign and Domestic Products.
Journal of Consumer Marketing, 16, 151-162. https://doi.org/10.1108/07363769910260524
DOI: 10.4236/ajibm.2019.98111 1711 American Journal of Industrial and Business Management
Prentice Hall, Inc., Upper Saddle River, NJ.
[23] Douglas, B.H. and Craig J.T. (2004) Man-of-Action Heroes: The Pursuit of Heroic Masculinity in Everyday Consumption. Journal of Consumer Research, 31, 425-440.
https://doi.org/10.1086/422120
[24] Sung, Y.J. and Spencer, F.T. (2005) Brand Personality Structures in the United States and Korea: Common and Culture-Specific Factors. Journal of Consumer Psychology, 15, 334-350.https://doi.org/10.1207/s15327663jcp1504_8
[25] Beverly, T.V., Gregory, M.R., Victoria, D.B. and Faye, W.G. (2005) The Role of Brand Personality in Charitable Giving: An Assessment and Validation. Journal of the Academy of Marketing Science, 33, 295-312.
https://doi.org/10.1177/0092070305276147
[26] Jiao, L. (2007) Comparative Research on Chinese and Overseas Telephone Brand Images—An Empirical Research Based on A.L.Biel Model. Shandong University, Jinan.
[27] Han, J.S. (2012) Empirical Analysis of Telephone Brand Loyalty of Taiyuan College Students. Shanxi University of Finance & Economics, Taiyuan.
[28] Xu, D.K. and Wang, H. (2016) Research Report on the Influencing Factors in Tele-phone Brand Loyalty—From the Perspective of College Students. Market Moderni-zation, 3, 12-13.
[29] Guo, H.J. (2012) Study on the Brand Reputation of Domestic Telephone among Chinese College Students. MarketModernization, 9, 25-27.
[30] Greenwald, A.G., McGhee, E. and Schwartz J.L.K. (1998) Measuring Individual Differences in Implicit Cognition: The Implicit Association Test. Journal of Perso-nality and Social Psychology, 74, 181-198.
https://doi.org/10.1037//0022-3514.74.6.1464
[31] Greenwald, A.G. and Banaji M.R. (1995) Implicit Social Cognition: Attitudes, Self- Esteem, and Stereotypes. PsychologicalReview, 102, 4-27.
https://doi.org/10.1037/0033-295X.102.1.4
[32] Cai, H.J. (2003) A Review on Implicit Association Test. Advances in Psychological Science, 11, 339-344.
[33] Greenwald, A.G. and Nosek, B.A. (2003) Understanding and Using the Implicit Association Test: An Improved Scoring Algorithm. Journal of Personality and So-cial Psychology, 85, 197-216.https://doi.org/10.1037/0022-3514.85.2.197
[34] Cohen, J. (1969) Statistical Power Analysis for the Behavioral Sciences. Academic Press, New York, 101-105.
[35] Zuo, B., Zhang, Y.Y., Zhao, J. and Wang, J. (2006) The Stereotype Content Model and Its Researches. Advances in Psychological Science, 14, 138-145.
[36] Schooler, R.D. (1966) Product Bias in the Central American Common Market.
Journal of Marketing Research, 8, 18-19.https://doi.org/10.1002/tie.5060080211
[37] Shi, Z., Wen, L. and Fan, L. (2012) How Chinese Face Perception Influences Con-sumer’s Implicit and Explicit Attitude towards Brand Country of Origin. Interna-tional Journal of Business & Management, 7, 123-139.
https://doi.org/10.5539/ijbm.v7n5p123
[38] Yuan, G.X. (2009) Study of the Automotive Consumption Behaviors on the White- Collar Males. University of Electronic Science and Technology of China, Chengdu. [39] Zhang, C.X. and Hou, G.F. (2014) Marketing Strategies to Enhancing Brand Loyalty