Munich Personal RePEc Archive
A Mixed Integer Linear Programming
Model to Regulate the Electricity Sector
Polemis, Michael
University of Piraeus, Hellenic Competition Commission
30 January 2018
Online at
https://mpra.ub.uni-muenchen.de/86282/
A Mixed Integer Linear Programming Model to Regulate the Electricity Sector
Michael L. Polemisa,b
a Department of Economics, University of Piraeus, Piraeus, Greece, [email protected] b Hellenic Competition Commission, Athens, Greece
Abstract
This paper introduces the concept of market design and make the distinction between the three
different levels of market design such as industry structure, wholesale and marketplace design. We
present a mixed-integer linear programming (MILP) model for the optimal long-term electricity
planning of the Greek wholesale generation system. In order to capture more accurately the technical
characteristics of the problem, we have divided the Greek territory into a number of individual
interacted networks (geographical zones). In the next stage we solve the system of equations and
provide simulation results for the daily/hourly energy prices based on the different scenarios adopted.
The empirical findings reveal an inverted-M shaped curve for electricity demand in Greece, while
the SMP curve is also non-linear. Lastly, given the simulations results, we provide the necessary
policy implications for government officials, regulators and the rest of the marketers.
JEL codes: C60; Q40; L94;
1. Introduction
During the last years, there is a process in the European Union (EU) towards the integration of
electricity markets, through market coupling and the establishment of a common Target Model. This
is done mainly through the introduction of wholesale electricity markets (exchange type) and the
unbundling of the traditional vertically integrated monopolies. The pioneer in the electricity sector
reform was Chile, commencing its efforts in 1982. Since then, many EU countries (i.e. Germany,
France, United Kingdom, Belgium, etc) deregulated their electricity markets, following different
paths. The differences in the pace and extent of market reforms are mainly related to the starting
point of each reform and the problems associated with the internal environment of the market. This is
more evident in Europe, where although a goal for a single market has been set back in 1996
(Directive 96/92/EC), different levels of unbundling and introduction of competition have been
implemented across the member states (Fiorio and Florio, 2013).
There is a substantial body of literature estimating the optimal planning of the wholesale electricity
market. One strand of literature tries to investigate the price responsiveness of electricity consumers,
based on non-dynamic electricity prices neglecting demand response to real-time market prices
(Wolak, 2011; Genc, 2016; Clastres and Khalfallah, 2015). The other strand of literature identifies
that demand response resources may have noticeable impact on the electricity markets’ operation
(Magnago et. al., 2015; Jiang et. al., 2014; Philpott et. al., 2000; Downward et. al., 2016; Dagoumas
and Polemis, 2017).
The aim of this paper is to build a MILP model that will be used mainly in order to simulate the
daily/hourly energy prices in the Greek electricity industry. For this reason, it attempts to quantify all
the parameters of an optimization problem, integrating a unit commitment model, which is applied in
case of the Greek power system. The Unit Commitment (UC) problem identifies the units that will
variable costs, their bidding strategy, the ancillary services and other technical criteria required by
the Transmission System Operator (TSO). In order to capture more accurately the technical
characteristics of the problem, we have divided the Greek territory into a number of individual
interacted networks (geographical zones).optimization problem the computation of daily/hourly
energy prices.
This paper contributes to the relevant literature in several ways. First, our model, tries to identify the
main determinants of the optimal planning of the wholesale electricity market. For this reason, we
measure the impact of certain main parameters such as the selection of the power generation
technologies, the type of fuels used in the electricity generation procedure and lastly the power plant
locations. Second, it provides a price signal on the profitability of retailers. Third, our model
identifies the retailers risk generated from their price responsive customers. Based on the above, it is
worth mentioning that the Greek electricity market incorporates a complex mathematical algorithm,
considering economic and technical characteristics. The motivation of this paper is to present the
formulation of the Day-Ahead Scheduling (DAS) problem in the Greek mandatory wholesale
market. We also tried to sketch some of the most important issues that market designers have to deal
with in Greece's wholesale electricity market such as the role of imports/exports, hydro plants,
renewable energy sources and priced demand.
The rest of the paper is organised as follows. Section 2 describes the functioning of the electricity
industry in Greece, while the mathematical formulation of the model is provided in Section 3. In
Section 4, we present the simulation results of our energy model using different scenarios. Finally,
Section 5 concludes the paper offering some useful policy recommendations.
2. The electricity sector in Greece
constraint. In particular, the incumbent remained dominant in both the generation and the retail
sectors, retaining exclusive access to cheap lignite and hydro resources, while retail prices, despite
the gradual removal of cross-subsidies, remained unlinked to wholesale prices. This combination of
unfavourable market conditions posed severe obstacles to new entrants in the early years of market
liberalisation, resulting in capacity shortage over the subsequent years. The Greek electricity market
incorporates a complex mathematical algorithm, considering economic and technical characteristics.
Figure 1 provides an overview of the Greek electricity market, showing the linkages between the
Day-ahead market and the real-time dispatch schedule. The main responsibility of the Organised
Electricity Market (OEM) is the determination of the Day-Ahead electricity price, considering the
energy offers and the load declarations of participants as well as the technical characteristics of the
[image:5.595.77.492.386.681.2]system.
Figure 1: Overview of the Greek wholesale market
Source: Polemis and Dagoumas, (2013)
More specifically, the day-ahead procedure (Day Ahead Market Clearing) produces a System
each unit. The solution of the day-ahead procedure will be based on the co-optimization of the
energy offers (energy market) and reserve offers (balancing market) in order to satisfy the energy
demand and reserve requirements, while the transmission system zonal constraint mechanism will
introduce an additional constraint. The liberalization of the electricity market and the incentives
given by the Greek state, have led to a change in the fuel mix through the on-going penetration of
natural gas and renewables. Moreover, the operation of the electricity market has led to
re-adjustments of the electricity tariffs, as the suppliers were in position to compete with the tariffs of
the PPC and have taken an important share of the market. This was highly influenced by the level of
demand. In a neoclassical market, which “obeys” the laws of demand and supply as the Greek electricity industry is operating, if the demand is decreased, the SMP either remains stable or is
decreased. The decrease can be significant due to the significant difference in the variable cost (and
consequently in the energy offers) between lignite and natural gas units. The usage of the
interconnection capacity is also playing important role in the determination of the SMP. Therefore
the price is highly dependent on the economic offers of the participants and on the level of the
electricity demand. On the other hand, the electricity demand is highly influenced by the electricity
prices.
3. Model
In this section, we present the Day Ahead Scheduling (DAS) problem under a MILP framework in
order to determine the strategic (e.g., construction of new plants, capacity expansion) and operational
(e.g., flows of electricity and energy resources) decisions1. In order to preserve space and to enhance
the readability of the model, the description of the variables (nomenclature) is included in the
Appendix A (see Tables A1 and A2).
1 The size of the problem is rather large since it contains 50 dispatchable units (31 thermal and 19 hydro). The variables
This study constitutes an integrated approach which combines a unit commitment model (MILP)
well-grounded at an hourly level with the three distinct aspects of market design (i.e industry
structure, wholesale and marketplace design). This approach is based on similar studies in the
literature (Koltsakis and Georgiadis, 2015, Koltsakis et al, 2014; Koltsakis, et, al, 2015; Dagoumas
and Polemis, 2017; Lu et al, 2018), which presented a market-based medium-term power systems
planning model. However, this work is further extended to capture some of the most important issues
that regulators and system operators have to deal with in Greece's wholesale electricity market such
as the role of imports/exports, hydro plants, renewable energy sources and priced demand.
3.1Objective function
In the DAS problem we face a discrete type of auction where offers and bids refer to quantities of
energy (blocks). Thus, the objective function has to describe the maximization of the difference
between the value of all energy blocks which demand side would pay and the amount of money that
supply side would be paid in order to generate these energy blocks. Actually, it is the maximization
of the difference between the demand and supply revenue streams. The maximization though is not a
simple difference since in the market participate many players and each of them submits bids or
offers for many energy blocks. Additionally, though all the offer and bid quantities refer to one-hour
time period, the optimization is conducted for a wider time frame which is typically 24 hours. A
simplified illustration of the objective function of the DAS problem is given by:
max
S
S j
j
t S t S t
D
D j
j
t D t
DjP j Q jP j
Q
1 1
24
1 1
)
where energy blocks are denoted with j, demand side players with D and supply side players with S.
Actually, the objective function is the difference between the demand and the supply PxQ products
where P is the price and Q the quantity of each energy block within the 24- hours time frame.2
3.2 Model constraints
Model constraints concern the power system as a whole and refer to issues such as load satisfaction,
power flow congestion, exchanges with other power systems through interconnections and system
requirements for ancillary services. These are described in the next sub sections.
3.2.1 Load Constraints
These constraints are formulated for each specific zone that has been defined by the corresponding
study done by OEM. The power system is divided in geographical zones in such a way that reflects
possible appearance of congestion in power flow. It is assumed that there are two geographical
regions that define the zones: northern and southern Greece. Load constraints are set for both zones
and their purpose is to express and at the same time to assure the balance between load and
generation. These load constraints, in their general form, are expressed by the following simplified
relation:
(Zonal Demand – Zonal Generation + Zonal Exports – Zonal Imports) = 0 (2)
The structure of the analytical form of these constraints is similar to the structure of the objective
function with some differences: loss factors are applied to all load and generation quantities and
reserve quantities for ancillary services are not included in the load constraints. The last two
variables expressing zonal imports and exports are mutually excluded (i.e. if one of them takes a
positive value the other is set equal to zero).
For z =1 (North) and for everyDispatch Period t 0 1 1 1 1 1 2 2 1 1 1 , 1 1 1 , 1 1 , 1 1 1 , min 1 , 1 1 1 , 1 1 1 , 1 1 1 , 1 1 ,
t z z t z z r r t r t j j con con t con t s s t j t u u s s t u t u t u pm pm s s t pm t pm k k s s t k t k pp pp s s t pp t pp p p t p t p x x x a x a x a x Q y a x a x a x a xa s s s u s j s con r
(3)
Non-Priced Priced Exports Pumped Storage Dispatchable Imports Contracted
non-Priced Zonal Zonal
Load Load Units Units Units
Generation Exports Imports
Demand Supply
For z =2 (South) and and for everyDispatch Period t
0 1 1 1 1 2 1 1 2 1 2 , 1 1 2 , 1 2 , 1 1 2 , min 2 , 1 1 2 , 1 1 2 , 1 1 2 , 1 2 ,
t z z t z z r r t r t j j con con t con t s s t j t u u s s t u t u t u pm pm s s t pm t pm k k s s t k t k pp pp s s t pp t pp p p t p t p x x x a x a x a x Q y a x a x a x a xa s s s u s j s con r (4)
3.3 Transmission Constraints
Interzonal power flow constraints refer to the capability of the transmission lines that connect the
zones mentioned above:
t
t1 2 z1 z2z
z FL
x (5)
t
2 1 z2 z1t z
z FL
x (6)
Equation (5) denotes that the power flow from zone 1 (northern Greece) to zone 2 (southern Greece)
cannot exceed a certain amount (FLz1→z2). Equation (6) denotes the same for the flow from zone 2 to
zone 1. If the transmission constraints are activated during the Day-Ahead Scheduling procedure
then the differential variable generation cost of each unit is used instead of the offered prices
declared in the Injection Offers. If still the transmission constraints are activated then the problem is
solved with these constraints on and different marginal prices are calculated for different system
regions.
3.3.1 System Interconnections Capacity Constraints
These constraints are set in order to control the import and export flow regarding to the capacity of
the interconnection transmission lines. The first constraint (Eq. 7) is set at node level. More
specifically, it denotes that for each Dispatch Period t, the sum of all quantities to be exported from
node m, from all exporters k, is less than or equal to the exporting capacity of the specific node
IntCexptm. Constraint (Eq. 8) expresses the same, but for a set (m*) of interconnection nodes (e.g. all
the north interconnections).
t m,
t
m Exp k
k s
s z t
k IntC
x s
m
m
m
1 1
,
10
t m*,
t
m Exp k k s s z t k IntC x s * 1 1 , m m m
(8)where mm*
Constraint (9) denotes that for each Dispatch Period t, the sum of all quantities to be imported from
node m, from all importers j, is inferior to the importing capacity of the specific node IntCimptm.
Constraint (10) expresses the same, but for a set (m*) of interconnection nodes (e.g. all the north
interconnections).
t m,
t
m imp j j s s z t j IntC x s
m m m 1 1 , (9) t m*, t
m imp j j s s z t j IntC x s * 1 1 , m m m
(10)where mm*
Additionally, two more constraints, (11) and (12), are set for the total exporting and importing
capacity of the system. Constraint (11) implies that for each Dispatch Period t, the sum of all
quantities to be exported from all nodes, from all exporters j, is less than or equal to the exporting
capacity of the system expt
sys. Respectively, constraint (12) implies that that for each Dispatch Period
t, the sum of all quantities to be imported from all nodes, from all exporters j, is less than or equal to
to the importing capacity of the system imptsys.
t
syst
k k s s z t k exp x m m s
1 1 ,
m (11)
t
tsys
3.3.1 System Requirements for Ancillary Services Constraints
The following set of constraints refers to system’s requirements for ancillary services (primary
reserve, secondary range reserve and tertiary reserve – spinning and non spinning).
3.4 Primary Reserve Requirements Constraints
Constraint (13) denotes that for a specific Dispatch Period t, the sum of all reserve quantities for
primary reserve from all units u must be equal to or greater than the system total requirement for
primary reserve QPRt.
t
PRt
u z t u
PR Q
x
,(13)
3.4.1 Secondary Reserve Requirements Constraints
Constraint (15) refers to the upward reserve range for secondary control and denotes that for each
Dispatch Period t, the sum of all reserve quantities for upward secondary reserve from all units u
must be equal to or greater than system’s required generation increase for secondary control Q upSEC t.
t
SECup t u
z t up
SEC Q
x
u
,(14)
Similarly, for the downward reserve range for secondary control constraint (15) denotes that for
each Dispatch Period t, the sum of all reserve quantities for downward secondary reserve from all
units u, must be equal to or greater than system’s required generation decrease for secondary control Q dwSEC t.
t
dw t
SEC u tz
dw
SEC Q
x
u
,12
In that case the total generation output variations, within a Dispatch Period t, must respect system
ramp-up and ramp-down capability. Constraint (16) implies that, for each Dispatch Period t, the
maximum expected increase of total generation for secondary control, calculated as the sum of
the upward secondary reserve of all generation units, must not exceed system’s ramp-up rate R
up
sys, expressed in MW/h per 60 min.
t
up
sys u tz
up
SEC R
x
u
,(16)
Respectively, constraint (17) denotes that, for each Dispatch Period t, the maximum expected
decrease of total generation for secondary control, calculated as the sum of the downward
secondary reserve of all generation units, must not exceed system’s ramp-down rate R dwsys,
expressed in MW per 60 min.
t
dw
sys u
z t dw
SEC R
x
u
,(17)
3.4.2 Tertiary Reserve Requirements Constraints
Constraint (18) implies that for each Dispatch Period t, the spinning (xST)and non spinning (xNST)
reserves of all units, for tertiary control must be equal to or greater than system’s total
requirements for tertiary reserve QTER t.
reg t,
regt
TER u
z t
u NST u
z t
u
ST x Q
x
reg
reg reg
reg
, ,(18)
Index reg here denotes the constraint may be implemented once for the whole system or more
than once for different sub regions of the system, for operational reasons. These sub regions are
4. Assumptions and simulation results
This section provides assumptions and simulation results of the various scenarios under
consideration.3 Specifically, the scenarios examined in this study concern the cases where the
retailers’ customers are price sensitive or not. Similar to Koltsaklis and Georgiadis (2015), Koltsakis
et al, (2016) and Dagoumas and Polemis, (2017) the problem to be addressed is concerned with the
hourly energy balance of a specific power system including the optimal dispatch of power generating
units (UCP). Therefore the problem under consideration is formally defined under the following
assumptions:
a) The scheduling period includes hourly time steps , where the electricity market operator
determines the optimal scheduling plan for the 24 hours of the next day (day-ahead market).
b) The power system under consideration is split into a number of subsystems . These
subsystems are further divided into a certain number of zones to better represent the system’s regional/spatial characteristics.
c) A set of power generating units is installed in each subsystem (or zone ).
This set includes thermal units , hydroelectric units , (both referred to as
hydrothermal ones ) and renewable units . Each renewable unit is
characterized by a specific availability factor in each zone and time period, . Each unit
is characterized by a specific available power capacity .
d) The available power capacity of each hydrothermal unit is divided into a number of
blocks , to fully represent the operational characteristics of each unit and the real
operation of power markets. In each time period and for each power capacity block, each
hydrothermal power generating unit provides a specific amount of energy (to be determined by the
optimization process) at a specific price (marginal cost), (incorporating variable operating
14
and maintenance cost, fuel cost, and CO2 emissions cost) in order for the power demand in each
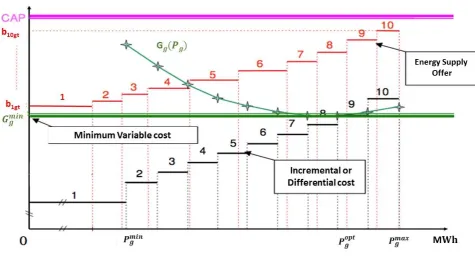
subsystem and time period, , to be covered. Figure 2 presents the energy supply offer for a
thermal unit u, compared to its incremental cost and its minimum variable cost, for different power
[image:15.595.59.535.210.471.2]outputs, among unit’s technical minimum and technical maximum .
Figure 2: Energy supply offer for a thermal unit (Euro/MWh)
e) The same rule applies to both electricity imports from each interconnected system, (or
zone ), and load representatives such as power exports to other interconnected systems
(or zone ), and pumping load . More specifically, the power capacities of each
interconnection and pumping load , is divided into certain blocks ( for
imports, for exports, and for pumping load), having a certain marginal cost
for imports, and a given bid for exports and for pumped storage
units.
f) Apart from the priced component of each unit’s energy offer function, there can be a non -priced one (zero marginal cost), , including mandatory hydroelectric injection, power
g) With reference to the operational cycle of each hydrothermal unit : after a shut-down
decision has been taken for each unit, it has to remain off (non-operational) for at least hours,
i.e., it is associated with specific minimum down time. A certain cost is associated with the
shut-down decision of each unit , .
h) According to the real non-operational time of each unit , , there are three
available start-up types { when a start-up decision is determined by the
model. There are specific time limits after which each unit changes stand-by condition,
including time before going from hot to warm ( ) and warm to cold stand-by condition ( )
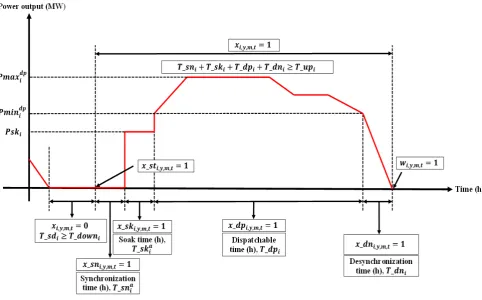
respectively. After the determination of the appropriate start-up type decision, each unit enters the
synchronization phase followed by the soak phase, which have a duration of and
hours respectively, during which phases unit’s power output is zero and respectively. The
duration of both phases is dependent on the selected start-up type decision . After the
completion of the soak phase, each unit enters the dispatchable phase, wherein its power
output range from its technical minimum, , to its technical maximum, , or from to
, if that unit is selected for providing secondary reserve. During that phase, each unit is
characterized by specific up, , and down, , ramp rates, or, , when providing secondary
reserve (up and down). The last operational stage of each unit is that of desynchronization
with a duration of hours. A unit is considered operational when it operates in each
one of the aforementioned phases, i.e., synchronization, soak, dispatch and desynchronization. The
total operational time of each unit must be greater than or equal to its minimum up time, in order
16
Figure 3: Different phases of the operation of a thermal unit (MW)
i) The power system’s requirements include: (i) electricity demand requirements in each subsystem and time period, , (ii) primary-up reserve requirements in each time period, , (iii)
secondary-up, , and secondary-down, , reserve requirements in each time period, (iv)
fast secondary-up, , and fast secondary-down, , reserve requirements in each time
period, and (v) tertiary reserve requirements in each time period, .
j) When it comes to power reserve provision capabilities, each unit is identified based
on: (i) upper bound on the provision of primary reserve, , (ii) upper bound on the provision of
secondary reserve, , (iii) upper bound on the provision of tertiary spinning, , and
non-spinning reserve, . Each unit’s energy reserve offer has a certain price, i.e., for the primary energy reserve, and for the secondary range energy offer, while tertiary energy offer
k) The electricity demand is considered to be responsive to price signals. The final consumers
respond to fluctuations of the , when a tolerance level is activated for a customer type
. This tolerance concerns the percentage of change between the and the .
Practically, when final consumers find a price spike, positive or negative, where they respond by
decreasing or increasing respectively their consumption.
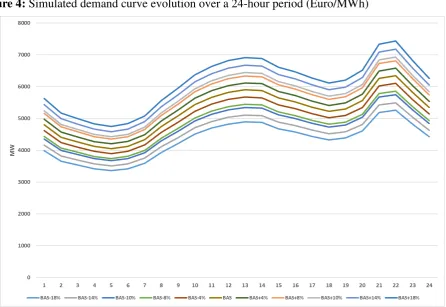
Based on the above considerations, we proceed with the simulations results. For the purpose
of our study we implement a Monte Carlo analysis, assuming a ± 20% deviation over its reference
prices (Dagoumas and Polemis, 2017). In the following figures the simulation results (compared to
the baseline scenario) of the total electricity demand and the SMP evolution over a 24hour period are
portrayed. From the inspection of Figure 4, it is obvious that the day-ahead electricity market is
[image:18.595.75.522.396.703.2]characterized from non-linearity in the effect of demand response.
18
This finding which has also been found to other studies (see Dagoumas and Polemis, 2017),
stipulates that electricity demand in Greece follows an inverted-M shape. In other words, the
simulated pattern implies that total electricity demand is characterized by strong cyclicality effects.
Based on the existence of such effects, a decrease in electricity consumption is evident late at nights
or early in the evening. On the contrary, electricity demand spikes are existent during the day or late
in the evening hours. This result raises important policy implications in terms of market regulation
toward a more effective electricity management in Greece. Specifically, the existence of a cyclical
pattern in the electricity demand is important primarily to the Transmission System Operator (TSO)
which must match electricity supply to demand in real time. Changes in electricity demand levels are
generally predictable and have daily, weekly, and seasonal patterns. In this case, electricity demand
levels rise throughout the day and tend to be highest during a block of hours ("on-peak") which
usually occurs between 7:00 a.m. and 10:00 p.m. on weekdays and lower during the “off-peak” hours
( between 22:00 a.m. and 5:00 p.m. and during the weekends). Moreover, a stable predictable pattern
of electricity demand is also useful to the regulator which may lower any discrepancies in the
transmission system (i.e brown outs) in order to achieve one of its primary goals namely the energy
security supply. Lastly, the existence of an inverted-M shape curve in the electricity consumption,
may also affect the electricity supply side since the stakeholders of a power plant (i.e investors,
stockholders, etc) may address the demand fluctuations in a more efficient way. Similarly, the SMP
follows a non-monotonic pattern during the 24hour period (see Figure 5). However, in this case,
cyclicality effects are absent. This raises important implications. Firstly, similarly to other studies
(see for instance Lu et, al, 2018; Dagoumas and Polemis, 2017; Koltsakis et, al, 2016) a linear
fluctuation of total electricity demand, due to demand response, leads to non-linear evolution the
SMP. Secondly, the non-linear evolution of SMP is strongly linked to a number of factors such as the
marginal cost of the power plants, the bidding strategies of the market players during the Day Ahead
Figure 5: Simulated SMP variation over a 24-hour period (Euro/MWh)
Based on the simulation results of the MILP some important policy implications emerge.
First, the non-monotonic relationship between aggregate demand (appeared in an inverted-M shape)
and the evolution of intra-day SMP (expressed in a non-cyclical pattern), stimulates risk for the
incumbent firms in the retail segment of the industry (i.e retailers, suppliers, importers and exporters
of electricity). This outcome might lead even to short-term losses for some short-term periods,
affecting strongly the variability of the undertakings. Moreover, this may negatively affect the
decision of the private firms to enter the Greek electricity industry by incurring high market entry
and investment costs. Second, the MILP model provides the necessary price signals on the
profitability of retailers, in their effort to formulate the necessary tariff rates. In this case, the
proposed model may act as a pivotal study in order to uncover possible distortions and flaws of the
Day Ahead Market. Third, the model is also useful for policy makers, government officials and
regulatory bodies (i.e. transmission and distribution system operators), considering that it identifies
the effect of demand responsiveness to the fluctuations of wholesale prices (SMP). Moreover, it
20
fluctuations giving important level of information to the market participants (incumbent, independent
power plants, retailers, etc) and the possible entrants.
5. Conclusions
In this paper, we present a MILP model for the optimal long-term electricity planning of the
Greek wholesale generation system. In order to capture more accurately the technical characteristics
of the problem, we have divided the Greek territory into a number of individual interacted networks
(zones). The proposed model determines the optimal planning of the wholesale electricity market,
the selection of the power generation technologies, the type of fuels and the plant locations so as to
meet the expected electricity demand and possible environmental concerns. Despite the fact that the
formulations of the model components are not introduced for the first time in the literature, their
combination form a model with many significant parameters and restrictions suitable for policy
modelling. For this reason, we assure that the model was implemented and thoroughly tested on a
real data set from a recently liberalized electricity market.
Based on the above analysis, we argue that the Greek wholesale electricity market is a
day-ahead mandatory pool scheme that provides a day day-ahead firm price based upon the supply/demand
balance that ensures efficient short term dispatch taking in to account generation unit constraints,
reserve requirements and a simplified transmission system zonal constraint mechanism. The
day-ahead procedure (Day Ahead Market Clearing) produces a SMP for each settlement period (one
hour) and a 24 hour production schedule for each unit. The solution of the day-ahead procedure is
based on the co-optimization of the energy offers (energy market) and reserve offers (balancing
market) in order to satisfy the energy demand and reserve requirements, while the transmission
system zonal constraint mechanism will introduce an additional constraint. A regulated SMP price
cap will be determined in order to prevent excessive price spikes in the event that insufficient
capacity is declared available to meet the demand. Offers will be firm at the day-ahead market.
according to their day-ahead schedule. Changes in availability will result in an exposure to the
imbalance price. Likewise, levels of demand declared by suppliers will also be firm and deviations
will be liable for settlement at the imbalance price. Therefore, during the Day Ahead Settlement,
generators are paid at the day-ahead SMP for their scheduled generation while there is no
remuneration for the scheduled reserves. On the other hand, suppliers pay the day ahead SMP for
their declared load.
Lastly, the proposed model provides useful insights into the risk of retailers and therefore acts
as a pivotal study to policy makers and practitioners (i.e. regulators, TSO, DSO) active in the Greek
electricity market.
22
References
Clastres C, Khalfallah H, 2015, An analytical approach to activating demand elasticity with a
demand response mechanism, Energy Economics, Vol. 52, pp. 195-206
Downward A., D. Young, G. Zakeri, 2016, Electricity retail contracting under risk-aversion,
European Journal of Operational Research, Vol. 251, pp. 846-859
Fiorio, Carlo, and Massimo Florio. (2013). Electricity Prices and Public Ownership: Evidence From
the EU15 Over Thirty Years, Energy Economics 39: 222–232.
Genc TS, 2016, Measuring demand responses to wholesale electricity prices using market power
indices, Energy Economics, Vol. 56, pp. 247–260
Koltsaklis NE, Dagoumas AS, Kopanos GM, Pistikopoulos EN, Georgiadis MC. 2014. A spatial
multi-period long-term energy planning model: a case study of the Greek power system. Applied
Energy 115:456–82.
Koltsaklis NE, Georgiadis MC., 2015, A multi-period, multi-regional generation expansion planning
model incorporating unit commitment constraints. Applied Energy, Vol. 158, pp. 310-331
Koltsaklis NE, AS Dagoumas, MC Georgiadis, G Papaioannou and C Dikaiakos, 2016, A mid-term,
market-based power systems planning model, Applied Energy, Vol. 179, pp. 17-35
Lu Renzhi., Hong H,S., Zhang X 2018. A dynamic pricing demand response algorithm for smart
grid: Reinforcement learning approach, Applied Energy 220: 220-230.
Magnago FH, J Alemany and J Lin, 2015, Impact of demand response resources on unit commitment
and dispatch in a day-ahead electricity market, International Journal of Electrical Power & Energy
Systems, Vol. 68, pp. 142–149
Philpott A.B., M. Craddock, H. Waterer, 2000, Hydro-electric unit commitment subject to uncertain
demand, European Journal of Operational Research, Vol. 125, pp. 410-424
Polemis, M., and A. Dagoumas. (2013). The Electricity Consumption and Economic Growth Nexus:
Dagoumas, A and Polemis, M. (2017). An integrated model for assessing electricity retailer’s profitability with demand response, Applied Energy, 198(C): 49-64.
Wolak, FA. 2011. Do Residential Customers Respond to Hourly Prices? Evidence from a Dynamic
24
Appendix A
Nomenclature 1. General Symbols and Indexes
x: real variables
y, dy: integer variables
t: Dispatch Period (t = 1,2, .., 24)
s:priced energy blocks of generation offers or Load Declarations (s = 1,2, …, 10) u: dispatchablegeneration units
r: refers to non-priced generation (e.g. RES, CHP, must-run hydro etc.)
u(hydro): refers to hydroelectric generation units (subset of u)
pm: refers to pumped storage units
i: refers to the prohibited (due to oscillations) generation level zones
pp: refers to Load Representatives that submit priced Load Declarations
p: refers to Load Representatives that submit non-priced Load Declarations
j: refers to importers
k: refers to exporters
con: refers to contracted units
m: interconnection nodes
z: refers to system’s zones
α: refers to loss factor
PR: refers to primary reserve
SEC: refers to secondary reserve
ST, NST: refers to spinning and non spinning tertiary reserve
Table A1: Variable description
VARIABLE DESCRIPTION CODE SYMBOL
Real Variables
z t pps
x , Priced load of block s, in the Load Declaration of Load Representative pp,
to be satisfied in zone z during the Dispatch Period t.
s z t pps
x , = DASQpt
z t p
x, Non Priced load to be satisfied in zone z during the Dispatch Period t,
corresponding to the Load Declaration of Load Representative p.
DASQpt
(1 grade only)
z t ks
x, Dispatched quantity of the offer block s of the exporter k to be exported
from an interconnection node of zone z, during the Dispatch Period t.
sz t ks
x , = DASQkmt
z t pms
x, Priced load to be satisfied in zone z during the Dispatch Period t,
corresponding to the Load Declaration of the pumped storage unit pm. -
z t js
x, Dispatched quantity of the offer block s of the importer j to be injected in
an interconnection node of zone z, during the Dispatch Period t.
sz t
js
x, =DASQjmt
z t r
x, Dispatched non-priced quantity of the generation unit r, located in zone z,
during the Dispatch Period t.
s z t r
x , =DASQrt
z t con
x, Dispatched quantity of the contracted generation unit u, located in zone z,
during the Dispatch Period t. -
z t us
x, Dispatched quantity of the offer block s of the generation unit u, located in
zone z, during the Dispatch Period t.
s z t us
x , = DASQut
z t PRu
x , Generation quantity reserve corresponding to the Primary Reserve for the
generation unit u, located in zone z, during the Dispatch Period t. -
z t up SECu
x ,
Generation quantity reserve corresponding to the upward Secondary Reserve range for the generation unit u, located in zone z, during the Dispatch Period t.
- z t dw SECu x ,
Generation decrease corresponding to the downward Secondary Reserve range for the generation unit u, located in zone z, during the Dispatch Period t.
-
z t ST reg
u
x , Generation quantity reserve corresponding to the Tertiary Spinning Reserve for the generation unit u, located in zone z, during the Dispatch
Period t.
-
z t NST reg
u
x , Generation quantity reserve corresponding to Tertiary non-Spinning Reserve for the generation unit u, located in zone z, during the Dispatch
Period t.
-
Integer Variables
z t u
y, Commitmentstatus of generation unit u, located in zone z, during the
Dispatch Period t (1: online, 0: offline) -
z t AGC
y ,
26
generation unit u, located in zone z, during the Dispatch Period t.
(1: operation in AGC mode, 0: operation not in AGC mode)
z t DECu
y ,
Decommissioning status of generation unit u, located in zone z, during the Dispatch Period t
(1: the unit has just been decommitted, 0: all other statuses)
-
z t COMu
dy ,
Auxiliary integer variable denoting change in the operating status of generation unit u, located in zone z, during the Dispatch Period t (2: from offline to online, 1: no change, 0: from online to offline).
-
z t DECu
dy ,
Auxiliary integer variable denoting change in the operating status of generation unit u, located in zone z, during the Dispatch Period t (2: from online to offline, 1: no change, 0: from offline to online).
-
i uu
dz Auxiliary integer variable to formulate the either-or constraints for the
prohibited zones of a hydro electric unit. -
Dependent Variables
t
SMP System’s Marginal Price for the Dispatch Period t. DASMPt
t
LMP1 Locational Marginal Price in zone 1, for the Dispatch Period t. -
t
LMP2 Locational Marginal Price in zone 2, for the Dispatch Period t. -
t z z
x1 2 Transmission flow from zone 1 to zone 2 during the Dispatch Period t. -
t z z
Table A2: Input variables
VARIABLE DESCRIPTION CODE SYMBOL
cap
P Price Cap -
z t pps
P , Bid price of the load block s in the Load Declaration of Load
Representative pp in zone z, during the Dispatch Period t. -
z t ks
P, Bid Price of the generation block the exporter k to be exported from an interconnection node in s in the Load Declaration of
zone z, during the Dispatch Period t.
-
z t pms
P, Bid price of the load block s in the Load Declaration of pumped
storage unit pm, locatedin zone z, during the Dispatch Period t. -
z t js
P, Price of the generation block j to be imported from an interconnection node in zone s in the Injection Offer of importer z, during
the Dispatch Period t.
-
u syn
P Start up cost of unit u -
z t us
P, Offer Price for the generation block generation unit u, located in zone z, during the Dispatch Period s in the Injection Offer of
t.
STEPPsut
z t PRu
P , Offer Price for the generation block corresponding to the Primary Reserve of the generation unit u, located in zone z, during the Dispatch Period t.
-
z t SECu
P , Offer Price for the block corresponding to the Secondary Reserve range of the generation unit u, located in zone z, during
the Dispatch Period t.
-
z t uNST
P , Offer Price for the generation corresponding to non-spinning Tertiary Reserve of the generation unit u, located in zone z,
during the Dispatch Period t.
-
t p
a Loss factor applied to the non-priced load, located in zonedeclared by the Load representative p, during the Dispatch z and
Period t.
-
t pp
a
Loss factor applied to the priced load, located in zone z and declared by the Load representative pp, during the Dispatch Period t.
-
t k
a Loss factor applied to the quantity to be exported by the exporter k from an interconnection node in zone z, during the Dispatch Period t.
-
t pm
a Loss factor applied to the load declared by the pumped storage
unit pm, located in zone z, during the Dispatch Period t. -
t u
a Loss factor applied to the quantity generated by the generation
unit u, located in zone z, during the Dispatch Period t. - t
j
a Loss factor applied to the quantity to be imported by the importer j from an interconnection node in zone z, during the
28 Dispatch Period t.
t
con
a Loss factor applied to the quantity generated by the contracted
unit con, located in zone z, during the Dispatch Period t. -
t
r
a Loss factor applied to the non-priced quantity generated by the
unit r, located in zone z, during the Dispatch Period t. -
2 1 z z
FL Limit of transmission flow from zone 1 to zone 2. -
1 2 z z
FL Limit of transmission flow from zone 2 to zone 1. -
t m Exp
IntC Interconnection transfer capability for exports at node m, during
the Dispatch Period t. -
t m Exp
IntC
*
Interconnection transfer capability for exports for the set of
nodes m*, during the Dispatch Period t. -
t m imp
IntC Interconnection transfer capability for imports at node m,
during the Dispatch Period t. -
t m imp
IntC * Interconnection transfer capability for imports for the set of
nodes m*, during the Dispatch Period t. -
t sys
exp Total system export capability, during the Dispatch Period t. -
t sys
imp Total system import capability, during the Dispatch Period t. -
t PR
Q Total system requirements for Primary Reserve, during the
Dispatch Period t. -
t up SEC
Q Total system requirements for upward Secondary Reserve, during the Dispatch Period t. -
t dw SEC
Q Total system requirements for downward Secondary Reserve, during the Dispatch Period t. -
up sys
R System’s overall ramp-up rate capability -
dw sys
R System’s overall ramp-down rate capability -
t reg TER
Q System requirements for Tertiary Reserve in geographical region reg, during the Dispatch Period t. -
u
Qmin Technical minimum of unit u. -
u
Qmax Technical maximum output capability of unit u. -
up u
R Rump-up rate of unit u -
dw u
R Rump-down rate of unit u -
AGC
u
Qmin Technical minimum of unit u, in AGC mode. -
AGC
u
u
AGC
RR Rump rate of unit u, in AGC mode. -
u
E Total daily production capability of the hydroelectric unit u. -
lw i u
FZ, Lower limit of the prohibited continuous operation zone i (due
to oscillations), of the hydroelectric unit u. -
up i u
FZ, Upper limit of the prohibited continuous operation zone i (due
to oscillations), of the hydroelectric unit u. -
z t us
Q, Generation quantity of block generation unit u, located in zone s in the Injection Offer of z, located in zone z, during
the Dispatch Period t.
s tz usQ , =STEPQsut
z t PRu
Q , Generation quantity corresponding to the Offer for Primary Reserve of generation unit u, located in zone z, during the Dispatch Period t.
-
z t SECu
Q , Quantity corresponding to the Offer for Secondary Reserve range of generation unit u, located in zone z, during the Dispatch Period t.
-
t
u AGC
R Ramp Rate of unit u, in AGC mode, during the Dispatch Period
t. -
z t u NST
Q ,
Generation quantity corresponding to non-spinning Tertiary Reserve capability of generation unit u, located in zone z, during the Dispatch Period t.
-
dw u
t
min Minimum down time of generation unit u -
up u
t
30
30
Appendix B
Two variables with no cost assignment are introduced at the end of the objective function corresponding to the total energy transferred from one zone to
the other. In fact these variables are dependent each other: when one of them is greater than zero the other is set equal to zero. The objective function is of
the following form:
max
con con cap z t con r r z t r t z j j s s z t j z t j pm pm s s z t pm z t pm k k s s z t k z t k cap p p z t p pp pp s s z t pp z tpp P x P x P x P x P x x P
x s s s s s s s s 1 , 1 , 24 2 1 1 , , 1 1 , , 1 1 , , 1 , 1 1 , , 0
Priced Load non-Priced Exports Pumped Storage Imports non-Priced Contracted Load
Units Generation Units
Demand Supply from non Dispatchable Units
0 0 1 2 0 2 1 01 , , , , , , , , , , 1 , , , min , , 1 t z z t z z u u z t u z t NST z t ST z t AGC z t SEC z t dw SEC z t SEC z t up SEC z t PR z t PR s s z t u z t u z t u z t u syn z t u
DEC P y Q P x P x P x P x P y x x P x x
y NST u u u u u u u u u s s u u
Synchronization Technical Blocks Primary Secondary Reserve Spinning
Non-Spinning Interzonal
Minimum Reserve Tertiary Tertiary
Power Flow
Appendix C
Unit Constraints
Unit constraints are the set of constraints that concern each unit that participates in the Day-Ahead
Scheduling and refer to minimum and maximum generation output capability, ramp-up and ramp-down
capability, reserves for ancillary services, commitment and decommitment statuses and some special
restrictions for hydroelectric units.
Synchronization Status Constraints
Constraint (C1) refers to the online/offline status of each unit, defining whether for the certain Dispatch
Period t, the unit provides energy and reserve for ancillary services. More specifically, for each Dispatch
Period t,the binary variable y t,zu denotes if the unit is synchronized or not. If this variable is set equal to
zero (unit not synchronized) then all the other variables of the constraint, which correspond to the energy
blocks and the reserve quantities for ancillary services, are also set equal to zero since the coefficient M of
the variable is a sufficiently big number (e.g. one thousand times the largest value of the technological
parameters and the right hind side of the mathematical problem). Its value is in purpose set, so that all the
variables take zero values each time the binary variable is equal to zero. In case that the binary variable is
equal to 1 (unit synchronized) then it is obvious that all the left-hand side of the constraint will be
negative due to the very big value of the coefficient M. When the binary variable is equal to 1, at least the
technical minimum of the unit is dispatched.
t u,
, , , , , 0
1
,
M y x
x x
x
x tz utz
u ST z t up SEC z
t dw SEC z
t u PR s
s z t
us u u (C1)
Technical Minimum Constraints with/without Automatic Generation Control (AGC)
Constraint (C2), which is related with the technical minimum of the unit and the Automatic Generation
Control mode operation for secondary control provision, has a twofold scope. First, it does not allow the
binary variable y t,zAGCuwhich indicates if the unit operates in AGC mode (y t,zAGCu = 1), to take value equal
to 1, when the synchronization status variable (y t,z
u) is set to offline (equal to zero).
t u,
min 0
, 1
, min
,
AGC u
z t AGC s
s z t u z
t
u Q u x s y Q u
y (C2)
Second, when the unit operates in AGC mode (y t,z
AGCu = 1) the technical minimum of the unit has a
different value (QminAGCu); in that case, constraint (21) artificially increases the technical minimum by
32
Maximum Capacity Constraints with/without Automatic Generation Control (AGC)
This constraint restrains the sum of all the variables that represent generation to exceed the technical
maximum of the unit (Qmaxu), for each Dispatch Period t. This is also restrained in the case where the unit
operates in AGC mode and the technical maximum has a different value (QmaxAGCu).
t u,
u u u su x x x x y Q Q Q
Q
y tz tAGCz u AGC
u ST z t u up SEC z t u PR s s z t u z t
u max max max
, , , , 1 , min ,
(C3)Ramp-Up and Ramp-Down Capability Constraints
Constraint (C4) refers to the ramp-up capability rate of a generation unit and restrains the unit from
increasing its generation output more than its technical capability within a Dispatch Period. It is valid
when the unit operates in both normal and AGC mode, where the ramp-up rate capability has a different
value.
t u,
uup tAGCz u
uup
s s z t u s s z t
u x R y RR R
x
u AGC s
s
, 1 , 1 1 , (C4)Respectively, constraint (C5) refers to the ramp-down capability rate of a generation unit and restrains the
unit from decreasing its generation output more than its technical capability within a Dispatch Period. It is
also valid when the unit operates in normal and AGC mode.
t u,
udw tAGCz u
udw
s s z t u s s z t
u x R y RR R
x
u AGC s
s
, 1 , 1 , 1 (C5)Special Constraints concerning the Hydroelectric Units
Constraint (C6) refers to the total generation capability of a hydroelectric unit within a Dispatch Day and
restrains the unit to be dispatched for a quantity than it cannot generate that Dispatch Day. The constraint
takes into account both the quantities included in the Injection Offer of the unit and the non-priced
(must-run hydro) quantities that have to be generated by the same unit.
hydro
u
trz u
t s
s z t
u x E
x
hydro s
hydro
) ( , 24 1 1 , ) ( )( (C6)
The second constraint (C7) refers to the prohibited (due to oscillations) generation level zones i for the
hydroelectric units and restrains the total generation output of the unit, for each Dispatch Period t, from
i t uhydro, ,
x FZuilw
dzui
Ms
s z t
us
1 , 1 , (C7) i t uhydro, , x FZ dzui M
up i u s s z t
us
, 1 , (C8)Ancillary Services Reserve Constraints
The following constraint (C9), for each Dispatch Period t, does not allow assigning to the unit primary reserve more than the quantity that represents unit’s capability to provide primary reserve (according its Techno-economic Declaration) and is included in its Reserve Offer (QPRI t,zu). If the unit is not dispatched,
the primary reserve quantity is automatically set equal to zero.
t u,
PRut,z ut,z PR t,z 0 u Q y
x (C9)
Similarly, for each Dispatch Period t, constraint (C10) does not allow assigning to the unit secondary reserve more than the range that represents unit’s capability to provide secondary reserve (according its Techno-economic Declaration) and is included in its Reserve Offer (QSEC t,zu). If the unit is not dispatched
or the unit does not operate in AGC mode (the binary variable yAGCt.zu= 0), the secondary reserve range is
automatically set equal to zero.
t u,
( , , ) , SEC t,z 0 z t u AGC z t dw z t up u u SEC u
SEC x y Q
x (C10)
Constraints (C11) and (C12) assure that for each Dispatch Period t the downward or upward variation in
the generation output for the provision of secondary control will not exceed the ramp rate (expressed in
MW per hour) of the unit whet it operates in AGC mode (RRAGCu).
t u,
, , 0
u u SEC AGC z t u AGC z t up RR y x (C11) t u,
, , 0
u u SEC AGC z t u AGC z t dw RR y x (C12)
The next constraint (C13), set for each Dispatch Per