Proceedings of the 56th Annual Meeting of the Association for Computational Linguistics (Short Papers), pages 20–24 20
Word Error Rate Estimation for Speech Recognition: e-WER
Ahmed Ali
Qatar Computing Research Institute QCRI
Doha, Qatar [email protected]
Steve Renals
Centre for Speech Technology Research University of Edinburgh
UK
Abstract
Measuring the performance of automatic speech recognition (ASR) systems re-quires manually transcribed data in order to compute the word error rate (WER), which is often time-consuming and expen-sive. In this paper, we propose a novel approach to estimate WER, or e-WER, which does not require a gold-standard transcription of the test set. Our e-WER framework uses a comprehensive set of features: ASR recognised text, character recognition results to complement recog-nition output, and internal decoder tures. We report results for the two fea-tures; black-box and glass-box using un-seen 24 Arabic broadcast programs. Our system achieves 16.9% WER root mean squared error (RMSE) across 1,400 sen-tences. The estimated overall WER e-WER was 25.3% for the three hours test set, while the actual WER was 28.5%.
1 Introduction
Automatic Speech Recognition (ASR) has made rapid progress in recent years, primarily due to advances in deep learning and powerful comput-ing platforms. As a result, the quality of ASR has improved dramatically, leading to various appli-cations, such as speech-to-speech translation, per-sonal assistants, and broadcast media monitoring. Despite this progress, ASR performance is still closely tied to how well the acoustic model (AM) and language model (LM) training data matches the test conditions. Thus, it is important to be able to estimate the accuracy of an ASR system in a particular target environment.
Word Error Rate (WER) is the standard ap-proach to evaluate the performance of a large
vo-cabulary continuous speech recognition (LVCSR) system. The word sequence hypothesised by the ASR system is aligned with a reference transcrip-tion, and the number of errors is computed as the sum of substitutions (S), insertions (I), and dele-tions (D). If there areN total words in the refer-ence transcription, then the word error rate WER is computed as follows:
WER= I +D+S
N ×100. (1)
To obtain a reliable estimate of the WER, at least two hours of test data are required for a typical LVCSR system. In order to perform the alignment, the test data needs to be manually tran-scribed at the word level – a time-consuming and expensive process. It is, thus, of interest to de-velop techniques which can estimate the quality of an automatically generated transcription with-out requiring a gold-standard reference.
Such quality estimation techniques have been extensively investigated for machine translation (Specia et al., 2013), with extensions to spoken language translation (Ng et al.,2015,2016). Al-though there is a long history of exploring word-level confidence measures for speech recognition (Evermann and Woodland, 2000; Cox and Das-mahapatra,2002;Jiang,2005;Seigel et al.,2011;
Huang et al., 2013), there has been less work on the direct estimation of speech recognition errors.
Mix-ture Model (GMM) acoustic models in order to identify ASR errors, based on the assumption that when two ASR systems disagree on an utterance region, then it is most likely an error.
Ogawa and Hori (2015) investigated using deep bidirectional recurrent neural networks (DBRNNs) to detect errors in ASR results. They explored four tasks for ASR error detection and recognition rate estimation: confidence estima-tion, out-of-vocabulary (OOV) word detecestima-tion, er-ror type classification, and recognition rate esti-mation. In an extension to this work,Ogawa et al.
(2016); Ogawa and Hori (2017) investigated the estimation of speech recognition accuracy based on the classification of error types, in which se-quence classification was performed by a CRF. Each word in a hypothesised word sequence was classified into one of three categories: correct, substitution error, or insertion error. Their study did not estimate the presence of deletions, and consequently cannot estimate the WER.
Jalalvand et al.(2016) developed a tool for ASR quality estimation, TranscRater, which is capable of predicting WER per utterance. This approach is based on a large set of extracted features (which do not require internal access to the ASR sys-tem) used to train a regression model (e.g., ex-tremely randomised trees), and can also rank dif-ferent transcriptions from multiple sources (Negri et al., 2014;de Souza et al.,2015;Jalalvand and Falavigna,2015;Jalalvand et al.,2015a,b). Tran-scRater provides a WER per utterance, reporting the results as the MAE with respect to a refer-ence transcription. This work did not report WER estimates for complete recordings or test sets, al-though it is possible that this could be done using utterance length estimates.
In this paper, we build on these contributions to develop a system to directly estimate the WER of an ASR output hypothesis. Our contributions are: (i) a novel approach to estimate WER per sentence and to aggregate them to provide WER estimation per recording or for a whole test set; (ii) an eval-uation of our approach which compares the use of “black-box” features (without ASR decoder infor-mation) and “glass-box” features which use inter-nal information from the decoder; and (iii) a re-lease of the code and the data used for this paper for further research1.
1https://github.com/qcri/e-wer
2 e-WER Framework
Estimating the probability of error of each word in a recognised word sequence has been success-fully used to detect insertions, substitutions, and interword deletions (Ogawa et al., 2016; Ogawa and Hori, 2015;Ghannay et al., 2015; Jalalvand and Falavigna,2015;Seigel and Woodland,2014). However, these local estimates do not provide an estimate of the overall pattern of error, such as the total number of deletions in an utterance.
In our framework, we use two speech recogni-tion systems; a word-based LVCSR system and a grapheme-sequence based system. Following
Tam et al.(2014), we assume that when two cor-responding ASR systems disagree on a sentence or part of a sentence, there is a pattern of error to be learned. Our architecture also benefits from utterance-based LVCSR decoder features includ-ing the total number of frames, the average log likelihood and the duration. Intuitively, we corre-late short sentences with less context and assume that LM scoring will not be able to capture long context. Therefore, e-WER is defined as follows:
e-WER= ERR
ˆ
N ×100% (2)
Our model is required to predict two values for each utterance: ERR and Nˆ. Given that each is integer-valued, we decided to frame their estima-tion as a classificaestima-tion task rather than a regression problem as shown in equations3and4. Each class represents a specific word count. We limit the to-tal number of classes to a maximum ofCin ERR, with range from 0 toC. However, the total num-ber of classes forNˆ isC−Kto avoid estimating an utterance length of zero, with a range fromK toC. If an utterance has more than C words or less thanKwords, it will thus be penalised by the loss function,
ERR= arg max
cj∈C
P(cj|x1, x2, ..., xn) (3)
ˆ
N = arg max
kj∈C−K
P(kj|x1, x2, ..., xn) (4)
values across the entire test set in order to estimate the overall WER, as shown in section3.
2.1 e-WER features
To estimate e-WER, we combine features from the word-based LVCSR system with features from the grapheme-based system. By running both word-based and character-word-based ASR systems, we are able to align their outputs against each other. We split the studied features into four groups
• L: lexical features – the word sequence ex-tracted from the LVCSR.
• G: grapheme features – character sequence extracted from the grapheme recognition. • N: numerical features – basic features about
the speech signal, as well as grapheme align-ment error details.
• D: decoder features – total frame count, aver-age log-likelihood, total acoustic model like-lihood and total language model likelike-lihood. Similar to previous research in ASR quality esti-mation, we refer to{L,G,N}as the black-box fea-tures, and {L,G,N,D} as the glass-box features, which are used to estimate the total number of wordsNˆ, and the total number of errors ERR in a given sentence.
2.2 Classification Back-end
We deployed a feed-forward neural network as a backend classifier for e-WER. The deployed net-work in this net-work has two fully-connected hidden layers (ReLU activation function), with 128 neu-rons in the first layer and 64 neuneu-rons in the second layer followed by a softmax layer. A minibatch size of 32 was used, and the number of epochs was up to 50 with an early stopping criterion.
2.3 Data
The e-WER training and development data sets are the same as the Arabic MGB-2 development and evaluation sets (Ali et al.,2016;Khurana and Ali,
2016), which is comprised of audio extracted from Al-Jazeera Arabic TV programs recorded in the last months of 2015. To test whether our approach generalises to test sets from a different source, and not tuned to the MGB-2 data set, we validated our results on three hours test set collected by BBC Monitoring during November 2016, as part of the SUMMA project2.
2http://summa-project.eu
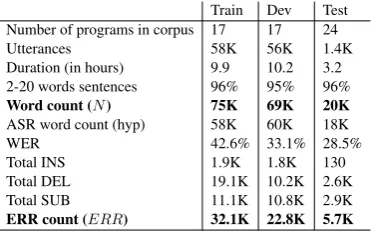
Train Dev Test Number of programs in corpus 17 17 24 Utterances 58K 56K 1.4K Duration (in hours) 9.9 10.2 3.2 2-20 words sentences 96% 95% 96% Word count (N) 75K 69K 20K ASR word count (hyp) 58K 60K 18K
WER 42.6% 33.1% 28.5%
[image:3.595.317.505.62.178.2]Total INS 1.9K 1.8K 130 Total DEL 19.1K 10.2K 2.6K Total SUB 11.1K 10.8K 2.9K ERR count (ERR) 32.1K 22.8K 5.7K
Table 1: Analysis of the train, dev and test data.
[image:3.595.319.506.211.252.2]MAE/Dev MAE/Test ERR Nˆ e-WER ERR Nˆ e-WER glass-box 1.6 1.8 13.8 1.7 1.7 12.3 black-box 1.8 2.2 28.4 1.9 2.3 24.7
Table 2: MAE per sentence reported for the glass-box and black-glass-box features.
3 Experiments and discussions
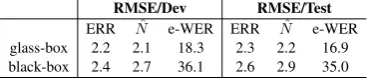
We trained two DNN systems to estimateNˆ and ERR separately. We explored training both a black-box based DNN system (without the de-coder features) and a glass-box system using the decoder features. Overall, four systems were trained: two glass-box systems and two black-box systems. We used the same hyper-parameters across the four systems. Tables2and3present the e-WER performance in terms of the mean absolute error (MAE) and root mean squared error (RMSE) per sentence for ERR,Nˆ and the estimated WER for the dev and test sets with reference to the errors computed using a gold-standard reference. As ex-pected, the glass-box features help to reduce MAE and RMSE for both ERR andNˆ. Although the dif-ference between the black-box estimation and the glass-box results is not big for ERR andN, we can see that the impact becomes substantial on the esti-mated WER per sentence, which is almost double the error in both MAE and RMSE per sentence.
Table 4reports the overall performance on the dev and on the test set. Across the 17 programs in the MGB-2 dev data, the actual WER is 33.1%, and the glass-box e-WER is 29.3%, while the black-box e-WER is 30.9%. Evaluating the same models on the 24 programs in the test data set re-sults in an actual WER of 28.5%, while the glass-box e-WER is 25.3%, and the black-glass-box e-WER is 30.3%.
RMSE/Dev RMSE/Test ERR Nˆ e-WER ERR Nˆ e-WER glass-box 2.2 2.1 18.3 2.3 2.2 16.9 black-box 2.4 2.7 36.1 2.6 2.9 35.0
Table 3: RMSE per sentence reported for the glass-box and the black-box features.
Actual/estimated WER
Data Reference glass-box black-box
Dev 33.1% 29.3% 30.9%
[image:4.595.85.271.63.102.2]Test 28.5% 25.3% 30.3%
Table 4: Overall WER across the dev and the test data set.
of the estimated WER per sentence in the glass-box is substantially better than the black-glass-box for both development and test sets. Table4indicates that the glass-box estimate is systematically lower than the black-box estimate. To further visualise these results, figure 1 plots the cumulative WER and e-WER across the three hours test set. This plot indicates that the glass-box estimate is con-tinually lower than the black-box estimate. The large difference during the first 30 minutes arises owing the glass-box system is capable of better es-timation with less data compared to the black-box system.
We estimate Nˆ and ERR separately. There-fore, our system is capable of estimating the WER at different levels of granularity. We visualise the prediction per program. In scenarios such as media-monitoring, where the main objective is to have a robust monitoring system for specific pro-grams, we plot the WER across the 24 programs in the test set, and we can see in figure 2 that both the glass-box and black-box estimation are following the gold-standard WER per program. However, unlike predicting word countNˆ or error count ERR, we can see that the black-box, in gen-eral, over-estimates the WER, while the glass-box system under-estimates WER similar to figure1. One can argue from figure2that the decoder fea-tures are not helping in programs with high WER. We found both systems to be useful for reporting WER per program.
4 Conclusions
This paper presents our efforts in predicting speech recognition word error rate without requir-ing a gold-standard reference transcription. We presented a DNN based classifier to predict the total number of errors per utterance and the
to-0.0 0.5 1.0 1.5 2.0 2.5 3.0
0 5 10 15 20 25 30 35
reference glass-box black-box
Figure 1: Test set cumulative WER over all sen-tences (X-axis is duration in hours and Y-axis is WER in %).
0 5 10 15 20 25
10 20 30 40 50 60 70 80
90 reference
[image:4.595.307.522.66.213.2]glass-box black-box
Figure 2: WER estimated over 24 programs on the test data.
[image:4.595.101.261.147.194.2] [image:4.595.310.526.305.451.2]References
Ahmed Ali, Peter Bell, James Glass, Yacine Messaoui, Hamdy Mubarak, Steve Renals, and Yifan Zhang. 2016. The MGB-2 challenge: Arabic multi-dialect
broadcast media recognition. InProc IEEE SLT.
Stephen Cox and Srinandan Dasmahapatra. 2002. High-level approaches to confidence estimation in
speech recognition. IEEE Transactions on Speech
and Audio processing10(7):460–471.
Jos´e GC de Souza, Hamed Zamani, Matteo Negri, Marco Turchi, and Daniele Falavigna. 2015. Mul-titask learning for adaptive quality estimation of
au-tomatically transcribed utterances. InHLT-NAACL.
pages 714–724.
Gunnar Evermann and PC Woodland. 2000.
Poste-rior probability decoding, confidence estimation and
system combination. InProc. Speech Transcription
Workshop. Baltimore, volume 27, page 78.
Sahar Ghannay, Yannick Esteve, and Nathalie Camelin.
2015. Word embeddings combination and
neu-ral networks for robustness in asr error detection. InSignal Processing Conference (EUSIPCO), 2015 23rd European. IEEE, pages 1671–1675.
Po-Sen Huang, Kshitiz Kumar, Chaojun Liu, Yifan Gong, and Li Deng. 2013. Predicting speech recog-nition confidence using deep learning with word
identity and score features. In Acoustics, Speech
and Signal Processing (ICASSP), 2013 IEEE Inter-national Conference on. IEEE, pages 7413–7417.
Shahab Jalalvand and Daniele Falavigna. 2015. Stacked auto-encoder for ASR error detection and word error rate prediction. InInterspeech.
Shahab Jalalvand, Daniele Falavigna, Marco Matas-soni, Piergiorgio Svaizer, and Maurizio Omologo.
2015a. Boosted acoustic model learning and
hy-potheses rescoring on the chime-3 task. In
Au-tomatic Speech Recognition and Understanding (ASRU), 2015 IEEE Workshop on. IEEE, pages 409– 415.
Shahab Jalalvand, Matteo Negri, Falavigna Daniele,
and Marco Turchi. 2015b. Driving rover with
segment-based asr quality estimation. In
Proceed-ings of the 53rd Annual Meeting of the Association for Computational Linguistics and the 7th Interna-tional Joint Conference on Natural Language Pro-cessing (Volume 1: Long Papers). volume 1, pages 1095–1105.
Shahab Jalalvand, Matteo Negri, Marco Turchi,
Jos´e GC de Souza, Daniele Falavigna, and
Mo-hammed RH Qwaider. 2016. Transcrater: a tool
for automatic speech recognition quality estimation.
ACL 2016page 43.
Hui Jiang. 2005. Confidence measures for speech
recognition: A survey. Speech Communication
45(4):455–470.
Sameer Khurana and Ahmed Ali. 2016. QCRI
ad-vanced transcription system (QATS) for the Arabic Multi-Dialect Broadcast Media Recognition: MGB-2 Challenge. InSLT.
Matteo Negri, Marco Turchi, Jos´e GC de Souza, and
Daniele Falavigna. 2014. Quality estimation for
automatic speech recognition. In COLING. pages
1813–1823.
Raymond WM Ng, Kashif Shah, Lucia Specia, and Thomas Hain. 2015. A study on the stability and ef-fectiveness of features in quality estimation for
spo-ken language translation. InSixteenth Annual
Con-ference of the International Speech Communication Association.
Raymond WM Ng, Kashif Shah, Lucia Specia, and
Thomas Hain. 2016. Groupwise learning for asr
k-best list reranking in spoken language
transla-tion. In Acoustics, Speech and Signal Processing
(ICASSP), 2016 IEEE International Conference on. IEEE, pages 6120–6124.
Atsunori Ogawa and Takaaki Hori. 2015. Asr error de-tection and recognition rate estimation using deep bidirectional recurrent neural networks. InICASSP.
Atsunori Ogawa and Takaaki Hori. 2017. Error de-tection and accuracy estimation in automatic speech recognition using deep bidirectional recurrent neural
networks. Speech Communication89:70–83.
Atsunori Ogawa, Takaaki Hori, and Atsushi Nakamura. 2016. Estimating speech recognition accuracy based
on error type classification. IEEE/ACM
Transac-tions on Audio, Speech, and Language Processing
24(12):2400–2413.
Matthew Stephen Seigel and Philip C Woodland. 2014. Detecting deletions in asr output. InICASSP. IEEE, pages 2302–2306.
Matthew Stephen Seigel, Philip C Woodland, et al.
2011. Combining information sources for
confi-dence estimation with crf models. In Interspeech.
pages 905–908.
Lucia Specia, Kashif Shah, Jose G.C. de Souza, and Trevor Cohn. 2013. QuEst – a translation quality
estimation framework. InACL: System
Demonstra-tions. pages 79–84.
Yik-Cheung Tam, Yun Lei, Jing Zheng, and Wen
Wang. 2014. Asr error detection using recurrent
neural network language model and complementary