An improved radiation model and its
applicability for understanding
commuting patterns in Hungary
Varga, Levente and Tóth, Géza and Néda, Zoltán
Department of Physics, Babes
,-Bolyai University, Cluj-Napoca,
Romania, Hungarian Central Statistical Office, Budapest, Hungary
February 2017
Online at
https://mpra.ub.uni-muenchen.de/76806/
An improved radiation model and its applicability for
understanding commuting patterns in Hungary
Levente Varga
Department of Physics, Babeș-Bolyai University, Cluj-Napoca, Romania E-mail: [email protected]
Géza Tóth
Hungarian Central Statistical Office, Budapest, Hungary E-mail: [email protected]
Zoltán Néda
Department of Physics, Babeș-Bolyai University, Cluj-Napoca, Romania E-mail: [email protected]
Keywords:
human mobility models, commuters data, population income, and density
Several empirical models aimed at describing human mobility have been proposed in the past. Most of them are based on an unjustified analogy, with a focus on gravity and physical vector or scalar fields. Recently, however, statistical physicists introduced a new category of models that are theoretically motivated by a few simple and reasonable socio-economic assumptions. The Radiation Model (Simini et al. 2012) and the Radiation Model with Selection
(Simini–Maritan–Néda 2013) are such successful approaches. Here, we introduce a new version of the radiation model, the Travel Cost Optimized Radiation
Model, and test its applicability for describing the
commuting patterns in Hungary. We compare critically the performance of this model with the results of the previous radiation type models.
Introduction
community has shown an interest in the impact of human mobility patterns on the economy, exploiting the fact that many models and modelling methods that are well known to physicists can be used for understanding the spatiotemporal universalities observed in human mobility (Brockmann–Hufnagel–Geisel 2006, González– Hidalgo–Barabási 2008).
The continuous growth of big cities (Bettencourt–West 2010), spatial concentration of industries around them, and rapid development of quick and affordable travelling mediums make commuting an increasingly important social phenomena, affecting a large portion of the population (Cohen et al. 2008). An understanding of the statistical laws governing the commuting flux serves both practical and scientific purposes. Uncovering some universally observable features will facilitate better planning for new travel routes, traffic optimisation, and prevention of failures in mobility fluxes. From the viewpoint of fundamental research, a successful modelling paradigm will reveal important psychological and socio-economic factors governing the job and housing selection of individuals.
Physics motivated the most popular models that attempted to fit the distribution of the mobility fluxes between the settlements. In this context, one can refer to the gravity model (for a review, please consult Barthélemy 2010) that along with Newton’s law of gravitation exploits a phenomenological analogy. According to the assumption of the gravity models, the commuter fluxes between two settlements are proportional to their populations and inversely proportional with the square of the commuting distance. Generalized versions of the model propose power-law dependencies with freely defined fitting exponents for the population of the host and target cities and the distance between them. The generalized potential model is also an attempt to use the classical methodology of physics for understanding commuting fluxes (Anderson 1956, Lukermann–Porter 1960). Other well-known models that are not necessarily motivated by physics are the intervening opportunities model (Stouffer 1940) and the random utility model (Block–Marschak 1960). The radiation model, which was recently proposed by Simini et al., is built on a new paradigm and it starts by using a sociological driving force for the individuals—an optimization to improve their current income (Simini et al. 2012). The initial model, which in principle is a one-parameter model, was formulated for a discrete settlement structure. It was later generalized (Simini et al. 2013) for a continuous population distribution and made more complex by allowing a realistic job selection for the individuals. The new version of the model, the radiation model with selection, is a two-parameter model that offered an improved fit for the commuting data in the USA.
The model
The original radiation model (RM) starts from the assumption that commuting fluxes reflect, in some manner, optimisation reasoning in the jobseekers’ choice for employment. The main hypothesis is that a jobseeker will accept the closest job offer that has a better salary than the one that it is currently available in his/her location. Owing to this requirement each individual travels to the nearest location where she/he can improve her/his current benefits. Let us assume that the cumulative distribution function of the incomes (benefits) is given by p(z) (the probability that the income of one person is smaller or equal thanz). Mathematically written, the main assumption of the original radiation model is that the probability P(z|a) that an
individual with benefit z refuses the closest a number of job offers is:
a
z p a z
P( ) ( ) , (1)
In writing this probability, we assumed that the rejection of the a number of closest job offers with benefits less or equal to z are independent events. This is true in case there are in total more number of job offers than the number a.
Using the incomes probability density function,
z z p z p ( ) )
( we can now
calculate the P>(a) probability of not accepting the closest a number of job offers by
integrating over the benefits:
1 a 1 z dp z p dz z z p a z P dz z p a z P a P a 1 0 0 0
) ( ) ( ) ( ) ( ) ( ) ( ) ( (2)If we assume now that the jobseekers are selective in their choices and they are willing to accept better offers only with a probability 1–λ, we get (Simini et al. 2013):
1 1 1 p z
a 1 p z
aa z
P( ) –( – ) – ( ) ( – ) ( ) (3)
Alternatively, the assumption behind this generalization can be interpreted as a fact that the jobseekers are aware only of a fraction 1–λ of the available job offers. In such conditions, we obtain:
) – )( ( – ) ( ) ( ) – ( ) ( ) ( ) – ( ) (
1 1 a 1 z dp z p 1 dz z p z p 1 a P 1 a 1 0 a 0 a (4)showed that this model describes the distribution of the commuting fluxes for the USA better than the simple radiation model.
Subsequently, we introduced another extension for the original radiation model, which we named as the travel cost optimized radiation model (TCORM). The radiation model assumes that commuters will accept jobs that offer gains, relative to their present income, independently, on the distance between their residence and workplace. It presents a very weak condition for commuting, and our proposal is that individuals must choose to commute if there is a net gain in their salaries after subtracting the travel costs. However, travel costs depend on the distance travelled. Therefore, in principle, the radiation model has to be modified so that, in addition to the transited job offers (a), the travel distance (r) is considered as an important factor. In this view, the working paradigm of the radiation model is reconciled with basic assumptions in the radiation and potential models. According to this assumption and
following the reasoning of the radiation model, we can modify the starting hypothesis (1) as:
q 1
0 a
q a
1
a p z r p z r
z p a z
P( ) ( ) ( ) ... ( ) (5)
So that
q
1 j
j a
a (6)
In the above hypothesis, α is the parameter that governs the distance-dependent travel costs. We denoted the job openings inside settlement j by aj and distance
between originating point to the destination point inside the settlement by rj.
According to this, in order to proceed we had to make some assumptions about the nature of the p(z) cumulative income distribution. Definitely, p(z) has to be
a monotonically increasing function, with the condition p(0) 0 and p()1.
Empirical data on an estimated income distribution for Hungary shows that a kernel of the form p z 1 e z
( ) – – gives a reasonable approximation (see Figure 1 where
we have plotted 1– p(z) on lognormal scale, suggesting a linear dependence). This form also satisfies the above-imposed conditions. Working with such kernel, one can write:
i i
i z r a
a
i 1 e
r z
p ( ) ( – –( ))
(7)
We assumed that the cost of travel is small in comparison to the salary, and hence
z ri
. It also means that 1. In such case, we can make a Taylor expansion around the value of z:
z z i i a
z a
r z
e 1
e a r 1 e 1 e
1 i i i
– – –
) ( –
– –
According to this, keeping only up to first order terms in α, we obtained:
zz a z q 1 j j j z z a z e 1 e a r a 1 e 1 r a e 1 e 1 e 1 a z P – – – – – – – ) ( – – – ) ( (9)
Where, r(a) denotes the average distance of the a number of job openings from the centre.
Based on the above derivation, we expressed the P(a,r) probability as:
1 0 a 1 0 a dx x 1 1 a r a 1 x z dp z p 1 1 a r a 1 z p a P – ) ( – ) ( ) ( – ) ( – ) ( ) ((10)
Performing the integral, we obtained:
) ( ) ( ) ( 1 a a r 1 a P (11)
As it was considered in previous work (Simini et al. 2012), we also assumed that job offers in a territory is linearly proportional with the population, i.e. a=μw, where
w is the population and μ is a proportionality constant. According to this, we obtain again a two-parameter model, yielding the following with :
) ( ) ( ) ( 1 w w r 1 w P
(12)
Thus, this gives another two-parameter model extension to the original radiation model.
In case of assuming a uniform distribution of the population in the considered territory, we obtained the following:
w w
r( ) (13)
which yielded the following:
) ( ) ( 1 w w 1 w P
(14)
Figure 1 Estimated cumulative distribution of incomes in Hungary in the year 2014
(please note the logarithmic vertical axes) The linear trend suggests an exponential decay
Source: HCSO.
Data analyses
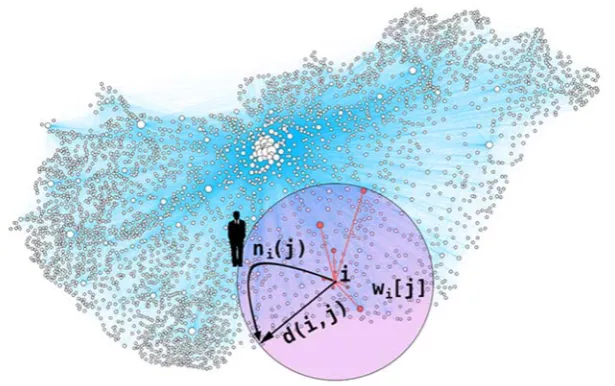
As a basis for our experimental investigation, we processed a complete commuter and population database from Hungary. We analysed the 2011 population census data using Q=3.176 settlements (nodes) (see white filled circles in Figure 2) and 81.664
commuter routes (edges) (see cyan lines between white filled circles in Figure 2) on the territory of Hungary. In our calculation, we also used data with a square kilometre resolution for population distribution in the census year 2011. The total population of Hungary, according to the 2011 census year, is W=9.972.000.
During our data processing, we select one by one the settlements
i
from wherecommuting starts and construct the boundaries of the disks with radius d(i, j), reaching up to those settlements j, where the commuting is done (see Figure 2). We counted the population wi[j] inside the specified disk with radius d(i, j) and recorded the
number of commuters ni(j) starting from settlement i and traveling to settlement j.
1
z (units in 10,000 HUF) 50 40
30 20
10 0
1–p<(z)
Figure 2 Settlements in the commuting network of Hungary. Here, we illustrate the data
processing method. Disks of different radius d(i, j), starting from a given settlement and reaching the other j settlements, are constructed. The population wi[j] inside these disks and the commuter number, starting
from settlement i and traveling to settlement j, ni(j), is recorded.
Source: Edited by the authors.
With d(i, j), ni(j), and wi[j]data for all the settlement pairs (i, j), where ni(j) 0, we
proceeded to the construction of the P>(w) probabilities. The number of workers that have their residence in settlement i are denoted by Ni. We have expressed this as
follows:
) (j n N
Q
1 j
i i
(15)
We denoted the total population in the considered territory as W.
We ordered the settlements according to their distance relative to i. Let [k]
i
h be
the index of the settlement that is the kth one in this row (for example, [1]
i
h is the index of the settlement that is the closest to settlement i and [2]
i
h is the index of the settlement that is the second closest to i). Here, we introduced the s(i, w) integer number in the following manner:
} ,..., , , { ) ,
(i w 123 Q
s (16)
which is defined in the following manner for wW :
[(, )–]
[s(i,w)]
i i 1
w i s i
i h w w h
(We record that Q denotes the total number of settlements and W the total population in the studied territory.) If no such number exists, then we will consider
s(i, w)=Q.
In layman terms, s(i, w) denotes the smallest number of settlements that have to be considered so that the total population is larger (or equal) than W inside the disk that contains these settlements (centred to i).
The probability that the commuters from i are a transitioning population W can be written as:
[ ] ) , ( – ) ( k i w i s 1 k i i ii N n h
N 1 w
P (18)
The ri(w) curve can also be constructed as:
)] , ( [ ) , ( ) , ( – ) ( ) , ( ] – [ ] [ ] – [ ] [ w i s w h i d h i d 2 1 h w h w w r i w i s 1 k 1 k i k i 1 k i i k i i i
(19)
After obtaining the quantities for all settlements, we constructed the desired curves as follows:
) ( )
( P w
Q 1 w P Q 1 i i
(20)
Q 1 i i w r Q 1 wr( ) ( ) (21)
After constructing a data analyses algorithm based on the above calculations, we proceeded to construct experimentally the P>(w) and r(w) curves.
Results and discussions
The values for P>(w) computed from the census data are compared with the best fits
obtained with the original radiation model (RM), the Radiation model with selection (RMwS), and the travel cost optimized radiation model (TCORM). The boundary effects become important for large w values (the disks centred on the settlements are incomplete due to the fact that they extend over the borders of Hungary). In addition, to minimise these effects we considered the data only up to w=1.000.000. This cut does not affect the commuters originating from Budapest, since the capital is not considered as a single settlement in this study, but is divided into sectors.
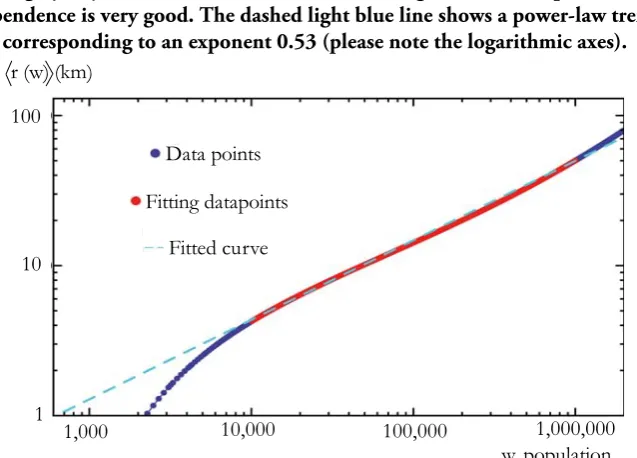
In order to use the TCORM model, we first had to investigate experimentally the )
(w
that the approximation (13) works well for distances that are larger than 3 km and smaller than 100 km (which is a relevant distance scale in commuting). If one would like to get an even better theoretical verification for formula (12), then the numerically computed r(w) could be used instead of (13).
[image:10.595.140.459.285.514.2]Figure 3 The mean distance of a population w, in a disk-like geometry, relative to the centre of the disk (the mathematically defined r(w) as a function of w). The
blue line is calculated using formulae (19) and (21) from census data for Hungary in year 2011. The red line shows the region where the power-law dependence is very good. The dashed light blue line shows a power-law trend
corresponding to an exponent 0.53 (please note the logarithmic axes).
Source: Edited by the authors.
In order to verify the applicability of different variants of the radiation model we first compute the P>(w) experimental curve from the 2011 census data by following
the steps specified in (18) and (20). We compare than visually the best fits to this line by using the:
RM prediction:
1 w
1 w
PRM
( ) (22) (one parameter fit)
RMwS prediction:
) – )( (
– )
(
1 1 w 1 w
P
1 w
RMwS (23) (a two parameter fit)
TCORM prediction:
) ( ) (
1 w
w 1 w PTCORM
(24) (a two parameter fit)
r (w) (km)
100
1 10
w, population 1,000,000 100,000
10,000 1,000
Data points
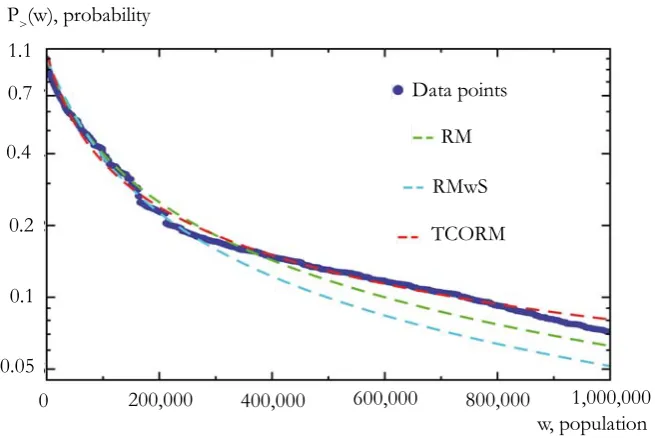
The best fit to the experimental curve is done numerically and here we rely only on a visual comparison. The results are plotted on Figure 4. In Figure 4, we use a lognormal scale in order to visualize better the differences at small values.
Figure 4 Comparison of radiation type models prediction with experimental data for
Hungary. The thick blue line P>(w) is calculated for commuters’ data in Hungary using the 2011 census data and following the algorithm summarized
by equations (18) and (20). These results are visually compared with the best fits obtained for the RM model (eq. 22), RMwS model (eq. 23) and TCORM
model (eq. 24). Please note the logarithmic vertical axes.
Source: Calculated by the authors.
The best fits parameters obtained are as follows: μ=0.000015 for RM (eq. 22), μ=0.000028 and λ=0.33 for RMwS (eq. 23), and μ=0.00003 and λ=0.0015 for TCORM (eq. 24).
A visual examination also clearly indicates that the TCORM model performs better than the simple RM and RMwS model. The TCORM model has the capability of offering a visually good fit for the whole interval, while the simple RM model and RMwS are only capable of describing a portion of the w[1,1.000.000] interval. It is apparent that a that a two-parameter fit is more successful than a one-parameter fit. Accordingly, it is also natural that TCORM would perform better than the simple RM. It is important to note that the TCORM seems to be a much better approximation than RMwS for describing commuter data for Hungary, although both the models are two-parameter regressions. However, future commuter data for other
1.1
P>(w), probability
0.05 0.1 0.4
0.2 0.7
w, population 1,000,000 800,000
600,000 400,000
200,000 0
Data points
RM
RMwS
geographical regions must also be checked in order to affirm that TCORM is a better approximation for commuter fluxes than RMwS.
Conclusion
We studied the distribution of commuter fluxes between the settlements of Hungary using the census data from 2011. In order to explain the observed data, we derived a novel extension for the classical radiation model (RM). In our travel cost optimized radiation model (TCORM), we take into account the travel cost for commuting in the benefit optimisation. Realistically, where the travel cost is much smaller than the benefits, we obtained an analytical solution and a compact formula for the commuter fluxes. The complexity of this description is comparable with the complexity of the radiation model with selection (RMwS), wherein both the approaches focus on fitting a two-parameter model to experimental data. We find that our novel TCORM model performs better than the RMwS model in describing the commuting data for Hungary. This observation has to be thoroughly examined in the future for other geographical regions as well.
Acknowledgement
Work supported by the Romanian UEFISCDI grant PN-II-ID-PCE-2011-3-0348. The research of Z.N. was supported by the European Union and the State of Hungary, co-financed by the European Social Fund in the framework of TAMOP 4.2.4.A/2-11-1-2012-0001 ‘National Excellence Program’.
REFERENCES
ANDERSON,T.R. (1956): Potential models and the spatial distribution of population Papers in
Regional Science 2 (1): 175–182.
BARTHÉLEMY,M. (2010): Spatial networks Physics Reports 499: 1–101.
BAZZANI,A.–GIORGINI,B.–RAMBALDI,S.–GALLOTTI,R.–GIOVANNINI,L. (2010): Statistical laws in urban mobility from microscopic GPS data in the area of Florence Journal
of Statistical Mechanics: Theory and Experiment 2010: P05001.
BETTENCOURT,L.–WEST,G. (2010): A unified theory of urban living Nature 467: 912–913. BLOCK,H.–MARSCHAK,J. (1960): Random orderings and stochastic theories of responses
Contributions to probability and statistics 2: 97–132.
BROCKMANN,D.–HUFNAGEL,L.–GEISEL,T. (2006): The scaling laws of human travel Nature 439: 462–465.
COHEN, J. E.–ROIG, M.–REUMAN, D.C.–GOGWILT, C. (2008): International migration beyond gravity: A statistical model for use in population projections Proceedings of
the National Academy of Sciences 105 (40): 15269–15274.
LUKERMANN,F.–PORTER,P.W. (1960): Gravity and potential models in economic geography
Annals of the Association of American Geographers 50 (4): 493–504.
RITCHEY,P.N. (1976): Explanations of migration Annual Review of Sociology 2: 363–404. SIMINI,F.–GONZÁLEZ,M.C.–MARITAN,A.–BARABÁSI,A.L. (2012): A universal model for
mobility and migration patterns Nature 484: 96.
SIMINI,F.–MARITAN,A.–NÉDA,Z. (2013): Human Mobility in a Continuum Approach. PLoS
ONE 8(3): e60069.
STOUFFER,S.A. (1940): Intervening opportunities: a theory relating mobility and distance
American Sociological Review 5 (6): 845–867.