Multi-Engine Machine Translation with Voted Language Model
Tadashi Nomoto
National Institute of Japanese Literature 1-16-10 Yutaka Shinagawa
Tokyo 142-8585 Japan [email protected]
Abstract
The paper describes a particular approach to multi-engine machine translation (MEMT), where we make use of voted language models to selectively combine translation outputs from multiple off-the-shelf MT systems. Experiments are done using large corpora from three distinct domains. The study found that the use of voted language models leads to an improved performance of MEMT sys-tems.
1 Introduction
As the Internet grows, an increasing number of commercial MT systems are getting on line ready to serve anyone anywhere on the earth. An inter-esting question we might ponder is whether it is not possible to aggregate the vast number of MT sys-tems available on the Internet into one super MT which surpasses in performance any of those MTs that comprise the system. And this is what we will be concerned with in the paper, with somewhat watered-down settings.
People in the speech community pursued the idea of combining off-the-shelf ASRs (automatic speech recognizers) into a super ASR for some time, and found that the idea works (Fiscus, 1997; Schwenk and Gauvain, 2000; Utsuro et al., 2003). In IR (in-formation retrieval), we find some efforts going (un-der the name of distributed IR or meta-search) to se-lectively fuse outputs from multiple search engines on the Internet (Callan et al., 2003). So it would be curious to see whether we could do the same with MTs.
Now back in machine translation, we do find some work addressing such concern: Frederking and Nirenburg (1994) develop a multi-engine MT or MEMT architecture which operates by com-bining outputs from three different engines based on the knowledge it has about inner workings of
each of the component engines. Brown and Fred-erking (1995) is a continuation of FredFred-erking and Nirenburg (1994) with an addition of a ngram-based mechanism for a candidate selection. Nomoto (2003), however, explores a different line of re-search whose goal is to combine black box MTs us-ing statistical confidence models. Similar efforts are also found in Akiba et al. (2002).
The present paper builds on the prior work by Nomoto (2003). We start by reviewing his ap-proach, and go on to demonstrate that it could be im-proved by capitalizing on dependence of the MEMT model there on language model. Throughout the paper, we refer to commercial black box MT sys-tems as OTS (off-the-shelf) syssys-tems, or more sim-ply, OTSs.
2 Confidence Models
We take it here that the business of MEMT is about choosing among translation outputs from multiple MT systems, whether black box or not, for each in-put text. Therefore the question we want to address is, how do we go about choosing among MT outputs so that we end up with a best one?
What we propose to do is to use some confidence models for translations generated by OTSs, and let them decide which one we should pick. We essen-tially work along the lines of Nomoto (2003). We review below some of the models proposed there, together with some motivation behind them.
Confidence models he proposes come in two va-rieties: Fluency based model (FLM) and Alignment based model (ALM), which is actually an extension of FLM. Now suppose we have an English sentence
deter-mined by:
F LM(e, j) = logPl(j) (1)
Pl(j) is the probability ofj under a particular lan-guage model (LM) l.1 What FLM says is that the quality of a translation essentially depends on its log likelihood (or fluency) and has nothing to do with what it is a translation of.
ALM extends FLM to include some information on fidelity. That is, it pays some attention to how faithful a translation is to its source text. ALM does this by using alignment models from the statistical machine translation literature (Brown et al., 1993). Here is what ALM looks like.
ALM(e, j) = logPl(j)Q(e|j)
Q(e | j) is the probability estimated using IBM Model 1. ALM takes into account the fluency of a translation output (given byPl(j)) and the degree of association betweeneandj(given byQ(e|j)), which are in fact two features generally agreed in the MT literature to be most relevant for assessing the quality of translations (White, 2001).
One problem with FLM and ALM is that they fail to take into account the reliability of an OTS sys-tem. As Nomoto (2003) argues, it is reasonable to believe that some MT systems could inherently be more prone to error and outputs they produce tend to be of less quality than those from other systems, no matter what the outputs’ fluency or translation probability may be. ALM and FLM work solely on statistical information that can be gathered from source and target sentences, dismissing any opera-tional bias that an OTS might have on a particular task.
Nomoto (2003) responds to the problem by intro-ducing a particular regression model known as Sup-port Vector regression (SVR), which enables him to exploit bias in performance of OTSs. What SVR is intended to do is to modify confidence scores FLM and ALM produce for MT outputs in such a way that they may more accurately reflect their in-dependent evaluation involving human translations or judgments. SVR is a multi-dimensional regres-sor, and works pretty much like its enormously pop-ular counterpart, Support Vector classification, ex-cept that we are going to work with real numbers for target values and construct the margin, using Vap-nik’s ²-insensitive loss function (Sch¨olkopf et al., 1998).
1Note thatP
l(j) =P(l)
Qm
i P(wi|wi−2, wi−1, l)where
j=w1· · ·wm. Assume a uniform prior forl.
SVR looks something like this.
h(~x) =w~·~x+b,
with input data~x = (x1, . . . , xm) and the corre-sponding weightsw~ = (w1, . . . , wm). ‘x·y’ de-notes the inner product ofxandy. ~xcould be a set of features associated withe andj. Parameters w~ andbare something determined by SVR.
It is straightforward to extend the ALM and FLM with SVR, which merely consists of plugging in ei-ther model as an input variable in the regressor. This would give us the following two SVR models with
m= 1.
Regressive FLM (rFLM)
h(F LM(e, j)) =w1·F LM(e, j) +b
Regressive ALM (rALM)
h(ALM(e, j)) =w1·ALM(e, j) +b
Notice thath(·) here is supposed to relate FLM or ALM to some independent evaluation metric such asBLEU(Papineni et al., 2002), not the log
likeli-hood of a translation.
With confidence models in place, define a MEMT modelΨby:
Ψ(e, J, l) =arg maxj∈J(θ(e, j|l))
Hereerepresents a source sentence,Ja set of trans-lations foregenerated by OTSs, andθdenotes some confidence model under an LMl. Throughout the rest of the paper, we let FLMψ and ALMψ denote MEMT systems based on FLM and ALM, respec-tively, and similarly for others.
3 Notes on Evaluation
We assume here that the MEMT works on a sentence-by-sentence basis. That is, it takes as in-put a source sentence, gets it translated by several OTSs, and picks up the best among translations it gets. Now a problem with usingBLEUin this setup
is that translations often end up with zero because model translations they refer to do not contain n-grams of a particular length.2 This would make im-possible a comparison and selection among im-possible translations.
2
One way out of this, Nomoto (2003) suggests, is to back off to a somewhat imprecise yet robust metric for evaluating translations, which he calls
m-precision.3 The idea of m-precision helps define what an optimal MEMT should look like. Imagine a system which operates by choosing, among can-didates, a translation that gives a best m-precision. We would reasonably expect the system to outper-form any of its component OTSs. Indeed Nomoto (2003) demonstrates empirically that it is the case. Moreover, since rFLMψand rALMψwork on a sen-tence, not on a block of them, whath(·)relates to is notBLEU, but m-precision.
Hogan and Frederking (1998) introduces a new kind of yardstick for measuring the effectiveness of MEMT systems. The rationale for this is that it is often the case that the efficacy of MEMT sys-tems does not translate into performance of outputs that they generate. We recall that with BLEU, one
measures performance of translations, not how of-ten a given MEMT system picks the best translation among candidates. The problem is, even if a MEMT is right about its choices more often than a best com-ponent engine,BLEUmay not show it. This happens
because a best translation may not always get a high score inBLEU. Indeed, differences inBLEUamong candidate translations could be very small.
Now what Hogan and Frederking (1998) suggest is the following.
d(ψm) =
PN
i δ(ψ(me),max{σe1· · ·σeM})
N
whereδ(i, j)is the Kronecker delta function, which gives 1 if i = j and 0 otherwise. Here ψm rep-resents some MEMT system, ψ(me) denotes a par-ticular translationψm chooses for sentence e, i.e.,
ψm
(e) = Ψ(e, J, l). σe1. . . σeM ∈ J denotes a set
of candidate translations. maxhere gives a transla-tion with the highest score in m-precision. N is the number of source sentences. δ(·)says that you get 1 if a particular translation the MEMT chooses for a given sentences happens to rank highest among
can-3
For a reference translation r and a machine-generated translationt, m-precision is defined as:
m-precision=
N
X
i
P
v∈Si tC(v, r)
P
v∈Si tC(v, t)
,
which is nothing more than Papineni et al. (2002)’s modified
n-gram precision applied to a pair of a single reference and the
associated translation. Si
t here denotes a set ofi-grams int,
vani-gram. C(v, t) indicates the count ofvint. Nomoto (2003) finds that m-precision strongly correlates with BLEU, which justifies the use of m-precision as a replacement ofBLEU
at the sentence level.
didates. d(ψm)gives the average ratio of the times
ψm hits a right translation. Let us calld(ψm) HF
accuracy (HFA) for the rest of the paper.
4 LM perplexity and MEMT performance
Now the question we are interested in asking is whether the choice of LM really matters. That is, does a particular choice of LM gives a better per-forming FLMψ or ALMψ than something else, and if it does, do we have a systematic way of choosing one LM over another?
Let us start with the first question. As a way of shedding some light on the issue, we ran FLMψand ALMψusing a variety of LMs, derived from various domains with varying amount of training data. We worked with 24 LMs from various genres, with vo-cabulary of size ranging from somewhere near 10K to 20K in words (see below and also Appendix A for details on train sets). LMs here are trigram based and created using an open source speech recognition tool calledJULIUS.4
Now train data for LMs are collected from five corpora, which we refer to as CPC, EJP, PAT, LIT, NIKMAI for the sake of convenience. CPC is a huge set of semi-automatically aligned pairs of En-glish and Japanese texts from a Japanese news pa-per which contains as many as 150,000 sentences (Utiyama and Isahara, 2002), EJP represents a rel-atively small parallel corpus of English/Japanese phrases (totaling 15,187) for letter writing in busi-ness (Takubo and Hashimoto, 1999), PAT is a bilin-gual corpus of 336,971 abstracts from Japanese patents filed in 1995, with associated translations in English (a.k.a NTCIR-3 PATENT).5LIT contains 100 Japanese literary works from the early 20th cen-tury, and NIKMAI 1,536,191 sentences compiled from several Japanese news paper sources. Both LIT and NIKMAI are monolingual.
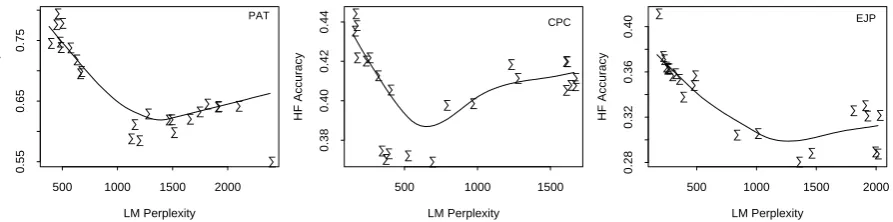
Fig.1 gives a plot of HF accuracy by perplexity for FLMψ’s on test sets pulled out of PAT, EJP and CPC.6 Each dot there represents an FLMψ with a particular LM plugged into it. The HFA of each FLMψ in Fig.1 represents a 10-fold cross validated
HFA score, namely an HFA averaged over
evenly-4
http://julius.sourceforge.jp
5A bibliographic note. NTCIR-3 PATENT: NII Test
Col-lection for Information Retrieval Systems distributed through National Institute of Informatics (www.nii.ac.jp).
6A test set from EJP and CPC each contains 7,500 bilingual
• ••
•• •
• •
••
• •
• •
•• •
•• • •• •
•
LM Perplexity
HF Accuracy
500 1000 1500 2000
0.55
0.65
0.75
PAT
•• •
•• • • • •
• •
• •
• • •
• •
•
• •
• •
LM Perplexity
HF Accuracy
500 1000 1500
0.38
0.40
0.42
0.44 CPC
• • ••
• •
• • •
• •
• •
• •
•
• • •
•
• •
•
LM Perplexity
HF Accuracy
500 1000 1500 2000
0.28
0.32
0.36
0.40
[image:4.595.79.526.96.207.2]EJP
Figure 1: HF accuracy-by-perplexity plots for FLMψ with four OTSs, Ai, Lo, At, Ib, on PAT (left), CPC (center) and EJP (right). Dots represent FLMψ’s with various LMs .
split 10 blocks of a test set. The perplexity is that ofPl(j)averaged over blocks, with a particular LM plugged in forl(see Equation 1).
We can see there an apparent tendency for an LM with lower perplexity to give rise to an FLMψ with higher HFA, indicating that the choice of LM does
indeed influence the performance of FLMψ. Which is somewhat surprising given that the perplexity of a machine generated translation should be
indepen-dent of how similar it is to a model translation,
which dictates theHFA.7
Now let us turn to the question of whether there is any systematic way of choosing an LM so that it gives rise to a FLMψ with high HFA. Since we are working with multiple OTS systems here, we get multiple outputs for a source text. Our idea is to let them vote for an LM to plug into FLMψ or for that matter, any other forms of MEMT dis-cussed earlier. Note that we could take an alternate approach of letting a model (or human) translation (associated with a source text) pick an LM by alone. An obvious problem with this approach, however, is that a mandatory reference to model translations would compromise the robustness of the approach. We would want the LM to work for MEMT regard-less of whether model translations are available. So our concern here is more with choosing an LM in the absence of model translations, to which we will return below.
5 Voting Language Model
We consider here a simple voting scheme `a la ROVER (Fiscus, 1997; Schwenk and Gauvain, 2000; Utsuro et al., 2003), which works by picking
7
Recall that theHFAdoes not represent the confidence score such as one given by FLM (Equation 1), but the average ratio of the times that an MEMT based on FLM picks a translation with the best m-precision.
Table 1: A MEMT algorithm implementing V-by-M.S represents a set of OTS systems, L a set of language models.θis some confidence model such (r)FLM or (r)ALM. V-by-M chooses a most-voted-for LM among those inL, given the setJ of trans-lations fore.
MEMT(e,S,L)
begin
J ={j|jis a translation ofegenerated bys∈S.} l=V-by-M(J, L)
jk=arg maxj∈J(θ(e, j|l))
returnjk
end
up an LM voted for by the majority. More specif-ically, for each output translation for a given input, we first pick up an LM which gives it the smallest perplexity, and out of those LMs, one picked by the majority of translations will be plugged into MEMT. We call the selection scheme voting-by-majority or simply V-by-M. The V-by-M scheme is motivated by the results in Fig.1, where perplexity is found to be a reasonably good predictor ofHFA.
Formally, we could put the V-by-M scheme as follows. For each of the translation outputsj1e. . . jen associated with a given input sentencee, we want to find some LMM from a setLof LMs such that:
Mi=arg minm∈LP P(jie|m),
and plug it intoθsuch as FLM.8
Suppose, for instance, thatMa,Mb,MaandMc are lowest perplexity LMs found for translations
je
1,j2e,je3 andj4e, respectively. Then we chooseMa as an LM most voted for, because it gets two votes fromje
1 and je3, meaning thatMa is nominated as an LM with lowest perplexity by j1e and j3e, while
Mb andMc each collect only one vote. In case of ties, we randomly choose one of the LMs with the largest count of votes.
6 Experiment Setup and Procedure
Let us describe the setup of experiments we have conducted. The goal here is to learn how the V-by-M affects the overall MEMT performance. For test sets, we carry over those from the perplexity experiments (see Footnote 6, Section 4), which are derived from CPC, EJP, and PAT. (Call them tCPC, tEJP, and tPAT hereafter.)
In experiments, we begin by splitting a test set into equal-sized blocks, each containing 500 sen-tences for tEJP and tCPC, and 100 abstracts (ap-proximately 200 sentences) for tPAT.9 We had the total of 15 blocks for tCPC and tEJP, and 46 blocks for tPAT. We leave one for evaluation and use the rest for training alignment models, i.e., Q(e | j), SV regressors and some inside-data LMs. (Again we took care not to inadvertently train LMs on test sets.) We send a test block to OTSs Ai, Lo, At, and Ib, for translation and combine their outputs using the V-by-M scheme, which may or may not be cou-pled with regression SVMs. Recall that the MEMT operates on a sentence by sentence basis. So what happens here is that for each of the sentences in a block, the MEMT works the four MT systems to get translations and picks one that produces the best score underθ.
We evaluate the MEMT performance by run-ningHFAandBLEUon MEMT selected translations
block by block,10 and giving average performance over the blocks. Table 1 provides algorithmic de-tails on how the MEMT actually operates.
8
It is worth noting that the voted language model readily lends itself to a mixture model:P(j) =Pm∈MλmP(j|m)
whereλm= 1ifmis most voted for and 0 otherwise. 9
tCPC had the average of 15,478 words per block, whereas tEJP had about 11,964 words on the average in each block. With tPAT, however, the average per block word length grew to 16,150.
10
We evaluate performance by block, because of some re-ports in the MT literature that warn thatBLEUbehaves errati-cally on a small set of sentences (Reeder and White, 2003). See also Section 3 and Footnote 2 for the relevant discussion.
Table 2: HF accuracy of MEMT models with V-by-M.
Model tCPC tEJP tPAT avg. rFLMψ 0.4230 0.4510 0.8066 0.5602 rALMψ 0.4194 0.4346 0.8093 0.5544 FLMψ 0.4277 0.4452 0.7342 0.5357 ALMψ 0.4453 0.4485 0.7702 0.5547
Table 3: HF accuracy of MEMT models with ran-domly chosen LMs. Note how FLMψ and ALMψ drop in performance.
Model tCPC tEJP tPAT avg. rFLMψ 0.4207 0.4186 0.8011 0.5468 rALMψ 0.4194 0.4321 0.8095 0.5537 FLMψ 0.4126 0.3520 0.6350 0.4665 ALMψ 0.4362 0.3597 0.6878 0.4946
7 Results and Discussion
Now let us see what we found from the experiments. We ran the MEMT on a test set with (r)FLM or (r)ALM embedded in it. Recall that our goal here is to find how the V-by-M affects performance of MEMT on tCPC, tEJP, and tPAT.
First, we look at whether the V-by-M affects in any way, theHFAof the MEMT, and if it does, then how much. Table 2 and Table 3 give summaries of results on HFA versus V-by-M. Table 2 shows how things are with V-by-M on, and Table 3 shows what happens to HFA when we turn off V-by-M, that is,
when we randomly choose an LM from the same set that the V-by-M chooses from. The results indicate a clear drop in performance of FLMψ and ALMψ when one chooses an LM randomly.11
Curiously, however, rFLMψ and rALMψ are af-fected less. They remain roughly at the same level ofHFAover Table 2 and Table 3. What this means
11
Another interesting question to ask at this point is, how does one huge LM trained across domains compare to the V-by-M here? By definition of perplexity, the increase in size of the training data leads to an increase in perplexity of the LM. So if general observations in Fig.1 hold, then we would expect the “one-huge-LM” approach to perform poorly compared to the V-by-M, which is indeed demonstrated by the following results. HFLMψbelow denotes a FLMψbased on a composite LM trained over CPC, LIT, PAT, NIKMAI, and EJP. The testing procedure is same as that described in Sec.6
Table 4: Performance in BLEU of MEMT models with V-by-M.
Model tCPC tEJP tPAT avg. rFLMψ 0.1743 0.2861 0.1954 0.2186 rALMψ 0.1735 0.2869 0.1954 0.2186 FLMψ 0.1736 0.2677 0.1907 0.2107 ALMψ 0.1763 0.2622 0.1934 0.2106
Table 5: Performance in BLEU of MEMT models
with randomly chosen LMs.
Model tCPC tEJP tPAT avg. rFLMψ 0.1738 0.2717 0.1950 0.2135 rALMψ 0.1735 0.2863 0.1954 0.2184 FLMψ 0.1710 0.2301 0.1827 0.1946 ALMψ 0.1745 0.2286 0.1871 0.1967
is that there is some discrepancy in the effective-ness of V-by-M between the fluency based and re-gression based models. We have no explanation for the cause of the discrepancy at this time, though we may suspect that in learning, as long as there is some pattern to exploit in m-precision and the probability estimates of test sentences, how accurate those esti-mates are may not matter much.
[image:6.595.78.286.634.735.2]Table 4 and Table 5 give results in BLEU.12 The results tend to replicate what we found with HFA. rFLMψ and rALMψ keep the edge over FLMψ and ALMψ whether or not V-by-M is brought into action. The differences in performance between rFLMψ and rALMψ with or without the V-by-M scheme are rather negligible. However, if we turn to FLMψ and ALMψ, the effects of the V-by-M are clearly visible. FLMψ scores 0.2107 when coupled with the V-by-M. However, when disengaged, the score slips to 0.1946. The same holds for ALMψ.
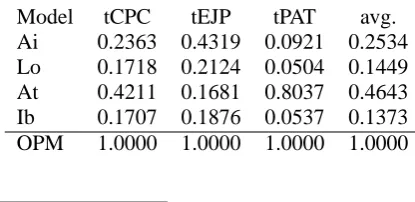
Table 6: HF accuracy of OTS systems
Model tCPC tEJP tPAT avg. Ai 0.2363 0.4319 0.0921 0.2534 Lo 0.1718 0.2124 0.0504 0.1449 At 0.4211 0.1681 0.8037 0.4643 Ib 0.1707 0.1876 0.0537 0.1373 OPM 1.0000 1.0000 1.0000 1.0000
12The measurements in
BLEUhere take into account up to trigrams.
Table 7: Performance of OTS systems inBLEU.
Model tCPC tEJP tPAT avg. Ai 0.1495 0.2874 0.1385 0.1918 Lo 0.1440 0.1711 0.1402 0.1518 At 0.1738 0.1518 0.1959 0.1738 Ib 0.1385 0.1589 0.1409 0.1461 OPM 0.2111 0.3308 0.1995 0.2471
Leaving the issue of MEMT models momentar-ily, let us see how the OTS systems Ai, Lo, At, and Ib are doing on tCPC, tEJP, and tPAT. Note that the whole business of MEMT would collapse if it slips behind any of the OTS systems that compose it.
Table 6 and Table 7 show performance of the four OTS systems plus OPM, byHFAand byBLEU. OPM here denotes an oracle MEMT which operates by choosing in hindsight a translation that gives the best score in m-precision, among those produced by OTSs. It serves as a practical upper bound for MEMT while OTSs serve as baselines.
First, let us look at Table 6 and compare it to Ta-ble 2. A good news is that most of the OTS sys-tems do not even come close to the MEMT mod-els. At, a best performing OTS system, gets 0.4643 on the average, which is about 20% less than that scored by rFLMψ. Turning to BLEU, we find again
in Table 7 that a best performing system among the OTSs, i.e., Ai, is outperformed by FLMψ, ALMψ and all their varieties (Table 4). Also something of note here is that on tPAT, (r)FLMψ and (r)ALMψ in Table 4, which operate by the V-by-M scheme, score somewhere from 0.1907 to 0.1954 in BLEU,
coming close to OPM, which scores 0.1995 on tPAT (Table 7).
It is interesting to note, incidentally, that there is some discrepancy between BLEU and HFA in per-formance of the OTSs: A top performing OTS in Table 6, namely At, achieves the average HFA of 0.4643, but scores only 0.1738 forBLEU(Table 7),
which is worse than what Ai gets. Apparently, highHFAdoes not always mean a highBLEUscore. Why? The reason is that a best MT output need not mark a highBLEUscore. Notice that ‘best’ here means the best among translations by the OTSs. It could happen that a poor translation still gets chosen as best, because other translations are far worse.
Table 8: HF accuracy of MEMTs with perturbed SV regressor in the V-by-M scheme.
Model tCPC tEJP tPAT avg. rFLMψ 0.4230 0.4353 0.6712 0.5098 rALMψ 0.4195 0.4302 0.5582 0.4693 FLMψ 0.4277 0.4452 0.7342 0.5357 ALMψ 0.4453 0.4485 0.7702 0.5547
Table 9: Performance inBLEUof MEMTs with
per-turbed SV regressor in the V-by-M scheme.
Model tCPC tEJP tPAT avg. rFLMψ 0.1743 0.2823 0.1835 0.2134 rALMψ 0.1736 0.2843 0.1696 0.2092 FLMψ 0.1736 0.2677 0.1907 0.2107 ALMψ 0.1763 0.2622 0.1934 0.2106
Table 2,4 and also Table 3,5). Regression allows the MEMT models to correct themselves for some domain-specific bias of the OTS systems. But the downside of using regression to capitalize on their bias is that you may need to be careful about data you train a regressor on.
Here is what we mean. We ran experiments using SVM regressors trained on a set of data randomly sampled from tCPC, tEJP, and tPAT. (In contrast, rFLMψand rALMψin earlier experiments had a re-gressor trained separately on each data set.) They all operated in the V-by-M mode. The results are shown in Table 8 and Table 9. What we find there is that with regressors trained on perturbed data, both rFLMψand rALMψare not performing as well as before; in fact they even fall behind FLMψ and ALMψ inHFAand their performance inBLEUturns out to be just about as good as FLMψ and ALMψ. So regression may backfire when trained on wrong data.
8 Conclusion
Let us summarize what we have done and learned from the work. We started with a finding that the choice of language model could affect performance of MEMT models of which it is part. The V-by-M was introduced as a way of responding to the prob-lem of how to choose among LMs so that we get the best MEMT. We have shown that the V-by-M scheme is indeed up to the task, predicting a right LM most of the time. Also worth mentioning is that the MEMT models here, when coupled with V-by-M, are all found to surpass component OTS systems
by a respectable margin (cf., Tables 4, 7 forBLEU, 2, 6 forHFA).
Regressive MEMTs such as rFLMψand rALMψ, are found to be not affected as much by the choice of LM as their non-regressive counterparts. We sus-pect this happens because they have access to ex-tra information on the quality of ex-translation derived from human judgments or translations, which may cloud effects of LMs on them. But we also pointed out that regressive models work well only when they are trained on right data; if you train them across different sources of varying genres, they could fail.
An interesting question that remains to be ad-dressed is how we might deal with translations from a novel domain. One possible approach would be to use a dynamic language model which adapts it-self for a new domain by re-training itit-self on data sampled from the Web (Berger and Miller, 1998).
References
Yasuhiro Akiba, Taro Watanabe, and Eiichiro Sumita. 2002. Using language and translation models to select the best among outputs from multiple mt systems. In Proceedings of the 19th
International Conference on Computational Lin-guistics (COLING 2002), Taipei.
Adam Berger and Robert Miller. 1998. Just-in-time language modelling. In Proceedings of
ICASSP98.
Ralf Brown and Robert Frederking. 1995. Ap-plying statistical English language modelling to symbolic machine translation. In Proceedings of
the Sixth International Conference on Theoretical and Methodological Issues in Machine Transla-tion (TMI’95), pages 221–239, Leuven, Belgium,
July.
Peter F. Brown, Stephen A. Della Pietra, Vin-cent J.Della Pietra, and Robert L. Mercer. 1993. The mathematics of statistical machine transla-tion: Parameter estimation. Computational
Lin-guistics, 19(2):263–311, June.
Jamie Callan, Fabio Crestani, Henrik Nottelmann, Pietro Pala, and Xia Mang Shou. 2003. Re-source selection and data fusion in multimedia distributed digital libaries. In Proceedings of the
26th Annual International ACM/SIGIR Confer-ence on Research and Development in Informa-tion Retrieval. ACM.
Jonathan G. Fiscus. 1997. A post-processing sys-tem to yield reduced word error rates: Recogniser output voting error reduction (ROVER). In Proc.
IEEE ASRU Workshop, pages 347–352, Santa
Barbara.
Three heads are better than one. In
Proceed-ings of the Fourth Conference on Applied Natural Language Processing, Stuttgart.
Christopher Hogan and Robert E. Frederking. 1998. An evaluation of the multi-engine MT architec-ture. In Proceedings of the Third Conference of
the Association for Machine Translation in the Americas (AMTA ’98), pages 113–123, Berlin,
October. Springer-Verlag. Lecture Notes in Ar-tificial Intelligence 1529.
Tadashi Nomoto. 2003. Predictive models of per-formance in multi-engine machine translation. In
Proceedings of Machine Translation Summit IX,
New Orleans, September. IAMT.
Kishore Papineni, Salim Roukos, Todd Ward, and Wei ing Zhu. 2002. BLEU: a method for auto-matic evaluation of machine translation. In
Pro-ceedings of the 40th Annual Meeting of the As-sociation for Computational Linguistics, pages
311–318, July.
Florence Reeder and John White. 2003. Granular-ity in MT evaluation. In MT Summit Workshop on
Machine Translation Evaluation: Towards Sys-tematizing MT Evaluation, pages 37–42, New
Or-leans. AMTA.
Bernhard Sch¨olkopf, Chirstpher J. C. Burges, and Alexander J. Smola, editors. 1998. Advances in
Kernel Methods: Support Vector Learning. The
MIT Press.
Holger Schwenk and Jean-Luc Gauvain. 2000. Combining multiple speech recognizers using voting and language model information. In
Pro-ceedings of the IEEE International Conference on Speech and Language Proceesing (ICSLP),
volume 2, pages 915–918, Beijin, October. IEEE. Kohei Takubo and Mitsunori Hashimoto. 1999. A Dictionary of English Business Letter Ex-pressions. Published in CDROM. Nihon Keizai Shinbun Sha.
Calandra Tate, Sooyon Lee, and Clare R. Voss. 2003. Task-based MT evaluation: Tackling soft-ware, experimental design, & statistical models. In MT Summit Workshop on Machine Translation
Evaluation: Towards Systematizing MT Evalua-tion, pages 43–50. AMTA.
Masao Utiyama and Hitoshi Isahara. 2002. Align-ment of japanese-english news articles and sen-tences. In IPSJ Proceedings 2002-NL-151, pages 15–22. In Japanese.
Takehito Utsuro, Yasuhiro Kodama, Tomohiro Watanabe, Hiromitsu Nishizaki, and Seiichi Nak-agawa. 2003. Confidence of agreement among multiple LVCSR models and model combination by svm. In Proceedings of the 28th IEEE
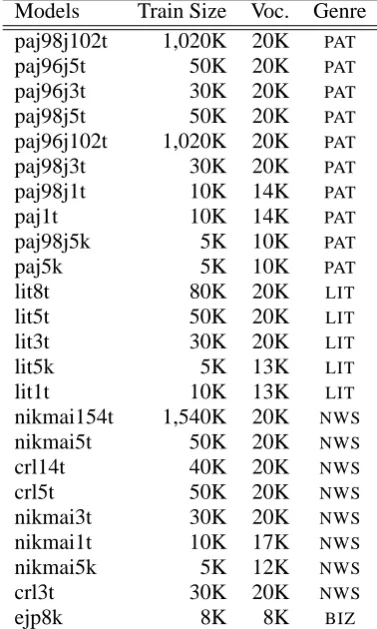
Interna-Table 10: Language models in MEMT
Models Train Size Voc. Genre paj98j102t 1,020K 20K PAT
paj96j5t 50K 20K PAT
paj96j3t 30K 20K PAT
paj98j5t 50K 20K PAT
paj96j102t 1,020K 20K PAT
paj98j3t 30K 20K PAT
paj98j1t 10K 14K PAT
paj1t 10K 14K PAT
paj98j5k 5K 10K PAT
paj5k 5K 10K PAT
lit8t 80K 20K LIT
lit5t 50K 20K LIT
lit3t 30K 20K LIT
lit5k 5K 13K LIT
lit1t 10K 13K LIT
nikmai154t 1,540K 20K NWS
nikmai5t 50K 20K NWS
crl14t 40K 20K NWS
crl5t 50K 20K NWS
nikmai3t 30K 20K NWS
nikmai1t 10K 17K NWS
nikmai5k 5K 12K NWS
crl3t 30K 20K NWS
ejp8k 8K 8K BIZ
tional Conference on Acoustics, Speech and Sig-nal Processing, pages 16–19. IEEE, April.
John White. 2001. Predicting intelligibility from fi-delity in MT evaluation. In Proceedings of the
workshop ”MT Evaluation: Who did What to Whom”, pages 35–37.
Appendix
A Language Models
Table 10 lists language models used in the voting based MEMTs discussed in the paper. They are more or less arbitrarily built from parts of the co-pora CPC, EJP, NIKMAI, EJP, and LIT. ‘Train size’ indicates the number of sentences, given in kilo, in a corpus on which a particular model is trained. Under ‘Voc(abulary)’ is listed the number of type words for each LM (also given in kilo). Notice the difference in the way the train set and vocabu-lary are measured. ‘Genre’ indicates the genre of a trainig data used for a given LM:PAT stands for patents (from PAT), LIT literary texts (from LIT),
NWS news articles (from CPC and NIKMAI), and
[image:8.595.332.521.105.420.2]