T h r e e H e a d s a r e B e t t e r t h a n O n e
Robert Frederking
Center for Machine Translation
Carnegie Mellon University
Pittsburgh, PA 15213
[email protected]
Sergei
Nirenburg
Computing Research Laboratory
New Mexico State University
Las Cruces, NM 88003
[email protected]
Abstract
Machine translation (MT) systems do not currently achieve optimal quality trans- lation on free text, whatever translation m e t h o d they employ. Our hypothesis is that the quality of M T will improve if an M T environment uses o u t p u t from a vari- ety of M T systems working on the same
text. In the latest version of the Pan-
gloss M T project, we collect the results of three translation engines - - typically, sub- sentential chunks - - in a chart data struc- ture. Since the individual M T systems op- erate completely independently, their re- sults may be incomplete, conflicting, or re- dundant. We use simple scoring heuristics to estimate the quality of each chunk, and find the highest-score sequence of chunks (the "best cover"). This paper describes in detail the combining method, present- ing the algorithm and illustrations of its progress on one of many actual translations it has produced. It uses dynamic program- ming to efficiently compare weighted aver- ages of sets of adjacent scored component translations. T h e current system operates primarily in a human-aided M T mode. T h e translation delivery system and its associ- ated post-editing aide are briefly described, as is an initial evaluation of the usefulness of this method. Individual M T engines will be reported separately and are not, there- fore, described in detail here.
95
1
I N T R O D U C T I O N
Current M T systems, whatever translation method they employ, do not reach an optimal o u t p u t on free text. In part, this is due to the inherent problems of a particular m e t h o d - - for instance, the inabil- ity of statistics-based M T to take into account long- distance dependencies, the difficulty in achieving ex- tremely broad coverage in knowledge-based M T sys- tems, or the reliance of most transfer-oriented M T systems on similarities in syntactic structures of the source and the target languages.
Our hypothesis is that if an M T environment can use the best results from a variety of M T systems working simultaneously on the same text, the overall quality will improve. Using this novel approach to M T in the latest version of the Pangloss M T project, we submit an input text to a b a t t e r y of machine translation systems (engines), collect their (possibly, incomplete) results in a joint chart data structure and select the overall best translation using a set of simple heuristics.
2
I N T E G R A T I N G
M U L T I - E N G I N E O U T P U T
In our experiment we used three M T engines:
* a knowledge-based M T ( K B M T ) system, the mainline Pangloss engine (Frederking et al., 1993b);
• an example-based M T ( E B M T ) system (see (Nirenburg et al., 1993; Nirenburg et al., 1994b); the original idea is due to Nagao (Na- gao, 1984)); and
• a lexical transfer system, fortified with mor- phological analysis and synthesis modules and
machine-readable dictionary (the Collins Span- ish/English), the lexicons used by the K B M T modules, a large set of user-generated bilingual glossaries as well as a gazetteer and a list of proper and organization names.
The outputs from these engines (target language
words and phrases) are recorded in a chart whose
positions correspond to words in the source language input. As a result of t h e operation of each of the M T engines, new edges are added to the chart, each labeled with the translation of a region of the input string and indexed by this region's beginning and end positions. We will refer to all of these edges as components (as in "components of the translation") for the remainder of this article. T h e K B M T and
E B M T engines also carry a quality score for each
o u t p u t element. T h e K B M T scores are produced based on whether any questionable heuristics were used in the source analysis or target generation. T h e E B M T scores are produced using a technique based on h u m a n judgements, as described in (Nirenburg et
al., 1994a), submitted.
User
Translator's WorkStation
Knowledge-Based MT
Example-Based MT
Manager
C h a r tLexical t r a n s f e r MT
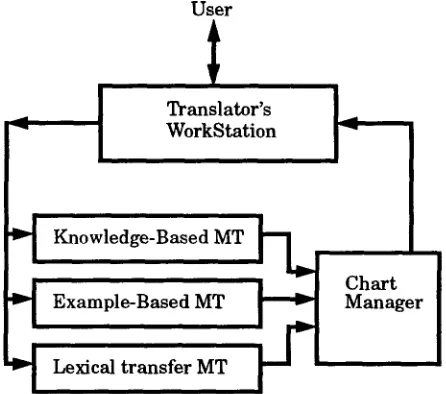
Figure 1: Structure of a multi-engine M T system
Figure 1 presents a general view of the operation
of our multi-engine M T system. T h e chart manager
selects the overall best cover from the collection of candidate partial translations by normalizing each component's quality score (positive, with larger be- ing better), and then selecting the best combination
of components with the help of the chart walk algo-
rithm.
Figure 2 illustrates the result of this process on
the example Spanish sentence: Al momento de su
venta a Iberia, V I A S A contaba con ocho aviones, que ten'an en promedio 13 a~os de vuelo which can
be translated into English as At the moment of its
sale to Iberia, V I A S A had eight airplanes, which had
on average thirteen years o[ flight (time). This is a sentence from one of the 1993 ARPA M T evaluation texts.
For each component, the starting and ending po- sitions in the chart, the corresponding source lan- guage words, and alternative translations are shown, as well as the engine and the engine-internal qual- ity scores. Inspection of these translations shows numerous problems; for example, at position 12, "aviones" is translated, among other things, as "air- crafts". It must be remembered that these were generated automatically from an on-line dictionary, without any lexical feature marking or other h u m a n intervention. It is well known t h a t such a u t o m a t i c methods are at the moment less than perfect, to say the least. In our current system, this is not a major problem, since the results go through a m a n d a t o r y editing step, as described below.
2.1 N o r m a l i z i n g t h e c o m p o n e n t s c o r e s
T h e chart manager normalizes the internal scores to make them directly comparable. In the case of K B M T and E B M T , the pre-existing scores are mod- ified, while lexical transfer results are scored based on the estimated reliability of individual databases, from 0.5 up to 15. Currently the K B M T scores are reduced by a constant, except for known erroneous output, which has its score set to zero. T h e internal E B M T scores range from 0 being perfect to 10,000 being worthless; but the scores are nonlinear. So a region selected by a threshold is converted linearly into scores ranging from zero to a normalized max- imum E B M T score. T h e normalization levels were empirically determined in the initial experiment by having several individuals judge the comparative av- erage quality of the outputs in an actual translation run.
In every case, the base score produced by the scor- ing functions is currently multiplied by the length of the candidate in words, on the assumption that longer items are better. We intend to test a variety of functions in order to find the right contribution of the length factor.
2.2 T h e c h a r t w a l k a l g o r i t h m
Figure 3 presents the chart walk algorithm used to produce a single, best, non-overlapping, contigu- ous combination (cover) of the available component translations, assuming correct component quality scores. T h e code is organized as a recursive divide- and-conquer procedure: to calculate the cover of a region of the input, it is repeatedly split into two parts, at each possible position. Each time, the best possible cover for each part is recursively found, and the two scores are combined to give a score for the chart walk containing the two best subwalks. These different splits are then compared with each other and with components from the chart spanning the whole region (if any), and the overall best result is
[image:2.612.107.330.347.544.2]Position Input L R (Spanish) 0 1 Al
momento 2 2 de 3 3 s u
4 4 venta
5 5 a 6 6 Iberia 7 7
8 8 ~rIASA 9 10 contaba
con
11 11 ocho 12 12 aviones
Output E Q
(Eng sh)
"In a minute" G 10 "At once"
"A moment"
of from about D for by
his her its G one's your their inn sale selling G marketing
"country inn" "small shop" stall booth
to a of D 2
Iberia G 5
G 5
VIASA D 2
"was rely on" G 10 "rely on" "was
Count o n "
"count on" "was depending on" "depended on" have
eight eighth D 2
airplane L 2.5 aeroplanes
planes aircrafts airplanes martins 13 13 ,
14 14 que 15 15 ten[an
16 16 en 17 17 promedio 18 18 13 19 21 afios de
vuelo
22 22
hopscotches
G 5 who that D 2 whom which
"were have" G 5 "have"
"were hold" hold "were thinking" thought "were considering" considered "were deeming" deemed "were coming"
c a m e
in on onto D 2 at by
average mean G 5 middle midpoint
mid-point
13 L 15
"years of E 8.8 experience
with space flight" "flight activities" "of years"
Figure 2: Chart walk results
D 2
used. The terminating step of this recursion is thus getting components from the chart.
To find best walk on a region:
i f t h e r e i s a s t o r e d r e s u l t f o r t h i s r e g i o n then r e t u r n i t
e l s e begin
get a l l p r i m i t i v e components f o r the r e g i o n f o r each p o s i t i o n p within the r e g i o n
begin
split region into two parts at p find best walk for first part find best walk for second part
c o m b i n e into a component
e n d
find maximum s c o r e o v e r all primitive
and combined components
s t o r e and return it
e n d
Figure 3: Chart walk algorithm
W i t h o u t dynamic programming, this would have a combinatorial time complexity. D y n a m i c program- ming utilizes a large array to store partial results, so that the best cover of any given subsequence is only computed once; the second time that a recursive call would compute the same result, it is retrieved from the array instead. This reduces the time complexity to O(n3), and in practice it uses an insignificant part of total processing time.
All possible combinations of components are com- pared: this is not a heuristic method, but an efficient exhaustive one. This is what assures that the cho- sen cover is optimal. This assumes, in addition to the scores actually being correct, that the scores are compositional, in the sense that the combined score for a set of components really represents their quality as a group. This might not be the case, for example, if gaps or overlaps are allowed in some cases (per- haps where they contain the same words in the same positions).
We calculate the combined score for a sequence of components as the
weighted
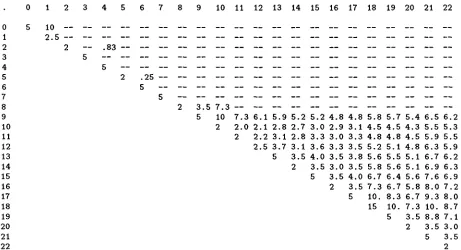
average of their individ- ual scores. Weighting by length is necessary so that the same components, when combined in a different order, produce the same combined scores. Otherwise the algorithm can produce inconsistent results.The chart walk algorithm can also be thought of as filling in the two-dimensional d y n a m i c - p r o g r a m m i n g array!. Figure 4 shows an intermediate point in the filling of the array. In this figure, each element
(i,j)
is initially the best score of any single chart compo- nent covering the input region from word i to word j. Dashes indicate that no one component covers ex- 1 Note that this array is a different data structure from the chart.0 1 2 3 4 5 6 7
8
9 10 11 12 13 14 15 16 17 18 19 20 21 22
1 2 3 4 5 6 7 8 9 10 11 12 13 14 15 16 17 18 19 20 21 22
1 0 . . . . 2 . 5 . . . .
2 - - . 8 3 . . . .
5 . . . . 5 . . . .
2 . 2 5 . . . .
5 . . . . 5 . . . .
2 3 . 5 7 . 3 . . . . 5 10 7 . 3 6 . 1 5 . 9 5 . 2 5 . 2 4 . 8 4 . 8 5 . 8 5 . 7 5 . 4 6 . 5 6 . 2
2 . 0 2 . 1 2 . 8 2 . 7 3 . 0 2 . 9 3 . 1 4 . 5 4 . 5 4 . 3 5 . 5 5 . 3 2 2 . 2 3 . 1 2 . 8 3 . 3 3 . 0 3 . 3 4 . 8 4 . 8 4 . 5 5 . 9 5 . 5
2 . 5 3 . 7 3 . 1 3 , 6 3 . 3 3 . 5 5 . 2 5 . 1 4 . 8 6 , 3 5 . 9 5 3 . 5 4 . 0 3 . 5 3 . 8 5 . 6 5 . 5 5 . 1 6 . 7 6 . 2
2 3 . 5 3 , 0 3 . 5 5 . 8 5 . 6 5 . 1 6 . 9 6 . 3 5 3 . 5 4 . 0 6 . 7 6 , 4 5 . 6 7 . 6 6 . 9
2 3 . 5 7 . 3 6 . 7 5 . 8 8 . 0 7 , 2 5 10. 8 . 3 6 . 7 9 . 3 8 . 0
15 1 0 . 7 . 3 1 0 . 8 , 7 5 3 . 5 8 . 8 7 . 1
2 3 . 5 3 . 0 5 3 . 5
2
F i g u r e 4: T r i a n g u l a r a r r a y f i l l e d i n t h r o u g h ( 8 , 1 0 ) b y c h a r t w a l k
0
1
2 3 4 5 6 7
8
9 10 11 12 13 14 15 16 17 18 19 20 21 22
1 2 3 4 5 6 7 8 9 10 11 12 13 1 4 15 16 17 18 19 2 0 2 1 2 2
I 0 7 . 3 6 . 7 6 . 4 5 . 6 5 . 5 5 . 5 5 . 1 5 . 1 6 . 0 5 . 6 5 . 4 5 . 3 5 . 1 5 . 1 4 . 9 4 . 9 5 . 5 2 . 5 2 , 2 3 . 1 3 . 6 3 . 3 3 . 5 3 . 7 3 . 5 3 . 7 4 , 8 4 . 5 4 . 4 4 . 4 4 . 2 4 . 3 4 . 1 4 . 2 4 . 8
2 3 . 5 4 . 0 3 . 5 3 . 8 4 , 0 3 . 7 3 . 8 5 . 1 4 . 8 4 . 5 4 . 6 4 . 4 4 . 4 4 . 3 4 . 3 4 . 9 5 5 . 0 4 . 0 4 . 2 4 . 4 4 . 0 4 . 1 5 . 5 5 . 1 4 . 8 4 . 8 4 . 6 4 . 6 4 . 4 4 . 5 5 . 1
5 3 . 5 4 . 0 4 . 2 3 . 8 4 . 0 5 . 5 5 . 1 4 . 8 4 . 8 4 . 5 4 . 6 4 . 4 4 . 4 5 . 1 2 3 . 5 4 . 0 3 . 5 3 . 8 5 . 6 5 . 1 4 . 8 4 . 8 4 . 5 4 . 5 4 . 3 4 . 4 5 . 1
5 5 . 0 4 . 0 4 . 2 6 . 4 5 . 6 5 . 2 5 . 1 4 . 8 4 . 8 4 . 5 4 . 6 5 . 4 5 3 . 5 4 . 0 6 . 7 5 . 8 5 . 2 5 . 2 4 . 8 4 . 8 4 . 5 4 . 5 5 . 4
2 3 . 5 7 . 3 6 . 0 5 . 3 5 . 2 4 . 7 4 . 8 4 . 5 4 . 5 5 . 5 5 10 7 . 3 6 . 1 5 . 9 5 , 2 5 2 4 . 8 4 . 8 5 , 8
2 . 0 2 . 1 2 . 8 2 . 7 3 2 2 . 2 3 . 1 2 . 8 3
2 . 5 3 . 7 3 . 1 3 5 3 . 5 4
2 3
5
0 2 . 9 3 . 1 4 . 5 3 3 . 0 3 . 3 4 . 8 6 3 . 3 3 . 5 5 . 2 0 3 . 5 3 . 8 5 . 6 5 3 . 0 3 . 5 5 . 8 3 . 5 4 . 0 6 . 7 2 3 . 5 7 . 3
5 10.
15
F i g u r e 5: F i n a l a r r a y p r o d u c e d b y c h a r t w a l k
5 . 4 5 . 3 5 . 9 5 . 7 4 . 8 4 . 7 5 . 4 5 . 2 4 . 9 4 . 8 5 . 5 5 . 3 5 . 1 4 . 9 5 . 7 5 . 5 5 . 1 4 . 9 5 . 7 5 . 5 5 . 1 4 . 9 5 . 8 5 . 6 5 . 3 5 . 1 6 . 0 5 . 8 5 . 4 5 . 1 6 . 1 5 . 8 5 . 4 5 . 1 6 . 2 5 . 9 5 . 7 5 . 4 6 . 5 6 . 2 4 . 5 4 . 3 5 . 5 5 . 3 4 . 8 4 . 5 5 . 9 5 . 5 5 . 1 4 . 8 6 . 3 5 . 9 5 . 5 5 . 1 6 . 7 6 . 2 5 . 6 5 . 1 6 . 9 6 . 3 6 . 4 5 . 6 7 . 6 6 . 9 6 . 7 5 . 8 8 . 0 7 . 2 8 . 3 6 . 7 9 . 3 8 . 0 1 0 . 7 . 3 1 0 . 8 . 7 5 3 . 5 8 . 8 7 . 1
2 3 . 5 3 . 0 5 3 . 5
[image:4.612.100.561.106.356.2] [image:4.612.100.560.445.682.2]actly that region. (In rows 1 through 7, the array has not yet been operated on, so it still shows its ini- tial state.) After processing (see rows 9 through 22), each element is the score for the best s e t of compo- nents covering the input from word i to word j (the best cover for this substring) ~. (Only a truncated score is shown for each element in the figure, for readability. There is also a list of best components associated with each element.) T h e array is upper triangular since the starting position of a component i must be less than or equal to its ending position j. For any position, the score is calculated based on a combination of scores in the row to its left and in the column below it, versus the previous contents of the array cell for its position. So the array must be filled from the b o t t o m - u p , and left to right. Intuitively, this is because larger regions must be built up from smaller regions within them.
For example, to calculate element (8,10), we com- pute the length-weighted averages of the scores of the best walks over the pair of elements (8,8) and (9,10) versus the pair (8,9) and (10,10), and compare them with the scores of any single chart components going from 8 to 10 (there were none), and take the maximum. Referring to Figure 2 again, this corre- sponds to a choice between combining the transla- tions of (8,8) V I A S A and (9,10) conlaba con versus
combining the (not shown) translations of (8,9) VI-
A S A contaba and (10,10) con. (This (8,9) element
was itself previously built up from single word com- ponents.) Thus, we compare ( 2 . 1 + 1 0 , 2 ) / 3 - 7.33 with ( 3 . 5 . 2 + 2 . 1 ) / 3 = 3.0 and select the first, 7.33.
T h e first wins because contaba con has a high score
as an idiom from the glossary.
Figure 5 shows the final array. When the element in the top-right corner is produced (5.78), the algo- rithm is finished, and the associated set of compo- nents is the final chart walk result shown in Figure 2. It may seem that the scores should increase to- wards the top-right corner. This has not generally been the case. While the system produces a num- ber of high-scoring short components, many low- scoring components have to be included to span the
entire input. Since the score is a weighted aver-
age, these low-scoring components pull the combined
score down. A clear example can be seen at position (18,18), which has a score of 15. The scores above and to its right each average this 15 with a 5, for total values of 10.0 (all the lengths happen to be 1), and the score continues to decrease with distance from this point as one moves towards the final score, which does include the component for (18,18) in the cover.
2In the actual implementation, the initial components are not present yet in the array, since the presence of an element indicates that the computation has been carried out for this position. They are accessed from the chart data structure as needed, but are shown here as an aid to understanding.
2.3 R e o r d e r i n g c o m p o n e n t s
T h e chart-oriented integration of M T engines does not easily support deviations from the linear order of the source text elements, as when discontinuous con- stituents translate contiguous strings or in the case of cross-component substring order differences. We use a language pair-dependent set of postprocess- ing rules to alleviate this (for example, by switching the order of adjacent single-word adjective and noun components).
3
T R A N S L A T I O N D E L I V E R Y
S Y S T E M
Results of multi-engine M T were fed in our exper- iment into a translator's workstation ( T W S ) (Co- hen et al., 1993), through which a translator ei- ther approved the system's o u t p u t or modified it. The main option for h u m a n interaction in T W S cur- rently is the Component Machine-Aided Translation (CMAT) editor (Frederking et hi., 1993a). The user sees the original source language text in one editor window, and phrases marked by double angle brack- ets in another, each of which is the first translation from a candidate chosen by the chart walk. Menus, function keys and mouse clicks are used to perform both regular and enhanced editing actions.
The most important enhancement provided is the ability to select an alternate translation with a popup menu, and instantly replace the system's initially chosen candidate translation string, which becomes the first alternative in this menu if it is used again. The alternate translations are the other translations from the chosen component 3.
As mentioned above, Figure 2 shows the sets of candidates in the best chart walk that are presented as choices to the h u m a n user through the CMAT editor in our example.
T E S T I N G A N D E V A L U A T I N G
M U L T I - E N G I N E
P E R F O R M A N C E
Automatically assessing the utility of the multi- engine system relative to the engines taken sepa- rately would be a useful development tool. The best m e t h o d we could find was counting the number of keystrokes in the T W S to convert the outputs of in- dividual engines and the multi-engine configuration to a "canonical" h u m a n translation. A sample test on a passage of 2060 characters from the June 1993 evaluation of Pangloss is shown in figure 6.
The difference in keystrokes was calculated as fol- lows: one keystroke for deleting a character; two
3The CMAT editor may also include translations from other candidates, lower in the menu, if they have the same boundaries as the chosen candidate and the menu is not too long.
Type of translation
ht~rnan tester (US Government Level 2 translator)
Word-for-word lookup in MRDs lookup in phrasal glossaries KBMT
Example-Based MT Multi-engine configuration
I Keystroke difference 1542
1829 1973 1883 1876 1716
Figure 6: Results of keystroke test
and target languages. It is a weaker approach, but should go some distance in selecting between other- wise indistinguishable outputs.
Another possible direction for future development would be to employ ideas from the area of heuristic search, and only run the highest-quality-score en- gine on each unit of source text. This assumes that we can reliably estimate scores in advance (not cur- rently true for the expensive engines), and that the engines can be run on fragments. A less ambitious version of this idea would be to run the low-scoring engines only where there are gaps in the normally high-scoring engines.
keystrokes for inserting a character; three keystrokes for deleting a word (in an editor with mouse action); three keystrokes plus the number of characters in the word being inserted for inserting a word. It is clear from the above table that the multi-engine config- uration works better than any of our available in- dividual engines, though it still does not reach the quality of a Level 2 translator.
It is also clear that using keystrokes as a measure is not very satisfactory. It would be much better to
make the comparison against the closest member of
a set of equivalent paraphrastic translations, since there are many "correct" ways of translating a given input. However, this is predicated on the availability of a "paraphraser" system, developing which is not a trivial task.
5 C U R R E N T A N D F U T U R E
W O R K
Ultimately, a multi-engine system depends on the quality of each particular engine. We expect the performance of KBMT and EBMT to grow. We plan to use a standard regression mechanism to modify the scoring system based on feedback from having humans select the best covers for test texts.
The current system is human-aided. We have be- gun an experiment with a fully-automated mode, with the understanding that the quality will drop. The most important effect of this change is that accurate quality scores become much more impor- tant, since the first choice becomes the only choice. Besides improving the KBMT and EBMT scoring mechanisms, we need to provide finer distinctions
for the lexical transfer engine's output. As the
databases for this are quite large (all together, over 400,000 entries), adding scores to individual entries is, in the short run, prohibitive. We have not as yet discovered any feasible automatic technique for gen- erating such scores. Instead, we are planning to use an English language model on the output, in a man- ner similar to that done by speech and statistical translation systems (Brown et al., 1990). Statisti-
cally generating such a model is feasible, since it does
not rely on knowing correspondences between source
R e f e r e n c e s
Brown, P., K. Cocke, S. Della Pietra, V.J. Della Pietra, F. Jelinek, J.D. Lafferty, R.L. Mercer and P.S. Roossin. "A statistical approach to Ma-
chine Translation", Computational Linguistics 16,
pp.79-85, 1990.
Cohen, A., Cousseau, P., Frederking, R., Grannes, D., Khanna, S., McNeilly, C., Nirenburg, S., Shell,
P., Waeltermann, D. Translator's WorkStation
User Document, Center for Machine Translation, Carnegie Mellon University, 1993.
Frederking, R., Grannes, D., Cousseau, P., and Nirenburg, S. "An MAT Tool and Its Effective- ness." In Proceedings of the DARPA Human Lan- guage Technology Workshop, Princeton, N J, 1993.
Frederking, R., A. Cohen, P. Cousseau, D. Grannes and S. Nirenburg. "The Pangloss Mark I MAT System." Proceedings of EACL-93, Utrecht, The Netherlands, 1993.
Nagao, M. "A framework of a mechanical translation between Japanese and English by analogy princi- ple." In: A. Elithorn and R. Banerji (eds.) Artifi- cial and Human Intelligence. NATO Publications, 1984.
Nirenburg, S., C. Domashnev and D.J. Grannes. "Two Approaches to Matching in Example-Based Machine Translation." Proceedings of TMI-93, Kyoto, 1993.
Nirenburg, S., S. Beale and C. Domashnev. "A Full-Text Experiment in Example-Based Machine Translation." Submitted to the International Con- ference on New Methods in Language Processing, Manchester, September 1994.
Nirenburg, S., S. Beale, C. Domashnev and P. Sheridan. "Example-Based Machine Translation
[image:6.612.106.315.88.197.2]