Prediction of In-Plane Anisotropy of Bendability Based
on Orientation Distribution Function for Polycrystalline
Face-Centered Cubic Metal Sheets with Various Textures
Hirofumi Inoue
Department of Materials Science, Graduate School of Engineering, Osaka Prefecture University, Sakai 599-8531, Japan
Bendability of sheet metals is strongly affected by crystallographic orientation and it has recently been found that the bendability has a correlation with the Taylor factor in Al-Mg-Si and Cu-Ni-Si alloy sheets. This paper has proposed an analytical method for predicting in-plane anisotropy of bendability in polycrystalline face-centered cubic metal sheets by using the mean value of Taylor factors for all grains calculated from an orientation distribution function. The calculation was performed on the assumption that a strain condition at the convex surface during bending deformation is close to plane strain tension. Using various ideal orientations with Gaussian distribution and various real textures of annealed aluminum or copper alloys, the normalized Taylor factor, which was defined as a ratio of the mean Taylor factor for a textured material to that for a randomly oriented one, was compared with some known experimental data on bendability at directions of 0° and 90° to the rolling direction. The results clearly showed that bendability was better at the bending direction with a lower normalized Taylor factor. Since the formation of shear bands at the sheet surface causes deterioration of bendability, the present analytical method based on the normalized Taylor factor will have the advantage of giving us a prediction of bendability at arbitrary directions in a sheet, if textures of metal sheets are measured on the surface without polishing by means of X-ray diffraction. [doi:10.2320/matertrans.ME201405]
(Received August 21, 2014; Accepted October 27, 2014; Published December 12, 2014)
Keywords: aluminum alloy, copper alloy, sheet material, bendability, orientation distribution function, normalized Taylor factor
1. Introduction
In recent years, the connecter for electronic devices has been miniaturized, especially in portable electronic devices such as notebook computers and cellular phones. Thereby excellent bendability is strongly required besides high strength for thin copper alloy sheets with good electric conductivity. However, it is generally difficult to satisfy both strength and bendability. In the meantime, aluminum alloy sheets have been employed for automotive body panels to realize the weight reduction. Since hemming which corre-sponds to 180°-bending is necessary for outer panels of hoods, trunk lids and doors, excellent bendability is required for aluminum alloy sheets employed for the outer panels. Moreover, in the portable electronic devices mentioned above, the bent parts with smaller radius of curvature are required in order to miniaturize them or to provide them with sharp edges. The improvement in bendability is of great importance for copper or aluminum alloy sheets.
It is well-known that bendability of the face-centered cubic (FCC) metal sheets greatly depends on crystallographic orientation.13) Recently, Takedaet al.1) revealed a negative correlation between bendability and the Taylor factor on a plane strain condition on the basis of the experimental results of Al-Mg-Si alloy single crystals with different orientations, though there was considerable scatter in experimental data. In Cu-Ni-Si alloys as well as in Al-Mg-Si alloys, the influence of crystallographic orientation on bendability was examined for polycrystals with various textures2)and for extremely coarse-grained polycrystals (quasi-single crystals) with various preferred orientations,3) and then their experimental results were analyzed by using the average Taylor factor and the modified Schmid factor, respectively. These analyzed results showed that both factors had a relatively good correlation with bendability of the sheet samples. In particular, the average
Taylor factor estimated from electron back-scatter diffraction (EBSD) measurements of polycrystalline materials was positively correlated with the bendability defined by the ratio of minimum bend radius to sheet thickness.2)However, the prediction of bendability of practical metal sheets using the average Taylor factor obtained from EBSD includes some problems such that the surface polishing with almost no strain is required for EBSD measurement and the measurable depth in the RD-TD sample is very small compared with that of X-ray diffraction (XRD), as shown in Table 1. Ikawa et al. concluded that bendability of a sheet material was strongly affected by only a tenth thickness in depth from the surface on the tensile strain side.4)Therefore, texture measurement on the surface layer where cracks may form during bending is very important for predicting bendability. This means that XRD is more favorable for the texture measurement than EBSD in view of sample preparation and statistical reliability (Table 1). Since industrial sheet products generally possess even and good surfaces as compared to laboratory samples, the surface texture can be easily measured without polishing by XRD for checking the bendability of the industrial products. In addition, troublesome treatment is required in predicting the bendability at various in-plane directions of a sheet from EBSD data, because the coordinate transformation from EBSD data at the original direction into those at an arbitrary bending direction must be made except for the rolling and transverse directions. Another method is desirable for predicting the in-plane anisotropy of bendability.
In general, the property of a polycrystalline material can be represented by the mean value for the property of each oriented grain.5) The texture of a polycrystalline material is quantitatively expressed by an orientation distribution function which denotes the fraction of each orientation.5)In the present paper, the Taylor factor is used as an index of bendability.
2. Analytical and Experimental Methods
2.1 Calculation of Taylor factor in bending deformation It is known that crack initiation during bending deforma-tion is related to the formadeforma-tion of shear bands2,6,7) and crystallographic texture strongly affects the shear bands formation.1,2,8) As mentioned above, the Taylor factor in a plane strain tension, which consists of outer tensile strain in bending and compressive strain in the thickness direction, is correlated with bendability of the sheet metals. Therefore we evaluate the bendability on the basis of the Taylor factor in the present study. The critical resolved shear stress (CRSS) is identical in FCC metals with only{111}©110ªglide systems at room temperature. Assuming that as the Taylor factor lowers, i.e. as the total amount of glides becomes smaller, it is more difficult for shear bands to form, the average Taylor factor of a polycrystalline FCC metal sheet was calculated from the orientation distribution function (ODF) by using a method described by Bunge5,9) and then utilized for predicting its bendability. The computer programs for ODF analysis10)and for ther-value estimation11)developed by the present author were applied to the calculation of the average Taylor factor. The calculation method by Bunge9) is briefly explained below.
Tensile deformation is first taken into account for this calculation, since the bendability is related to crack initiation on the sheet surface where the maximum tensile stress is imposed. In tensile deformation of a sheet specimen, the longitudinal, transverse and thickness directions are defined as the X-,Y- andZ-axes, respectively. Here we assume that the volume element with unit length is macroscopically elongated by d¾ in theX-direction, and is contracted byqd¾ and (1-q)d¾ in the Y- and Z-directions, respectively, that is, the condition of constant volume, d¾x+d¾y+d¾z=0 is satisfied under macroscopically uniform plastic deformation. In this case, the strain tensorESis expressed by the following equation.
ES¼d¾
1 0 0
0 q 0
0 0 ð1qÞ
2 6 4
3 7
5 ð1Þ
Thus the q-value represents a ratio of transverse to longitudinal strain (0¯q¯1). In the case of bending deformation, theq-value corresponds to a ratio of compres-sive strain along the bending axis to tensile strain along the bending direction on the side subjected to tensile stress. On condition that the section perpendicular to the bending axis is in a plain strain condition, theq-value equals zero. In fact the q-value is considered to be a little larger than zero on the surface subjected to the maximum tensile stress when the width of a bending specimen is relatively small.
Now we assume that individual grains are subjected to homogeneous strain identical with macroscopic tensile strain to satisfy the continuity in strain at grain boundaries. In order to view the strain condition of eq. (1) in the crystal coordinate system,XC=[100],YC=[010] andZC=[001], the coordinate transformation is performed from the bending specimen coordinate system X-Y-Z. There are five inde-pendent strain components in the coordinate-transformed strain tensor in view of both the symmetry of strain and the condition of constant volume. Thus at least five active slip systems are necessary for plastic deformation in each grain. The principle of the minimum work is here introduced to determine the combination offive active slip systems. If the CRSS of{111}©110ªglide systems is¸cand the shear strain of a given glide system is represented by d£n, then the plastic work by slip deformation is expressed by the following equation.
dW¼¸cX
5
n¼1
jd£nj ð2Þ
Hence the combination of glide systems in which dW is minimum, i.e. the sum of absolute value of shear strain is minimum, is selected asfive active slip systems. In the case of tensile deformation, the plastic work by external stress is expressed by ··d¾ and is equal to the right side of eq. (2). Thus the Taylor factor M, which is a function of crystallo-graphic orientation g and strain ratio q, is given by the following equation.
M¼¸c· ¼min X5 n¼1
jd£nj !
[image:2.595.47.549.94.262.2]d¾ ð3Þ
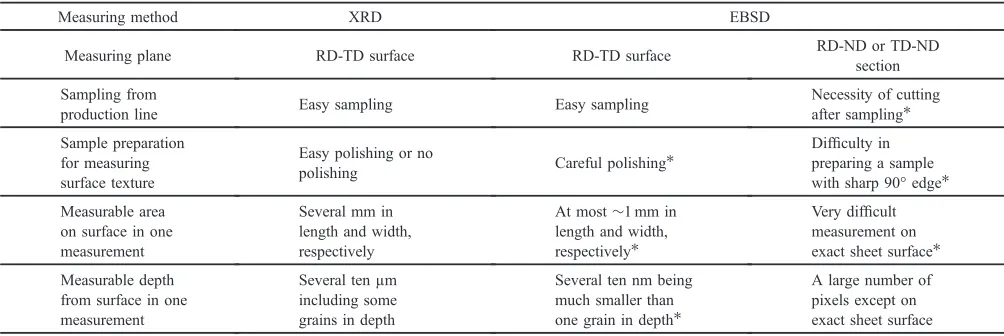
Table 1 Comparison between X-ray diffraction (XRD) and electron backscatter diffraction (EBSD) methods for measurement of surface texture used for predicting bendability of a sheet material. The symbol*denotes a disadvantage in texture measurement on sheet surface.
Measuring method XRD EBSD
Measuring plane RD-TD surface RD-TD surface RD-ND or TD-ND
section
Sampling from
production line Easy sampling Easy sampling
Necessity of cutting after sampling*
Sample preparation for measuring surface texture
Easy polishing or no
polishing Careful polishing*
Difficulty in preparing a sample with sharp 90° edge*
Measurable area on surface in one measurement
Several mm in length and width, respectively
At most³1 mm in length and width, respectively*
Very difficult measurement on exact sheet surface*
Measurable depth from surface in one measurement
Several ten µm including some grains in depth
Several ten nm being much smaller than one grain in depth*
Calculating the Taylor factorMðq; gÞat a givenq-value, the relation between g and Mðq; gÞ is determined. In order to simplify subsequent calculations, we calculate an approx-imation of Mðq; gÞ in the form of series-expansion by generalized spherical harmonics Tl®¯ðgÞ5) which take crystal and sample symmetry into account.
Mðq; gÞ ¼X
L
l¼0 XMðlÞ
®¼1 XNðlÞ
¯¼1
m®¯
l ðqÞTl®¯ðgÞ ð4Þ
[image:3.595.75.263.68.319.2]In this manner, the coefficientsm®¯l ðqÞcan be determined by calculatingMðq; gÞat an appropriate interval from q=0 to q=1. The Taylor factor in plane strain deformationMð0; gÞ is represented as a function of Euler angles (¤1,),¤2) in Fig. 1.
In the meantime, the texture in a polycrystalline metal can be quantitatively expressed using an orientation distribution function f(g)5)shown in the following equation,
fðgÞ ¼X
L
l¼0 XMðlÞ
®¼1 XNðlÞ
¯¼1
C®¯l Tl®¯ðgÞ; ð5Þ
where the coefficientsC®¯l can be calculated from some pole figures on different crystal planes measured by X-ray diffraction. When the tensile-strain direction is identical with the rolling direction, the mean value of the Taylor factor as the whole of specimen, namely the average Taylor factor,
MðqÞ, is obtained by taking the weighted average ofMðq; gÞ with f(g) in the whole orientation space.
MðqÞ ¼
I
Mðq; gÞfðgÞdg ð6Þ
Using the coefficientsm®¯l ðqÞandC®¯l in eq. (4) and eq. (5) respectively, eq. (6) can also be expressed as the following equation.
MðqÞ ¼X
L
l¼0 XMðlÞ
®¼1 XNðlÞ
¯¼1
m®¯
l ðqÞC®¯l
2lþ1 ð7Þ
If we use the bending specimen cut along an arbitrary direction in a sheet, then the average Taylor factor in the specific direction is given by the following equation using the angleªto the rolling direction.
Mðq;ªÞ ¼X
L
l¼0 X MðlÞ
®¼1 XNðlÞ
¯¼1
m®¯l ðqÞC®¯l cos 2ð¯1Þª
2lþ1 ð8Þ
Therefore, the curve Mðq;ªÞ as a function of ª under a constant q-value represents an in-plane variation of the average Taylor factor in a polycrystalline sheet material.
On the tensile stress side in bending, theq-value may have a slightly higher value than zero in a plane strain condition, as mentioned above. Thus the average Taylor factorsMðq;ªÞon the tensile stress side are calculated as a function of ª at constant values of q=0, 0.1 and 0.2 in order to take into account the effect of compressive strain along the bending axis on the average Taylor factor. It is necessary for us to quantitatively relate the average Taylor factor to bendability. Since the magnitude of the Taylor factor depends on the q-value, we further calculate the average Taylor factor for a textured sheet materialMðq;ªÞdivided by the Taylor factor for a randomly oriented sample (i.e. by the coefficient of the first term in eq. (4))m110 ðqÞ, which is named the normalized Taylor factor (theMnvalue).
Mnðq;ªÞ ¼Mm11ðq;ªÞ
0 ðqÞ ð9Þ
Here the coefficient m110 ðqÞ is 3.3243 at q=0, 3.2117 at q=0.1 and 3.1435 at q=0.2, and the Mn value of unity corresponds to bendability of a randomly oriented sample.
Computer software for calculating Mnðq;ªÞfrom a given ODF, which runs on Microsoft Windows, has been completed by modifying a program of ther-value calculation.11)
2.2 Prediction of bendability for sheet metals with ideal orientations
A single texture component, that is a family of preferred orientations consisting of crystallographically equivalent variants, was expressed by the ODF with Gaussian spread5) of 20°, which was artificially generated for a representative preferred orientation in rolling or recrystallization texture of FCC metals. The width of Gaussian spread was set in view of orientation density comparable to that of a real texture. It should be noted that one texture component does not mean a strict orientation (hkl)[uvw] of a single crystal but all the equivalent orientations{hkl}©uvwªof a polycrystal in terms of orthotropic sample symmetry of a rolled sheet. The normalized Taylor factor Mnðq;ªÞ of a given texture component {hkl}©uvwª was calculated as a function of ª under a fixed q-value from the coefficients C®¯l of the corresponding ODF according to eq. (8) and eq. (9).
2.3 Prediction of bendability for practical polycrystal-line metals
An ODF on the surface layer of a polycrystalline FCC metal sheet was calculated from four incomplete polefigures measured by XRD. Texture measurement by XRD on the Fig. 1 Orientation dependence of Taylor factor in plane strain deformation
RD-TD surface is more suitable for predicting bendability than that by EBSD on the RD-TD surface, because the penetration depth of X-rays is an order of ten micrometers which corresponds to several grains, as compared with an order of ten nanometers for an electron beam (Table 1). In addition a reliable texture measurement by EBSD on the RD-ND or TD-ND section is difficult in terms of both the preparation of a sample with the sharp 90° edge and the statistical reliability based on the number of grains. In other words, since crack initiation during bending deformation probably occurs at shear bands2,6,7) developed in a range of several grains from the sheet surface,2,4)the texture measure-ment on the sheet surface by EBSD is more unsuitable than that by XRD in addition to the difficulty of preparing an EBSD specimen with good surface condition.
A 1050 commercially pure aluminum sheet with O temper, a 5182 aluminum alloy sheet with O temper, a 6022 aluminum alloy sheet with T4 temper, and a Cu-2.5 mass% Ni-0.6 mass% Si alloy sheet solution-treated at 1173 K for 30 s after 91%cold rolling were used as examples of practical polycrystalline metals. Four incomplete pole figures of
{111}, {100}, {110} and {311} were measured using CuK¡ radiation in a tilt angle range of 0° to 75° on the sheet surface after lightly removing oxides by chemical etching. The ODFs of their metal sheets were determined from these incomplete pole figures by the ‘Standard ODF’ software12) using the iterative series-expansion method10) developed by the author. The normalized Taylor factor Mnðq;ªÞ of the metal sheet was finally calculated as a function ofªunder afixedq-value, using the coefficientsC®¯l of the real ODF obtained from the X-ray pole figures according to eq. (8) and eq. (9).
3. Results and Discussion
3.1 Predicted bendability for sheet metals with various ideal orientations
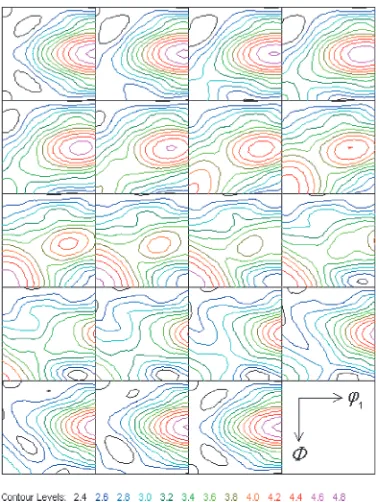
Figure 2(a) shows an artificial ODF with orthotropic sample symmetry for Cube orientation {001}©100ª with Gaussian distribution. This orientation family perfectly
corresponds to one another in all the pole figures and its multiplicity is 4. A family of Cube orientation, therefore, consists only of one variant. The normalized Taylor factors of Cube orientation calculated at differentq-values of 0, 0.1 and 0.2 are shown in Fig. 2(b). The Mn value indicates a very low value not more than 0.96 at all angles to the rolling directions, where the angleªmeans the bending direction that is subjected to tensile or compressive strain during bending and is perpendicular to the bending axis. Bendability of Cube orientation can, therefore, be estimated to be quite good, though the in-plane anisotropy of the bendability consid-erably varies depending on the q-value. According to the experimental results by Takeda et al. on Al-Mg-Si alloy single crystals with various orientations,1) Cube orientation
{001}©100ª located at ª=0° showed somewhat better bendability than Rotated-cube orientation{001}©110ªlocated atª=45° in Fig. 2(b). Consequently the strain condition of q²0.1 is considered to be more appropriate for bendability prediction of {001}©uv0ª orientation than plane strain condition ofq=0. This suggests that compressive strain in width will be generated on the tension side. It should be noted that bending deformation may not be in full plane strain condition. The condition of q=0.1 can be recom-mended for the present prediction.
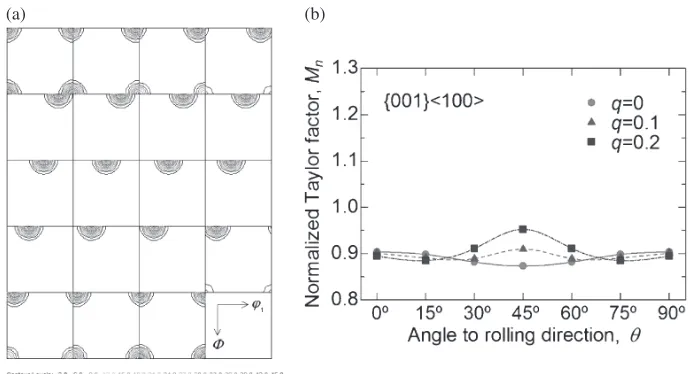
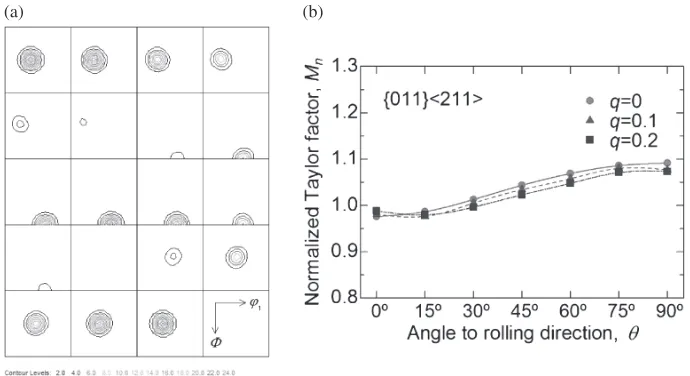
The calculated result of Goss orientation{011}©100ªwith the multiplicity of 4 is shown in Fig. 3. The maximum orientation density of the ODF is more than 45, which is the same density as Cube orientation{001}©100ª. TheMnvalue of Goss orientation is very low at the rolling direction of
ª=0°, but it increases rapidly when the angleªincreases to only 30°, showing a very high value of about 1.2 at the transverse direction of ª=90°. This tendency is in good agreement with the calculated result by Kuroda et al. who predicted that shear bands were apt to be easily formed at
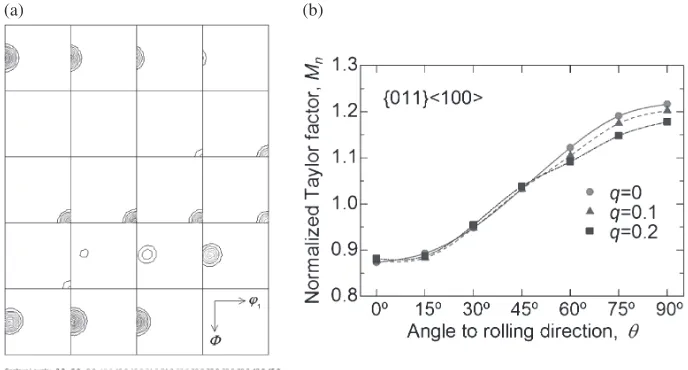
ª=90° in plane strain tension of Goss orientation.8) An intermediate orientation between Cube and Goss orientations, RD-rotated cube orientation {012}©100ª, which consists of two variants symmetrical to the RD axis in polefigures (i.e. the multiplicity of 2) and shows the maximum orientation density of a half value as compared with Cube orientation of
(a) (b)
[image:4.595.125.470.69.256.2]one variant (Fig. 4(a)), also has theMnvalue less than 0.9 in the vicinity of the rolling direction of ª=0° (Fig. 4(b)), corresponding well to the experimental results showing good bendability at ª=0° of this orientation.1)
S orientation{123}©634ª, which consists of four variants symmetrical to the RD and TD axes in polefigures (i.e. the multiplicity of 1) and shows the maximum orientation density of a quarter value as compared with Cube orientation of one variant (Fig. 5(a)), has isotropicMnvalues being higher than 1.0 (Fig. 5(b)). R orientation{124}©211ªclose to S orientation also shows isotropicMnvalues of nearly 1.0 which are a little lower than those of S orientation. Figure 6 shows the ODF and the in-plane variations of the Mn value for Copper orientation{112}©111ªwith two variants symmetrical to the TD axis in polefigures. This orientation indicates a relatively lowMnvalue atª=90° as compared with that atª=0°, so that the bendability at ª=90° would be not as poor as anticipated, which is in agreement with the previous results.1,3) Figure 7 shows the ODF and the in-plane variations of the Mnvalue for Brass orientation{011}©211ªwith two variants symmetrical to the RD or TD axis in pole figures. In this
orientation, theMnvalue becomes lower than 1.0 atª=0°, so that the bendability at ª=0° would be not as poor as anticipated, which is in agreement with the previous results.3) As shown in Fig. 8, BR orientation{236}©385ªas a main component of the alloy-type recrystallization texture and the near orientation {113}©121ª have a fairly low Mn value of about 0.95 at ª=90°. The {113}©121ª orientation can, therefore, exhibit good bendability atª=90°.3)
There is a good correlation between the Mn value of an ideal orientation and the bendability of a practical metal sheet, as mentioned above. The results obtained in various ideal orientations imply that Mn<1.0 is a threshold condition of realizing good bendability. The experimental results of single crystals by Takeda et al. revealed that the ND-rotated S orientations had significantly different bend-ability depending on whether the rotation angle is 45° or 135°.1)This fact is different from isotropic characteristics of ND-rotated S orientations inferred from S orientation which showed almost the sameMnvalues irrespective of the angleª, because the results of single crystals do not involve an effect of other variants on bendability. For example, it is necessary
(a) (b)
Fig. 3 (a) Orientation distribution function of ideal orientation{011}©100ªwith Gaussian distribution and (b) in-plane variations of normalized Taylor factor at strain conditionqcalculated from it.
(a) (b)
[image:5.595.126.470.71.256.2] [image:5.595.127.470.305.490.2](a) (b)
Fig. 5 (a) Orientation distribution function of ideal orientation{123}©634ªwith Gaussian distribution and (b) in-plane variations of normalized Taylor factor at strain conditionqcalculated from it.
(a) (b)
Fig. 6 (a) Orientation distribution function of ideal orientation{112}©111ªwith Gaussian distribution and (b) in-plane variations of normalized Taylor factor at strain conditionqcalculated from it.
(a) (b)
[image:6.595.126.471.68.257.2] [image:6.595.127.471.324.510.2] [image:6.595.126.471.573.761.2]for S orientation {123}©634ª to take four variants into account in prediction of bendability. Accordingly there may be some cases where the Mn value calculated from an ideal orientation family with more than one variant does not correspond to bendability of a single crystal of one variant.
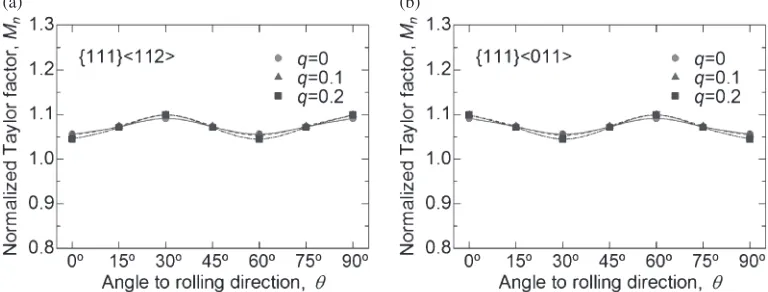
As shown in Fig. 9, {111}©uvwª orientations such as
{111}©112ª and {111}©011ª having excellent r-values and deep drawability have higherMnvalues than 1.0 at all angles of ª. This suggests that good bendability is generally incompatible with good deep drawability in FCC metal sheets. According to the experimental results of single crystals by Takeda et al., {111}©112ª and {111}©011ª orientations showed relatively good and poor bendability at
ª=0° parallel to the rolling direction, respectively.1)TheM n value at ª=0° of the {111}©112ª orientation is lower than that of the {111}©011ª orientation, but exceeds a threshold value of Mn=1.0. An absence of another variant of
{111}©112ª orientation might result in such a difference between theMn value of an ideal orientation family and the bendability of a single crystal.
3.2 Predicted bendability for practical polycrystalline metals
In-plane anisotropy of bendability was predicted using the Mnvalue calculated from a practical ODF of cold rolled and annealed aluminum or copper alloy sheet. Figure 10 shows an ODF on the surface layer of a 1050 aluminum sheet with
O temper and the Mn values calculated from the ODF. A sharp Cube texture with a spread toward the RD-rotated cube orientation (which exists on the line of ) at¤1=0° in the
¤2=0° section) has fairly low Mn values similar to Cube orientation of Fig. 2 and shows a slight increase of the Mn value with increasing ª-angle resulting from a weak RD-rotated cube orientation.
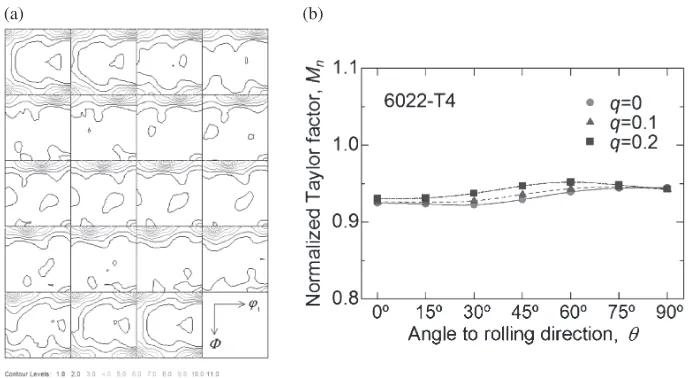
The ODFs and the in-plane variations of theMn value on the surface layers of a 5182 aluminum alloy sheet with O temper and a 6022 aluminum alloy sheet with T4 temper are shown in Figs. 11 and 12, respectively. The 5182 alloy has a weak ND-rotated cube texture of {001}©310ª as the main component, and consequently shows moderately low and relatively isotropicMnvalues (Mn<1.0 at all directions). In contrast, the 6022 alloy has a moderately strong Cube texture of {001}©100ª as the main component, though it shows large spreads toward the ND-rotated cube orientation of {001}©310ª and the RD-rotated cube orientation of
{011}©100ª. As a result, the Mn values are relatively low and isotropic. A tendency to show a slightly higher Mn value at ª=90° than at ª=0° would come from marked anisotropy of RD-rotated cube orientations such as
{012}©100ª and {011}©100ª in spite of weak components. Since orientation density of {001}©uv0ª orientations is higher in the 6022 alloy than in the 5182 alloy, the Mn values of the 6022 alloy are, on the whole, lower than those of the 5182 alloy.
(a) (b)
Fig. 8 In-plane variations of normalized Taylor factor at strain conditionqcalculated from orientation distribution functions of ideal orientations (a){236}©385ªand (b){113}©121ªwith Gaussian distribution.
(a) (b)
[image:7.595.106.494.73.222.2] [image:7.595.106.490.268.414.2](a) (b)
Fig. 10 (a) Orientation distribution function obtained from X-ray polefigures on the sheet surface of 1050 aluminum with O temper and (b) in-plane variations of normalized Taylor factor at strain conditionqcalculated from it.
[image:8.595.127.470.321.504.2](a) (b)
Fig. 11 (a) Orientation distribution function obtained from X-ray polefigures on the sheet surface of 5182 aluminum alloy with O temper and (b) in-plane variations of normalized Taylor factor at strain conditionqcalculated from it.
(a) (b)
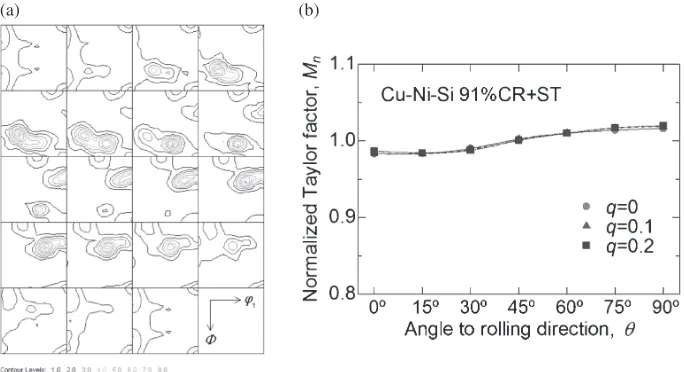
[image:8.595.126.471.572.761.2]The ODF and the in-plane variations of the Mn value on the surface layer of a cold rolled and solution-treated Cu-Ni-Si alloy sheet are shown in Fig. 13. A main component of this texture is R orientation{124}©211ªclose to S orientation
{123}©634ª. The RD-rotated cube orientation {012}©100ª with a spread toward Cube orientation at ¤1=0° in the
¤2=0° section is also observed as the second component. Although there is a slight increase in the Mn value with increasing ª-angle resulting from the RD-rotated cube orientation, the Mn values are relatively isotropic and approximately 1.0 for allq-values. In order to vastly improve bendability of this alloy sheet, it will be necessary to increase Cube orientation having much lowerMn values.
As mentioned above, the Mn value at q=0.1 will correspond well to bendability of sheet metals. However, theMnvalues calculated for various textured materials should be discussed within the sheet metals with nearly the same composition and a similar processing history, because the ductility depends on composition and microstructure. In other words, only the effect of crystallographic texture on the bendability can be extracted using the present analytical method. In a comparison between different metals and alloys and/or in that between quite different processing conditions, additional information on ductility is required. It is desirable that the present analytical method is modified in the future so as to take ductility into account. In addition, the comparison of theMnvalue with the experimentally evaluated bendability for polycrystalline metal sheets is important work to verify the correspondence between them.
The prediction of bendability from the ODF obtained by X-ray diffraction on the surface layer of sheet metals has an advantage over that by EBSD in terms of the depth of penetration into the metal and the easiness of sample preparation for texture measurement. The present method that can predict bendability without special surface polishing is very convenient for examining manufactured sheet metals.
4. Conclusion
The normalized Taylor factor of FCC metal sheets with
various textures was calculated as an index of bendability from an ODF on the surface layer measured by X-ray diffraction. The validity of the calculated results was discussed by comparing the normalized Taylor factors with experimental results of the previous literature. The main conclusions obtained in the present study are as follows:
(1) On the basis of the normalized Taylor factor, the bendability of polycrystalline sheet metals can be adequately predicted as a function of the bending direction from artificial ideal orientations and exper-imentally measured textures.
(2) It is also possible to analyze bendability of sheet metals in consideration of compressive strain (q-value) along the bending axis on the tension side. A strain condition of q=0.1 rather than plane strain tension of q=0 seems to be more suitable for prediction of the bendability.
(3) By using X-ray diffraction, textures can be measured without special surface polishing. This enables us to easily evaluate bendability on the surface layer from which the formation of shear bands occurs.
REFERENCES
1) H. Takeda, A. Hibino and K. Takata:Mater. Trans.51(2010) 614619.
2) H. Kaneko and T. Eguchi:Mater. Trans.53(2012) 18471851.
3) W. Gao, T. Aoyama, H. Suda, A. Sugawara, Y. Tanaka, T. Omori and K. Ishida: J. JRICu50(2011) 215220.
4) S. Ikawa, M. Asano, M. Kuroda and K. Yoshida:J. Japan Inst. Light Metals61(2011) 5359.
5) H. J. Bunge: Texture Analysis in Materials Science, (Butterworths, London, 1982).
6) A. Hibino, T. Muramatsu, M. Saga and K. Takata:J. Japan Inst. Light Metals53(2003) 534541.
7) H. Kaneko, K. Hirose, T. Eguchi and N. Tanaka: J. JRICu48(2009) 6165.
8) M. Kuroda and V. Tvergaard:Int. J. Plasticity23(2007) 244272.
9) H. J. Bunge:Kristall und Technik5(1970) 145175.
10) H. Inoue and N. Inakazu: J. Japan Inst. Metals58(1994) 892898. 11) H. Inoue and N. Inakazu:J. Japan Inst. Light Metals44(1994) 97103.
12) H. Inoue:Materia Japan40(2001) 589591.
[image:9.595.128.470.71.257.2](a) (b)