Can developmentally disabled children’s cognitive abilities be assessed using eye tracking? A methodological validation study
Jasper Grothues University of Twente
Abstract
Examining specific cognitive abilities as conceptual surrogates of overall cognitive
development is a common procedure in psychology. The present study focuses on assessing developmentally disabled children’s level of understanding of object permanence and
categorization with eye tracking methods. Additionally to developmentally disabled children were participants from the general population assessed in a separate experiment, to act as indicators of assessment tasks’ construct validity. Participants were assessed on three different
categorization- and two different object permanence tasks. Participants were hypothesized to look longer or shorter at areas of interest in experimental conditions during a certain
timeframe, compared to control conditions. A single case randomization model analyses could not detect a significant influence of condition on gaze duration. Visual analyses of the data yielded some of the hypothesized results. Shortcomings of the study, reasons for the lack of hypothesized results and implications for future research are discussed.
Can developmentally disabled children’s cognitive abilities be assessed using eye tracking? A methodological validation study
Assessing an individual’s level of cognitive development has been done in a myriad of
ways, employing different forms of assessment, to assess different populations. However they all share one common characteristic, they are based upon the notion that an individual’s performance on a task which is thought to test a specific cognitive ability can be regarded as an estimate for an individual’s overall level of cognitive development.
The present study seeks to follow this paradigm by assessing developmentally
disabled children’s level of understanding of object permanence and categorization using eye tracking. The children’s performance on these tasks is hypothesized to represent an
individual’s level of memory development, which in turn is interpreted as representing an individual’s overall level of cognitive development. The importance of memory for the
development of an individual, as well as its link to categorization and object permanence are going to be elaborated in the following sections.
The importance of memory
Memory is what gives meaning to the world. Trying to imagine a world without memory is to imagine a world without meaning. An individual without memory would technically still perceive the world. However would this perception be limited to impressions, without the individual being able to infer about the existence of the objects and phenomena that produced them. All instances of this individual’s perceptual universe would act
The individual could still interact with the world. However would this interaction be limited to genetically inherited instincts and reflexes. The individual might avert their eyes from the campfire, but only because of a millennia old reflex. The individual would never be able to ascribe the uncomfortable sensation of deteriorating eyesight to the glowing lights of the campfire. Instead would the individual be trapped in a state of constant instinctive reaction, without the possibility to act on their own accord.
This example was meant to describe the visceral importance of memory to an
individual’s experience of a coherent environment. There is evidence that memory is essential to cognitive abilities which happen at even earlier stages of an individual’s interpretation of their environment, such as the ability to perceive features about ones environment at all (Lee, 2002). The present example however demonstrates not only the importance of memory, but also its binomial structure. Memory is made up of two different systems, which main
difference is the way in which they store information, which in turn determines the temporal distribution of the information they store (Baddeley, 2003).
The ‘workbench’ described in the example is the working memory, the ‘faster’ of the
two memory systems. It stores information by activity based representation, meaning that information is ‘rehearsed’ constantly. This constant ‘rehearsal’ of information allows for its
manipulation. However, this limits the duration and quantity of the information that can be stored at one time, as more information means less frequent refreshing of individual points of data (Baddeley, 2003).
cycling of activation to remember the information, allowing for vastly more information to be stored for longer durations (Anderson, 1983).
Long-term memory
As illustrated by the example at the start of this introduction is LTM essential for experiencing and acting in a meaningful world. It allows one to make inferences about phenomena, objects and their relations, leading to the ability to learn, which as the example demonstrated is crucial to an individual’s experience of the world. However inferences made about stored information need to be assigned to the information they relate to, to be of any value. This organization of information in LTM is what allows an individual to effectively perceive, process and learn from their environment (Markman & Dietrich, 2000).
Categorization. The process responsible for the effective organization of information is categorization (Bjorklund, 1987). It allows for individual entities in memory to represent a member of a category, an exemplar. Certain core characteristics of multiple exemplars can be extracted and used to infer a rule for members of a category. This extraction of properties from exemplars also allows for the construction of prototypes for a category, a representation of the hypothetically most common member of a category (Allen & Brooks, 1991). Further does it allow for the construction of schema for a category, which indicate relations between- and functions of category members (Barsalou, 1992).
These mechanisms taken together allow for inferences to be made about the function and meanings of objects and phenomena encountered in the world. A novel object or
phenomenon can be related to a category, or several, with which’s members it shares some
characteristics. This allows for the inference of a function or meaning about the object or phenomenon, based on what the category members’ function and meaning are. The extent to
which these functions and meanings are attributed to the novel object or phenomenon depends on the extent to which it is a prototypical member of the category. In other words,
above the world. However categorization obviously requires information in order to make inferences. Categorization and LTM are thus co-dependent, in that taken by themselves they provide very little value.
Support for categorization being dependent upon LTM from a young age comes from Eimas, Quinn and Cowan (1994). They found that basic categorization by perceptual
attributes is driven by experience. In their study they employed a sophisticated familiarization process, effectively training three to four months old infants what each category entailed. The infants were subsequently able to separate between the categories.
Quinn and Eimas (1998) found that prior knowledge has an influence on infant’s performance on categorization tasks, even when the categories are only defined within the task itself, which should eliminate the influence of prior knowledge. They found that prior knowledge still has an indirect influence on infant's performance were none should be, indicating an influence of LTM development on categorization task performance.
Quinn (2004) found a similar influence of pre-existing knowledge on the performance of participants on categorization tasks, although it supposedly did not have an influence in his study. This holds especially true when concrete, real world stimuli are used, such as the distinction between different species of animals.
A way to somewhat ‘isolate’ a participant’s ability to categorize, to a certain extent independent of pre-existing knowledge, would be to study implicit categorization, which uses familiarization but does so in a passive way. The categories are not taught or otherwise indicated, rather is the inference of categories existing at all in the material, left to the participant. In other words, the categories are not based on pre-learned knowledge like categories of animals, but instead are only indicated by relations demonstrated during the familiarization trials.
researchers found children to be able to categorize by perceptual attributes by two months, by function by six months and by multiple attributes by 18 months of age (Gopnik & Meltzoff, 1987; Mandler, 2004; Rakison & Oakes, 2003; Wasserman & Rovee-Collier, 2001). Since categorization seems to develop at different times for different levels of abstraction, does it also seem reasonable to assess it at different levels to arrive at a more accurate estimation of an individual’s ability to categorize.
Based on the findings presented will the present study employ three different, implicit categorization tasks. These will assess participant’s ability to categorize on different levels of abstraction, through categorizing based on color, function or color and function
simultaneously. Working memory
Working memory describes a function which allows an individual to temporarily store information, acting as an interface between LTM, perception and cognitive processes;
allowing the latter to perform manipulations on the information (Baddeley, 2003). In the example stated at the beginning of this section, would this allow the individual to infer that a cracking noise and a highly salient visual stimuli share a common source, a fire.
How many distinct points of information an individual can hold in their working memory (i.e. their working memory capacity) is often seen as the sole determinant of an individual’s working memory performance. However, one could argue that the level of
abstraction of the information stored and the manipulations performed on it need to be taken into account to arrive at a more accurate estimation of working memory performance
(Schneider & Pressley, 2013). An individual being able to store the color of three different objects in working memory is conceptually not on the same level of sophistication as storing an object’s color, location and state in working memory, although both of them may require
does represent an important factor in the overall development of an individual’s working
memory.
Object permanence. A concept that not only requires a certain working memory capacity to be understood, but a certain level of working memory information encoding sophistication as well is object permanence. Object permanence describes the abstract notion of understanding that one’s environment is continuously existing, whether it is in one’s
immediate perception or not (Piaget, 1955).
Object permanence is of critical importance to the development of an individual (Corrigan, 1978). This becomes apparent when imagining an individual who does not possess an understanding of object permanence. Such an individual could only ever interact or plan for a potential interaction with objects in their current perception. The object would cease to exist as soon as it would leave the individual’s immediate perception. Even basic human
functions require the individual to be aware of object permanence. For example would an individual without it have a heavily impaired visual perception, as perception functions partly because of top-down cognition (Wade, 1998). An individual without an understanding of object permanence could not effectively follow a temporarily occluded object, as the
individual would be surprised by the reappearance of the object (Bertenthal, Longo & Kenny, 2007).
permanence may indeed be an instance of advances in working memory encoding sophistication.
Both Moore and Meltzoff’s (2008) and Ruffman, Slade and Redman’s (2005) findings
point towards the fact that infants possess a certain understanding of object permanence at a young age. However their findings also show that this understanding extends and deepens over time. This suggests that object permanence can be understood at different levels of sophistication and abstraction, which in turn means that object permanence as a holistic concept is made up of several stages.
Rufffman, Slade and Redman (2005) found that four month old infants were able to remember an object’s location and anticipate its reappearance two to eight seconds after
hiding, but were unable to do so eight to 14 seconds after hiding. This suggests that the amount of time between an object leaving the immediate perception and acting based on the object’s hypothesized location is an important determinant with regards to the success rate of
performing an action involving the hidden object.
Based on the presented findings will the present study employ two different object permanence tasks. The first task will consist of temporarily hiding a vehicle behind a wall, representing a short duration, low level of abstraction occlusion. The second task will hide an object in two different containers and then manipulate the object before its re-appearance, representing a longer duration, higher level of abstraction occlusion.
Link between object permanence and categorization
Gopnik and Meltzoff (1987) found that: “Children apparently begin to sort objects into spatially distinct groups at about the same time that they begin to solve complex object-permanence tasks [...].” They infer this relation to emerge because both object permanence
and categorization involve knowledge about objects. An object in itself can be regarded as an artifact of memory, as an object combines stored information into a coherent frame. For example a blue beach ball being comprised of the color blue, the geometrical figure sphere, the material it is made of and so on. In other words, advancement in knowledge about objects leads to heightened performance in both categorization and object permanence tasks, which indicates an indirect correlation between object permanence and categorization, via memory.
A correlation between the level of understanding of categorization and object
permanence because of advances in memory development, can be regarded as an indicator of criterion validity. The reason for this being that the purpose of the study was to explore the possibility of estimating cognitive development by the quantification of one of its surrogates, memory development, into categorization and object permanence tasks. A correlation in performance between these two would in turn indicate that these might be valid
quantifications of memory development. Choosing a context
The assessment of cognitive development through object permanence and
categorization represent a novel approach. It made intuitive sense to apply it to a target group that had proven to be cumbersome to assess with more traditional methods. In the present study this target group were psychologically- and physically disabled children.
An assessment method that requires very little from the participant in terms of physical capabilities is eye tracking. The participant does not need to speak, write, point or interact with his/her environment in any way but through ocular motion.
Judgement of object permanence and categorization by gaze pattern
The present study hypothesizes that a difference in eye gaze can be detected between control- and experimental trials, representing an understanding of either object permanence or categorization.
Moore and Meltzoff (2008) and Ruffman et al. (2005) employed said method where the participant was first familiarized with the object before commencing with the
experimental manipulation, the difference in behavior between the conditions being seen as a result of the experimental manipulation. Previous studies have raised concerns about the validity of this method (Bogartz, Shinskey & Schilling, 2000, 1997; Cashon & Cohen, 2000; Roder, Bushnell, & Sasseville, 2000; Schilling, 2000). They argued that the observed
difference in behavior is simply a function of perceptual novelty between the familiarity and experimental trials. Wang, Baillargeon, and Brueckner (2004) however found differences in behavior between groups of infants’ ability to represent hidden objects without the use of
familiarization trials. This suggests that the method of using differences in behavior between familiarization and experimental conditions as an indicator of cognitive processes can be seen as valid after all.
Participants directing their gaze to the area of highest importance with regards to the experimental manipulation holds true for the categorization tasks as well (Bertenthal, Longo & Kenny, 2007; Henderson, 2003). The areas relevant for the analyses of the categorization tasks are the areas to which the objects are being sorted into. This means that a difference in the relative fixation times of these areas between the conditions would indicate a certain level of understanding of the categories underlying the stimuli. In other words a longer or shorter fixation time of these areas indicate that the participant noticed a change in the condition were an object was ‘wrongly’ sorted, which requires an understanding of categorization to occur, as the perceptual differences between the conditions are minimal.
Aim and validity
The present study employed a proof of concept (POC) measurement with adults from the general population. This was done both as a pilot study and as a way to further ensure concept validity for the tasks employed. The pilot study cannot be regarded as acting as a control group, as the individuals assessed are not in the same age group as the individuals assessed in the actual observation. It does however support construct validity, as the concepts measured are hypothesized to be indicators of cognitive development, which means that they should be detectable in participants from the general population.
Participants from the POC and experimental group will be assessed in separate experiments. The first experiment will assess the POC group, the second experiment will assess the experimental group.
Participants from the experimental group are not uniformly expected to understand both object permanence and categorization. The interpretation of the data is conditional on the POC group’s performance. If the POC group’s data exhibits the hypothesized patterns, can construct validity of the measurements be assumed. In this case would the experimental group’s performance indicate the individual’s level of understanding of object permanence or categorization. If construct validity is not given, could the experimental group’s performance not be regarded as an expression of the level of understanding of object permanence or categorization, shifting the focus to an explorative one.
Experiment 1 Methods Participants
Five participants were selected using convenience sampling. Two were female and three male. All participants were German. Participants had an average age of 23.4 years (SD = 1.02). All participants were sampled from the general population, with no physical,
psychological or developmental handicaps. Apparatus
The measurements were conducted using rdgKompagne’s KOJO eye tracking system, using Tobii’s Gaze Viewer software. Participant’s seating position was set with the trackstatus function of Tobii’s Gaze Viewer software, which resulted in an approximate distance of 40
cm from the screen. All clips were created in Adobe Animate. Stimuli and Tasks
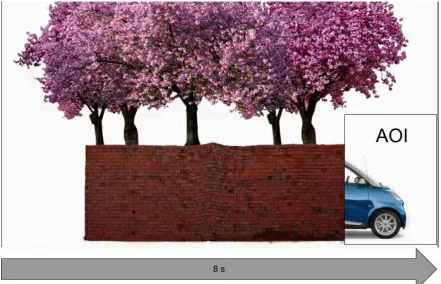
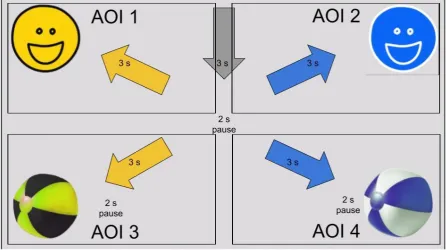
Object permanence 1: Temporary occlusion (O1). The clip consisted of two conditions. In the first (control) condition, would a vehicle pass the screen from left to right, taking approximately eight seconds. The second (experimental) condition introduced a wall, temporarily occluding the vehicle. The variable used for analyses was the gaze duration on the area of interest (AOI) to the right of the wall, from the vehicle disappearing behind the wall to just before its re-appearance (figure 1). The task consisted of four trials, with one to two experimental trials.
Figure 1. Experimental condition of the O1 task, showing both stimuli (the vehicle and
wall), as well as the area of interest (AOI) used for analysis. The time frame used for the analyses of gaze proportion in the AOI was from the vehicle’s disappearance, to just
before its re-appearance.
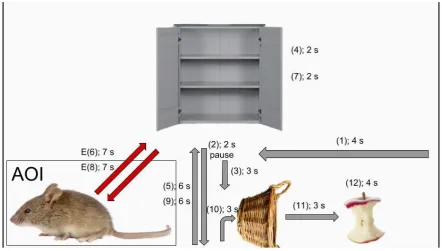
Object permanence 2: Hidden manipulation (O2). The clip consisted of two
the basket, covering the apple. The basket then moved to the top middle into the cabinet, which opens and closes. Only in the second (experimental) condition does the mouse now move into the cabinet as well, with the cabinet opening and closing again, the mouse then leaves again and returns to its original position (figure 2). The basket then moves back into its original position and tips over to the right revealing either the original apple (control
[image:15.595.76.519.297.548.2]condition) or an apple stem (experimental condition). The variable used for analyses was the gaze duration on the mouse (the AOI), from after the apple was revealed till the end of the trial. The task consisted of 3 trials, with one to two experimental trials.
Figure 2. Order and duration of movement in the O2 task, with the order of
movement between parentheses. The data relevant for analyses was the gaze proportion in the area of interest during step (11) and (12). Movements E(6) and E(8) only occurred in the experimental condition. Steps (11) and (12) employ an ‘uneaten’ apple, instead of an apple stem in the control condition (since steps E(6) and E(8) are missing has the apple has not been eaten). Steps (4) and (7) indicate opening and closing of the cabinet.
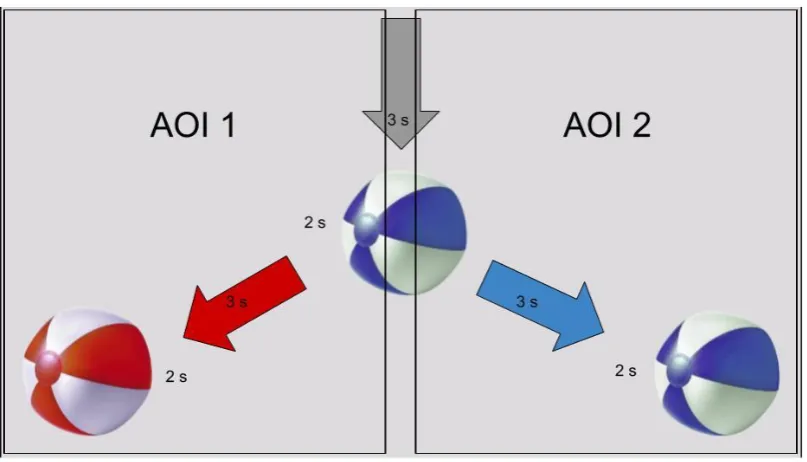
red beach balls) or function (C2: yellow and black smileys or beach balls) appears in the top middle and then moves to the middle of the screen, before either moving to the left or right bottom of the screen. The task is split into 5 familiarization- and 5 experimental trials. In the familiarization trials the objects are sorted into the ‘correct’ corners (C1: blue right, red left; C2: smiley left, beach ball right), from which the participant is expected to infer the
categories. In the experimental trials are two of the five trials ‘wrong’ (C1: blue left, red right; C2: smiley right, beach ball left). The distribution of the two ‘wrong’ trials within the
experimental trials is random, however there are never two consecutive ‘wrong’ trials to
[image:16.595.78.482.378.609.2]prevent dissolvement of the inferred categories. The variable used for analyses was the gaze duration on the side the object was being sorted to (the AOI), beginning from the object starting to move into the corner, until its disappearance.
Figure 3. Control condition of the C1 task, with the stimuli (beach ball) being
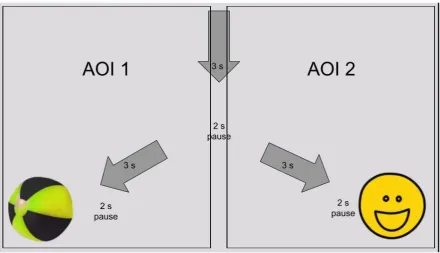
Figure 4. Control condition of the C2 task, with the stimuli (beach ball or smiley)
being sorted to either the left (beach ball) or right (smiley) side. The data used for
analyses was the proportion of gaze in the area of interest (AOI) (AOI 1 for beach ball, 2 for smiley in the control condition and AOI 1 for smiley and 2 for beach ball in the experimental condition) from the ball or smiley starting to move into a corner until its disappearance.
Categorization 3: Color and Function (C3). The third categorization task consisted of two different conditions. In both conditions either a black and yellow or white and blue smiley or beach ball appears in the top middle and then moves to the middle of the screen, before either moving to the left or right bottom or top of the screen. The task is split into 10 familiarization- and 5 experimental trials. In the familiarization trials the smileys and beach balls are sorted into the ‘correct’ corners (blue smiley top right, yellow smiley top left, blue
beach ball bottom right, yellow beach ball bottom left), from which the participant is expected to infer the categories. In the experimental trials are three of the five trials ‘wrong’. One of the ‘wrong’ trials being an error of color, one an error of function and one an error of both
random, however there are never two consecutive wrong trials to prevent dissolvement of the inferred categories. The variable used for analyses was the gaze duration on the corner the object was being sorted to (the AOI), beginning from the object starting to move into the corner, until its disappearance.
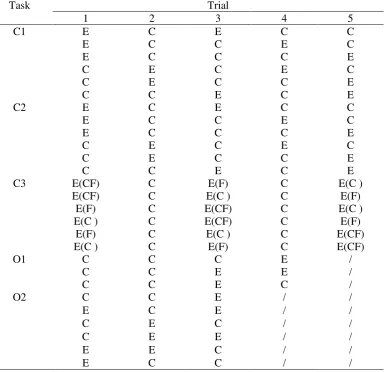
Table 1
Possible permutations of trials per task. Trial condition indicated by C (control), E
(experimental), E(C)(error of color), E(F)(error of function) and E(CF)(error of color and
function).
Task Trial
1 2 3 4 5
C1 E C E C C
E C C E C
E C C C E
C E C E C
C E C C E
C C E C E
C2 E C E C C
E C C E C
E C C C E
C E C E C
C E C C E
C C E C E
C3 E(CF) C E(F) C E(C )
E(CF) C E(C ) C E(F)
E(F) C E(CF) C E(C )
E(C ) C E(CF) C E(F)
E(F) C E(C ) C E(CF)
E(C ) C E(F) C E(CF)
O1 C C C E /
C C E E /
C C E C /
O2 C C E / /
E C E / /
C E C / /
C E E / /
E E C / /
E C C / /
Procedure
The testing took place over a two day period. The tests were conducted in quite, dimly lit rooms. The researcher was present during the assessment, but out of sight of the
participant. The participant was informed about the procedure of the assessment and signed an informed consent form before commencing with the measurement (Appendix I). The
function. The eye gaze recording and study clips were started as soon as the system was correctly set up. The whole procedure took approximately 15 minutes.
Design
The present study employed a semi-random, alternating treatment, small-n
randomization design. A small-n randomization design seeks to use participants as their own control group. The participant’s trials are viewed as a population against which individual trials can be compared. This requires the conditions to be randomly distributed. However complete randomization of conditions was not possible in the current study. Some of the clips presented to the participants required certain rules with regards to the order of presentation. The exact rules for this can be found in the description of the tasks and the resulting possible distributions in table 1. This semi-random distribution as opposed to complete randomness has implications not only for the computations required, but also for their statistical power. The lowest possible p value achievable by a randomization analyses performed on
randomization data is the inverse of the cardinality of the set of possible permutations. This means that the statistical power is lower when rules of distribution are introduced into the otherwise random permutations.
Not all possible permutations of conditions order were constructed for every task. Every task instead has three different permutations of order, which were selected randomly out of the possible permutations. The permutation with which to assess a participant was selected randomly out of these three. The decision for this was made due to practical
Analyses
The measurements using Tobii’s Gaze Viewer program on rdgKompagne’s KOJO system resulted in time distributed heat maps. In other words, video showing the material, with a temporally distributed heat map superimposed on top of it.
The first step of analyses was to translate the heat map data into numerical, temporally distributed coordinates. This was done using a python script, adapted from an open source script intended for object tracking (Rosebrock, 2015). The altered version of the script, as used for the translation of the data can be found in the appendix (appendix II). The script translates the temporarily distributed heat map into ten pixel coordinates a second with a timestamp. It does this by finding contours of the relevant color (the colors used by the heat map to indicate the point of gaze), computing the minimum radius, contour enclosing circle and returning its center. In simpler terms, the script finds the middle of what the participant is looking at and returns this point as coordinates, with a temporal resolution of ten
measurements a second.
The coordinates data was then coded into proportions of gaze within the AOI during the time frame relevant for the analyses (as described under the stimuli and tasks section). This will be illustrated using the C1 task as an example. If a participant looked at the side to which an object was being sorted (the AOI), while it is being sorted (the relevant time frame) for half of the 50 measurements (five seconds, three of the object moving into the corner and two before it disappears, with ten measurements a second), would this result in a score of 0.5 for this trial. Doing this for all trials results in proportions of gaze duration for every control and experimental trial ranging from 0 (the participant not looking at the relevant AOI during the time frame) to 1 (the participant only looking at the AOI during the time frame). This proportion of gaze data was then used for the randomization model analyses.
package which includes a script to analyze data with the use of randomization models (SCRT). The proportion of gaze data was sorted into control (A) and experimental trials (B).
The first step of analyses using the randomization design was to compute the test statistic, the formula for this differed between the tasks. For the object permanence tasks were the experimental trials (B) expected to have a higher proportion of eye gaze in the AOI during the relevant time frame than the control trials, resulting in a test statistic formula of B-A. An effect direction was not specified for the categorization tasks, as any difference in gaze duration between the conditions was regarded as an indicator of an understanding of categorization. This resulted in a test statistic formula of |A-B|.
To obtain a p value for the randomization models were 1000 random distributions constructed and their test statistics calculated. The distributions were constructed by randomly assigning the conditions (A or B) to the observed scores, which remained fixed. The p value was the proportion of the obtained test statistics which are equal to- or greater than the observed test statistic. The level set to reach statistical significance was α = 0.05.
The p value for the opposite test statistic was computed for the object permanence tasks as well (A-B instead of B-A), to control for a possible effect in the opposite of the hypothesized direction. The test statistics them self are only reported for B-A, as the test statistic for A-B is simply -(B-A).
The data from the third categorization task (assessing both color and function) was analyzed in a different way than the other four tasks. The third categorization task employed not only ‘wrong’ trials as the other two categorization tasks, but different kinds of ‘wrong’
trials, as described in the tasks and stimuli section. This task required different analyses as the randomization in this task is solely based on the randomization of different kinds of errors. In other words, the permutations were all the same in that three ‘wrong’ trials were presented at
one for each kind of ‘wrong’ trial, with each of the parts consisting of their own random distribution with one ‘wrong’ and two ‘correct’ trials.
The obtained p values for the individual participants were subsequently combined using Onghena and Edgington’s (2005) formula for sequential replication of randomization experiments. This was done, as the individual participants testing did not include enough trials to reach a statistical significance level of α = 0.05. This was done intentionally due to the severely limited attention span of the target group, making extensive assessment unrealistic. The formula used for the p value combination can be found in equation 1.
𝑃(𝑆 ≤ 𝑆𝑜𝑏𝑠) = ∑ (−1)`𝑆𝑘=0 𝑘(𝑛𝑘)(𝑆𝑜𝑏𝑠−𝑘) 𝑛
𝑛! (1)
Where P is the combined p value, 𝑆𝑜𝑏𝑠 is the sum of all p values, `S is the lowest integer under 𝑆𝑜𝑏𝑠, k counter up to the largest integer under 𝑆𝑜𝑏𝑠 and n the number of p values.
IBM’s SPSS was used to construct the graphs used for visual analyses. This was done
using the same dataset used for the analyses by randomization model. Graphs for the proportion of gaze (as described earlier) by trial, were constructed for all tasks and all used permutations. Graphs displaying differences in gaze standard deviation between control and experimental conditions were constructed for all three categorization tasks (C1, C2 and C3). Gaze standard deviation meaning the mean standard deviation of all observed eye movements during a trial’s duration for all trials of a condition. These are supposed to indicate if a
difference in gaze behavior based on the experimental manipulation occurred, which did not manifest itself in the proportion of gaze graphs.
Results
tasks. The results from the randomization model analyzes, as well as from the visual analyses of the proportion of gaze and standard deviation graphs will be reported.
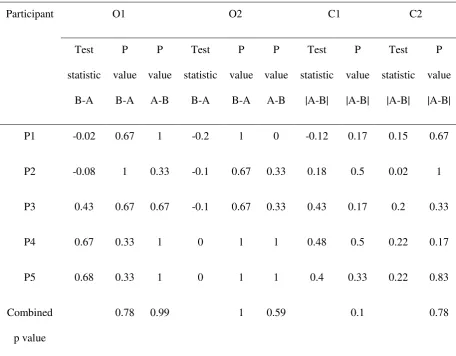
Table 2
Randomization model’s test statistic and p values per participant and task. Combined p
values per task were computed with Onghena and Edgington’s (2005) formula.
Participant O1 O2 C1 C2
Test statistic B-A P value B-A P value A-B Test statistic B-A P value B-A P value A-B Test statistic |A-B| P value |A-B| Test statistic |A-B| P value |A-B|
P1 -0.02 0.67 1 -0.2 1 0 -0.12 0.17 0.15 0.67
P2 -0.08 1 0.33 -0.1 0.67 0.33 0.18 0.5 0.02 1
P3 0.43 0.67 0.67 -0.1 0.67 0.33 0.43 0.17 0.2 0.33
P4 0.67 0.33 1 0 1 1 0.48 0.5 0.22 0.17
P5 0.68 0.33 1 0 1 1 0.4 0.33 0.22 0.83
Combined
p value
0.78 0.99 1 0.59 0.1 0.78
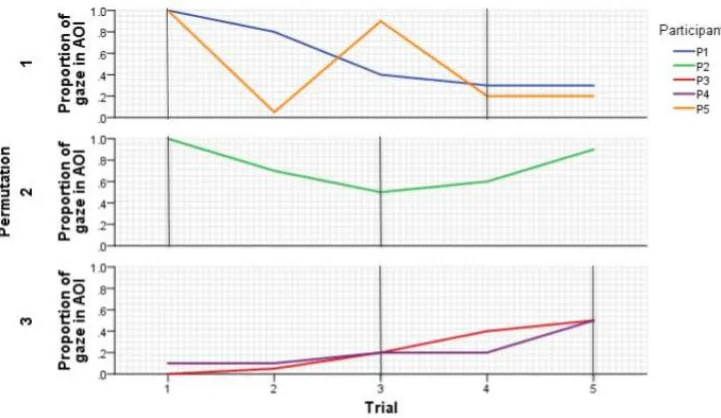
Categorization 1: Color. The alternating treatment randomization model was not able to find a significant difference in gaze duration in the AOI during the relevant time frame between an object being sorted ‘correctly’ or ‘wrongly’ for any of the participants (table 2). Using Onghena and Edgington’s (2005) formula for sequential replication of experiments did not yield a significant result for the collective scores of participants (p = 0.1).
compared to the control trials preceding or succeeding them (figure 6). This pattern could however not be detected for participant P1, who did not indicate much of an influence of the experimental condition on gaze patterns at all.
Figure 6. Schematic representation of proportion of gaze in the area of interest during the relevant time frame by trial, permutation and participant in the C1 task. The two
experimental trials are indicated by vertical lines.
It is further interesting to note that both participants in the third permutation (P3 and P4) display a ‘w’ shaped pattern. The peaks for trials three and five were expected because of them being experimental trials, it is unclear however why both participants exhibit a peak for trial one as well.
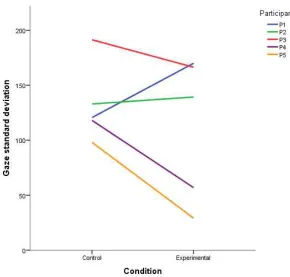
The comparison of standard deviation in the gaze patterns detected between the control and experimental conditions display a decrease in standard deviation for the
Figure 7. Gaze standard deviation per condition and participant for the C1 task. Categorization 2: Function. The alternating treatment randomization model was not able to find a significant difference in gaze duration in the AOI during the relevant time frame between an object being sorted ‘correctly’ or ‘wrongly’ for any of the participants (table 2). Using Onghena and Edgington’s (2005) formula for sequential replication of experiments did not yield a significant result for the collective scores of participants (p = 0.78).
The plots for proportion of gaze duration in the AOI during the relevant time frame for task C2 did not display a strong effect of the experimental condition for any of the
Figure 8. Schematic representation of proportion of gaze in the area of interest during the relevant time frame by trial, permutation and participant in the C2 task. The two
experimental trials are indicated by vertical lines.
[image:27.595.79.384.404.684.2]relevant time frame between an object being sorted ‘correctly’ or ‘wrongly’ for any of the participants or kinds of errors (table 3).
Table 3
Randomization model’s test statistic and p values per participant and kind of error for C3.
Participant Error of color Error of function Error of color and function
P1 0.55(0.33) 0.55(0.33) 0.25(0.33)
P2 0.15(1) 0.25(1) 0.45(0.67)
P3 0.3(0.33) 0(1) 0.7(0.33)
P4 0.85(0.33) 0.4(0.33) 0.5(0.33)
P5 0.15(1) 0.15(1) 0.35(0.67)
Note. P values in parentheses.
Figure 10. Schematic representation of proportion of gaze in the area of interest during the relevant time frame by trial, permutation and participant in the C3 task. The experimental trials are indicated by vertical lines. The kind of error constituting the
experimental trial is indicated by either ‘C’ (Error of color), ‘F’ (Error of function) or ‘C/F’
(Error of color and function).
Figure 11. Gaze standard deviation per condition and participant for the C3 task. Object permanence 1: Temporary occlusion. The alternating treatment
randomization model was not able to find a significant difference in gaze duration in the AOI during the relevant time frame between an object’s movement being temporarily occluded and an object’s movement not being occluded, for any of the participants (table 2). Using
Onghena and Edgington’s (2005) formula for sequential replication of experiments did not yield a significant result for the collective scores of participants (p = 0.78).
[image:30.595.77.376.67.361.2]Participants P1 and P2 did not display any interest in the AOI during the relevant time frame, regardless of it being a control- or experimental trial.
Figure 12. Schematic representation of proportion of gaze in the area of interest during the relevant time frame by trial, permutation and participant in the O1 task. The experimental trials are indicated by vertical lines.
Object permanence 2: Hidden manipulation. The alternating treatment
randomization model was not able to find a significant difference in gaze duration in the AOI during the relevant time frame between an object being manipulated or not being
manipulated, while out of sight for any of the participants (table 2). Using Onghena and Edgington’s (2005) formula for sequential replication of experiments did not yield a significant result for the collective scores of participants (p = 1).
The plots for proportion of gaze duration in the AOI during the relevant time frame for task O2 for all participants did not indicate a tendency of participants to spend a longer
Figure 13. Schematic representation of proportion of gaze in the area of interest during the relevant time frame by trial, permutation and participant in the O2 task. The experimental trials are indicated by vertical lines.
Experiment 2 Methods Participants
Eight participants were selected using convenience sampling. Three were female and five male. Five participants were students at Tyltylcentrum de Witte Vogel (The Hague, NL), two participants were students at Emiliusschool (Eindhoven, NL) and one participant was a student at Het Roessingh, Centrum voor Revalidatie (Enschede, NL). All participants were Dutch. Participants had an average age of 10.58 years (SD = 4.72). Participants average estimated cognitive age (as provided by the teaching institutions) was 14.63 months (SD = 14.33). All participants were developmentally disabled. The exact diagnosis varied, with cerebral palsy being the most common diagnosis with three occurrences. Not all children had received an exact diagnosis yet, due to their young age. Further were one participant’s parents not comfortable disclosing their child’s exact diagnosis.
[image:32.595.96.443.70.266.2]experienced when encountering strangers, attention span, visio-perceptual abilities and availability.
Procedure
The testing took place over a three week period. The tests were conducted in quite, dimly lit rooms, with participant’s therapist(s)/caretaker(s) present. The participant’s main
therapist/caretaker was instructed to act as he/she would when the child is interacting with an eye tracking device outside of an experimental setting, e.g. trying to redirect the participant's attention when he/she lost interest. The researcher was present during the assessment, but out of sight of the participant. The tests were conducted in Het Roessingh, Centrum voor
Revalidatie (Enschede, NL), Tyltylcentrum Witte Vogel (The Hague, NL) and Emiliusschool (Eindhoven, NL). Informed consent forms were sent to the participant’s parents via the
institutions beforehand (Appendix I). The participant was placed in front of the KOJO eye tracking system, which was then adapted to the participant in height, distance and angle using Tobii’s Gaze Viewer’s trackstatus function. The eye gaze recording and study clips were started as soon as the system was correctly set up. In some cases a total loss of interest by the participant required skipping to the following clip, to prevent distress for the participant. The whole procedure took approximately 15 minutes.
Analyses
The analyses is identical to the first experiment’s with one exception. It became apparent during the coding process that not all participants from the experimental group paid close attention to the screen. One participant was omitted entirely and most others on some tasks, due to this. The exact structure of which measurements were omitted can be found in table 4 in the results section.
Results
tasks. The results from the randomization model analyzes, as well as from the visual analyses of the proportion of gaze and standard deviation graphs will be reported.
Table 4
Summary of the randomization model’s test statistic by participant. Includes combined p
values, computed with Onghena and Edgington’s (2005) formula.
Participant O1 O2 C1 C2
Test statistic B-A P value B-A P value A-B Test statistic B-A P value B-A P value A-B Test statistic |A-B| P value |A-B| Test statistic |A-B| P value |A-B|
E1 -0.17 1 0.33 0.4 0.33 0.67 NA NA 0.15 0.67
E2 1 0.33 1 0 1 1 0.4 0.33 0.25 0.17
E3 NA NA NA 0 1 1 NA NA 0.67 0.5
E4 -0.1 1 0.33 0.6 0.33 1 NA NA 0.18 0.83
E5 NA NA NA 0 1 1 0.18 0.83 NA NA
E6 NA NA NA -0.4 0.67 0.33 0.18 0.67 NA NA
Combined
p value
0.95 0.62 0.97 1 0.74 0.61
Categorization 1: Color. The alternating treatment randomization model was not able to find a significant difference in gaze duration in the AOI during the relevant time frame between an object being sorted ‘correctly’ or ‘wrongly’ for any of the participants (table 4). Using Onghena and Edgington’s (2005) formula for sequential replication of experiments did not yield a significant result for the collective scores of participants (p = 0.74).
duration of the relevant time frame looking at the AOI during experimental trials, compared to the control trials (figure 14). This is interesting as participants E5 and E6 do display drastic decrease in gaze standard deviation for experimental trials compared to control trials (figure 15).
[image:35.595.96.443.182.381.2]Figure 14. Schematic representation of proportion of gaze in the area of interest during the relevant time frame by trial, permutation and participant in the C1 task. The two experimental trials are indicated by vertical lines.
[image:35.595.79.363.478.751.2]Categorization 2: Function. The alternating treatment randomization model was not able to find a significant difference in gaze duration in the AOI during the relevant time frame between an object being sorted ‘correctly’ or ‘wrongly’ for any of the participants (table 4). Using Onghena and Edgington’s (2005) formula for sequential replication of experiments did
not yield a significant result for the collective scores of participants (p = 0.61).
[image:36.595.95.447.375.575.2]The plots for proportion of gaze duration in the AOI during the relevant time frame for task C2 for participants E2 and E3 did indicate a tendency of participants to spend a longer duration of the relevant time frame looking at the AOI during experimental trials, compared to the control trials preceding or succeeding them (figure 16). However this is not apparent in their standard deviation differences between experimental and control condition, with E3 displaying a difference and E2 not displaying one (figure 17).
Figure 17. Gaze standard deviation per condition and participant for the C2 task. Categorization 3: Color and Function. The alternating treatment randomization model was not able to find a significant difference in gaze duration in the AOI during the relevant time frame between an object being sorted ‘correctly’ or ‘wrongly’ for either of the two participants or kinds of errors (table 5).
Table 5
Randomization model’s test statistic and p values per participant and kind of error for C3.
Participant Error of color Error of function Error of color and function
E2 0.15(1) 0.25(0.67) 0.15(1)
E6 0.45(0.67) NA 0.55(0.67)
Note. P values in parentheses.
[image:37.595.64.441.583.660.2]displays a sharp drop in gaze standard deviation between control and experimental conditions (figure 19). This trend is somewhat apparent in the proportion of gaze spend in the AOI during the relevant time frame, however not for the ‘error of color’ (C).
‘Error of function’ (F) displays the strongest effect for E2, this can however not be compared to E6 as he/she is missing the last trial’s value, which would have been the ‘error of function’ (F). C/F seems to have the strongest effect disregarding ‘error of function’.
Figure 18. Schematic representation of proportion of gaze in the area of interest during the relevant time frame by trial, permutation and participant in the C3 task. The experimental trials are indicated by vertical lines. The kind of error constituting the
experimental trial is indicated by either ‘C’ (Error of color), ‘F’ (Error of function) or ‘C/F’
[image:38.595.94.439.239.440.2]Figure 19. Gaze standard deviation per condition and participant for the C3 task. Object permanence 1: Temporary occlusion. The alternating treatment
randomization model was not able to find a significant difference in gaze duration in the AOI during the relevant time frame between an object’s movement being temporarily occluded and an object’s movement not being occluded, for any of the participants (table 4). Using
Onghena and Edgington’s (2005) formula for sequential replication of experiments did not
yield a significant result for the collective scores of participants (p = 0.95).
E1 and E4 did not display this pattern. Interestingly however did they both exhibit their only peak at trial three, the last control trial.
Figure 20. Schematic representation of proportion of gaze in the area of interest during the relevant time frame by trial, permutation and participant in the O1 task. The experimental trial is indicated by a vertical line.
Object permanence 2: Hidden manipulation. The alternating treatment
randomization model was not able to find a significant difference in gaze duration in the AOI during the relevant time frame between an object being manipulated or not being manipulated while out of sight for any of the participants (table 4). Using Onghena and Edgington’s (2005) formula for sequential replication of experiments did not yield a significant result for the collective scores of participants p = 0.97).
The plots for proportion of gaze duration in the AOI during the relevant time frame for task O2 for all participants did not indicate a tendency of participants to spend a longer
Figure 21. Schematic representation of proportion of gaze in the area of interest during the relevant time frame by trial, permutation and participant in the O2 task. The experimental trials are indicated by vertical lines.
General Discussion
The goal of the present study was to explore the methodological validity of using eye tracking to assess developmentally disabled children's level of understanding of object permanence and categorization. This was to be done by employing a small n randomization design randomly shuffling experimental and control conditions, in order to use participants as their own control group. The statistical analyses did not yield any significant results. The visual analyses however did yield interesting results. These results will be discussed in more depth and related to similar studies in the following.
A key finding of the visual analyses that holds for both the proof of concept- and experimental group, is that participants show individual differences with regards to exhibiting the hypothesized influence of conditions on their gaze patterns. With eight of the nine cases in which participants from the proof of concept group display an influence of conditions
stemming from participants P3, P4 and P5 and two of the three cases for the experimental group stemming from E2. This finding further explains the failure of Onghena and
[image:41.595.95.434.72.264.2]The failure to find significant results for the proof of concept group is especially damming, as this group was supposed to demonstrate the construct validity of the concepts tested. Not finding these results suggests that the used stimuli may not have been valid after all, impeding the interpretation of the experimental group’s performance as an expression of understanding of object permanence and categorization. The only redeeming point here is that the visual analyses did yield the expected results in eight cases for the POC group, compared to the experimental group’s three. This suggests that the assumption of the POC group possessing the understanding of the assessed concepts more uniformly than the experimental group might still be valid. The shortcoming instead seems to be related to the stimuli.
There is however one caveat when it comes to regarding the unexpected performance of the POC group as indicative of a lack of construct validity, namely the fact that the stimuli were designed for developmentally disabled children. The stimuli were designed in such a way that participants with slow processing speed would be able to follow the stimuli, as the participants from the experimental group were expected to be. This may have led to a failure to detect the proof of concept groups reactions to the experimental manipulations, as the time frames regarded as relevant were long (in the order of several seconds) to account for the slow nature of the stimuli. This notion is supported by the graphs showing a difference in gaze standard deviation between conditions for the proof of concept group, especially for
participants P3, P4 and P5. The change in standard deviation would be able to ‘catch’ short
differences in fixation between conditions, while the proportion of gaze spend in the AOI during the relevant time frame would not, as this averages out the observations.
Churchland, Chou and Lisberger’s (2003) study found that monkeys showed
anticipatory tacking behavior when a moving object was temporarily occluded. This is similar to the mechanism underlying the O1 task, suggesting that the hypothesized result of
participants expecting the vehicle’s reappearance could have been expected to be found in the
The lack of significant results for the C2 task, especially in the proof of concept group might be partially explained with a finding by Quinn, Doran, Reiss and Hoffman (2009). They found that children exhibited a longer fixation time on faces of cats and dogs, compared to the rest of the body. This is relevant as C2 employed either beach balls or smileys as stimuli, the fixation of which could have been biased towards the smileys. While this effect in itself would not bias the overall outcome of the task, would it exaggerate any biases already present in the task, such as the experimental conditions’ effect being partly dependent on their timing.
In other words, if the first experimental trial for one participant is a smiley and a beach ball for another, might the possible difference in effect be exaggerated as an interaction between a preference for faces and the temporal distribution of the experimental trials.
A correlation in performance between object permanence and categorization tasks was theorized to act as an indicator of criterion validity, as both concepts were reasoned to be surrogates of overall memory development. However since the POC group’s performance did
not ensure construct validity of the measurements, could correlations in performance between tasks not be regarded as indicators of criterion validity, as the tasks’ validity in themselves was not given.
The failure of the randomization models to find significant results was partly expected. Single case randomization models have a lower bound for p values, which is the inverse of the cardinality of the set of possible permutations (Onghena & Edgington, 2005). This was known beforehand and was supposed to be offset by using multiple participants within the same randomization model and combining their p values using Onghena and Edgington’s (2005) formula, which was theorized to lead to a p value lower than 0.05. C1 will be used as an example to explain this.
which had been established by the familiarization trials. This limits the permutations
somewhat, leading to six possible permutations, the inverse of which is ⅙ or 0.17. In practice this means that if a participant would get a perfect score with regards to rejecting the null hypothesis, would this result in a p value of 0.17. In other words, an individual participant would not be able to reach a significant score (α = 0.05) even if his/her score on all control trials was zero and on all experimental trials one.
One could argue that the researcher would need to account for this by employing enough trials for a single subject to be able to reach a significant result. The current study’s experimental group however was developmentally disabled children, most of which had low attention spans. An expert from Het Roessingh, Centrum voor Revalidatie mentioned: “Much longer and you are going to lose their attention.” with regards to a stimulus being shown for ten seconds. Expecting participants to have a low attention span leads to a trade-off between keeping the trials low to not overburden the participant and having enough trials to reach significance when combining p values. Here one needs to take diminishing returns of increasing the trial amount into account. Increasing the trial amount from four to five
decreases the lowest possible p value from 0.33 to 0.16. Increasing it from five to seven only reduces it from 0.17 to 0.07.
Future Studies
The present study’s aim of assessing the methodological validity of using eye tracking to measure a participant’s understanding of two different cognitive concepts, on different
levels of sophistication, may have been too ambitious. Future studies may be better advised to focus on one aspect of one cognitive concept.
advising future studies to use more participants is seen as lazy writing, because using more participants would always be beneficial. The limiting factor often being monetary constraints. Concentrating on a single task in favor of adding more trials however, achieves the same as adding more participants within a randomization model, without the increase in monetary requirements.
Researchers might want to follow more simplistic stimuli design as Johnson et al. (2003) did, as the heightened realism employed in the present study’s stimuli may have introduced additional variance in the data. There does seem to be a tradeoff however, with experts at both Tyltylcentrum Witte Vogel and Het Roessingh, Centrum voor Revalidatie mentioning that it might be easier to keep a developmentally disabled child’s attention when
more realistic stimuli are used. Using simple stimuli and finding other ways of keeping a child’s attention may be the way to go.
The overall notion of employing eye tracking methodology to assess developmentally disabled children’s understanding of cognitive concepts remains promising, even with the shortcomings presented here. Riviere, J., & Lecuyer, R. (2003) found that children with type-2 spinal muscular atrophy (SMA) performed better on object permanence tasks than controls from the general population. They ascribe this difference to a failure of healthy children to inhibit a learned motor response, intuitively reaching for the (know empty) container when prompted to search for the object. This indicates that there might be a difference in, not necessarily the level of understanding of object permanence between healthy children and SMA patients, but a difference in how this understanding manifests itself when examined with methods requiring motor movement. Eye tracking circumvents this additional variance.
The present study was not able to reliably test eye tracking as a methodological paradigm for assessing cognitive concepts in developmentally disabled children, as the ‘baseline’ to test the construct validity of the tasks used, the proof of concept group, did not
References
Allen, S. W., & Brooks, L. R. (1991). Specializing the operation of an explicit rule. Journal of experimental psychology: General, 120(1), 3-19.
Anderson, J. R. (1983). Retrieval of information from long-term memory. Science, 220(4592), 25-30.
Baddeley, A. (2003). Working memory: looking back and looking forward. Nature reviews neuroscience, 4(10), 829-839.
Barsalou, L. W. (1992). Frames, concepts, and conceptual fields. In A. Lehrer & E. F. Kittay (Eds.), Frames, fields, and contrasts: New essays in semantic and lexical
organization (pp. 21-74). Hillsdale, NJ, US: Lawrence Erlbaum Associates, Inc.
Bertenthal, B. I., Longo, M. R., & Kenny, S. (2007). Phenomenal permanence and the development of predictive tracking in infancy. Child development, 78(1), 350-363.
Bjorklund, D. F. (1987). How age changes in knowledge base contribute to the development of children's memory: An interpretive review. Developmental Review, 7(2), 93-130.
Bogartz, R. S., Shinskey, J. L., & Schilling, T. H. (2000). Object permanence in five-and-a-half-month-old infants?. Infancy, 1(4), 403-428.
Cashon, C. H., & Cohen, L. B. (2000). Eight-month-old infants' perception of possible and impossible events. Infancy, 1(4), 429-446.
Churchland, M. M., Chou, I. H., & Lisberger, S. G. (2003). Evidence for object permanence in the smooth-pursuit eye movements of monkeys. Journal of neurophysiology, 90(4), 2205-2218.
Corrigan, R. (1978). Language development as related to stage 6 object permanence development. Journal of Child Language, 5(2), 173-189.
Eimas, P. D., Quinn, P. C., & Cowan, P. (1994). Development of exclusivity in perceptually based categories of young infants. Journal of Experimental Child Psychology, 58, 418-431.
Gopnik, A., & Meltzoff, A. (1987). The development of categorization in the second year and its relation to other cognitive and linguistic developments. Child development, 1523-1531.
Henderson, J. M. (2003). Human gaze control during real-world scene perception. Trends in cognitive sciences, 7(11), 498-504.
Johnson, S. P., Bremner, J. G., Slater, A., Mason, U., Foster, K., & Cheshire, A. (2003). Infants’ perception of object trajectories. Child development, 74(1), 94-108
Mandler, J. M. (2004). The foundations of mind: Origins of conceptual thought. Oxford University Press.
Markman, A. B., & Dietrich, E. (2000). Extending the classical view of representation. Trends in cognitive sciences, 4(12), 470-475.
Moore, M. K., & Meltzoff, A. N. (2008). Factors affecting infants’ manual search for
occluded objects and the genesis of object permanence. Infant Behavior and Development, 31(2), 168-180.
Schilling, T. H. (2000). Infants' looking at possible and impossible screen rotations: The role of familiarization. Infancy, 1(4), 389-402.
Schneider, W., & Pressley, M. (2013). Memory development between two and twenty. Psychology Press.
Lee, T. S. (2002). Top-down influence in early visual processing: a Bayesian perspective. Physiology & behavior, 77(4-5), 645-650.
Park, D. C., Smith, A. D., Lautenschlager, G., Earles, J. L., Frieske, D., Zwahr, M., & Gaines, C. L. (1996). Mediators of long-term memory performance across the life
span. Psychology and aging, 11(4), 621-637.
Piaget, J. (1955). The child's construction of reality. Routledge & Kegan Paul Limited.
Quinn, P. C. (2004). Development of Subordinate‐Level Categorization in 3‐to 7‐Month‐Old Infants. Child Development, 75(3), 886-899.
Quinn, P. C., Doran, M. M., Reiss, J. E., & Hoffman, J. E. (2009). Time course of visual attention in infant categorization of cats versus dogs: Evidence for a head bias as revealed through eye tracking. Child development, 80(1), 151-161.
Quinn, P. C., & Eimas, P. D. (1998). Evidence for a global categorical representation of humans by young infants. Journal of experimental child psychology, 69(3), 151-174.
Rakison, D. H., & Oakes, L. M. (Eds.). (2003). Early category and concept development: Making sense of the blooming, buzzing confusion. Oxford University Press.
Reznick, J. S., Morrow, J. D., Goldman, B. D., & Snyder, J. (2004). The onset of working memory in infants. Infancy, 6(1), 145-154.
Roder, B. J., Bushnell, E. W., & Sasseville, A. M. (2000). Infants' preferences for familiarity and novelty during the course of visual processing. Infancy, 1(4), 491-507.
Rosebrock, A. (2015, September 14). Ball Tracking with OpenCV. Retrieved June 1, 2018,
from https://www.pyimagesearch.com/2015/09/14/ball-tracking-with-opencv/
Ruffman, T., Slade, L., & Redman, J. (2005). Young infants' expectations about hidden objects. Cognition, 97(2), B35-B43.
Onghena, P., & Edgington, E. S. (2005). Customization of pain treatments: Single-case design and analysis. The Clinical journal of pain, 21(1), 56-68.
Wade, N. J. (1998). Light and sight since antiquity. Perception, 27(6), 637-670.
Wang, S. H., Baillargeon, R., & Brueckner, L. (2004). Young infants' reasoning about hidden objects: Evidence from violation-of-expectation tasks with test trials only. Cognition, 93(3), 167-198.
Wasserman, E. A., & Rovee-Collier, C. (2001). Pick the flowers and mind your As and 2s! Categorization by pigeons and infants. In M. E. Carroll & J. B. Overmier
(Eds.), Animal research and human health: Advancing human welfare through behavioral science (pp. 263-279). Washington, DC, US: American Psychological
Appendix Appendix I
Informed Consent proof of concept group
Informed Consent
On a voluntarily basis, I decided to participate in an experiment in which my ocular movements will be recorded and analyzed to estimate the level of understanding of certain cognitive concepts.
The experiment consists of different parts, including tasks for object permanence and categorization.
I have been informed about the specific purpose of the research and will have the opportunity to ask further questions after the experiment. If I have additional questions later on, I can always contact the researcher Jasper Grothues ().
I have the right to stop with the experiment at any time.
I understand that the data gathered in this experiment will be used for a thesis and might be published. My anonymity and the anonymity of my data is assured.
____________________________ ____________________________ Name participant Name researcher
___________________________ ____________________________ Signature participant Signature researcher
____________________________ Place
Informed consent experimental group
Geïnformeerde toestemming
Vrijwillige deelname aan onderzoek rond het onderzoeken van cognitief prestatie met behulp van eye tracking
Beste ouders,
als deel van het designen van een nieuwe product is RDG Kompagne geïnteresseerd in het inschatten van cognitieve ontwikkeling met behulp van eye tracking. Ook ben ik zelf erin geïnteresseerd als deel van mijn master these in Human Factors op de Universiteit Twente. Om deze reden heeft RDG Kompagne korte filmpjes gedesigned die een bepaald niveau van
cognitieve ontwikkeling vereisen om ze te “snappen”. Deze filmpjes willen graag aan jullie
kind tonen.
In kader van het onderzoek hebben wij een aantal van jullie kind persoonsgegevens nodig. Deze zullen enkel in functie van het onderzoek aangewend worden en zullen op geen enkele wijze publiek gemaakt worden. Om je privacy te vrijwaren zullen alle onderzoeksresultaten volledig geanonimiseerd gerapporteerd worden.
Als jullie verder nog vragen hebben, kunnen jullie steeds contact met mij opnemen.
Hartelijk dank voor je medewerking!
Naam kind ………
Geïnformeerde toestemming
Ik, (ondergetekende),
……….... (volledige naam in drukletters a.u.b.)
Optioneel : Ik, (ondergetekende),
……….... (volledige naam in drukletters a.u.b.)
Ga ermee akkoord dat mijn kind mag meedoen aan het onderzoek en ga akkoord met de volgende voorwaarden:
(1) Ik heb voldoende informatie gekregen omtrent het doel van het onderzoek;
(2) Ik heb elke vraag in verband met het onderzoek kunnen stellen;
(3) Ik geef totaal uit vrije wil en op vrijwillige basis de toestemming voor mijn kind om deel te nemen aan het onderzoek;
(4) Ik geef de toestemming aan de onderzoeker om de resultaten op een vertrouwelijke en anonieme wijze te bewaren, te verwerken en te rapporteren;
(5) Ik begrijp dat alle gegevens geheel vertrouwelijk en anoniem zullen worden verwerkt en enkel in functie van onderzoek zullen worden gebruikt;
(6) Ik ben op de hoogte van de mogelijkheid om mijn deelname aan het onderzoek en de deelname van mijn kind op ieder moment stop te zetten en dit zonder opgave van reden;
(7) Ik ben ervan op de hoogte dat ik op aanvraag een samenvatting van de onderzoeksbevindingen kan krijgen;
Voor akkoord,
Plaats en datum Naam + handtekening van de onderwijs gerechtvaardigd
……….... ……….
Optioneel:
Plaats en datum Naam + handtekening van de onderwijs gerechtvaardigd
Plaats en datum Naam + handtekening van de onderzoeker
Appendix II
# import the necessary packages
from collections import deque
import numpy as np
import argparse
import imutils
import cv2
import time
import os
# construct the argument parse and parse the arguments
ap = argparse.ArgumentParser()
ap.add_argument("-v", "--video",
help="path to the (optional) video file")
ap.add_argument("-b", "--buffer", type=int, default=64,
help="max buffer size")
args = vars(ap.parse_args())
# define the lower and upper boundaries of the "green"
# ball in the HSV color space, then initialize the
# list of tracked points
greenLower = (29, 86, 6)
greenUpper = (64, 255, 255)
#(29, 86, 6)
#(64, 255, 255)
Code = "Julia3O2"
def save_into_file(xypos):
openFunction = open(Code + ".txt", "w")
openFunction.write(str("Code, " + "ms, " + "xpos, " + "ypos" + "\n"))
openFunction.write(str(",".join(map(lambda x: str(x), xypos))))
openFunction.close()
# if a video path was not supplied, grab the reference
# to the webcam
#if not args.get("video", False):
# camera = cv2.VideoCapture(0)
# otherwise, grab a reference to the video file
#else:
camera = cv2.VideoCapture("E:/Dokumente/UT/Internship/Heatmaps/Emiliusschool/" + Code +
".mp4")
posList = []
startTime = time.time()
frames = 0
# keep looping
while True: