Developing a data repository for the
Climate Adaptive City Enschede
Joeri Planting B.Sc Thesis August - 2018
Supervisor:
ir. ing. R.G.A. Bults
Critical Observer:
ir. J. Scholten
Creative Technology Faculty of Electrical Engineering, Mathematics and Computer Science University of Twente
P.O. Box 217 7500 AE Enschede
Abstract
Due to climate change, more frequent and heavier rainfall occurs in the Netherlands.
The city of Enschede’s sewage system is unable to handle the amount of rainwater in
case of heavy rainfall, which causes for streets to flood. The municipality of Enschede
is looking for solutions, which resulted in the Smart Rainwater Buffer graduation
project. The municipality also wants to monitor air temperature to gain insight in the
urban heat island effect in Enschede, which resulted in the graduation project Air
Temperature Monitoring. Both projects are brought together under the name Climate
Adaptive City Enschede (CAC). This report describes the development of a suitable
data repository for the CAC project.
Literature and state of the art research was done in order to gain insight in the
characteristics and pros and cons of the different classes of databases that exist, which
are (old)SQL, NoSQL, and NewSQL. Some database management systems of each of
the classes were compared, with focus on characteristics as data integrity, performance,
and geospatial functionalities. The concept for the repository consist of the database
and a generic interface. After setting up the requirements, the functional architecture
was designed with the data repository consisting of a database, and three interfaces.
One for each of the following roles, administrator, producer, consumer, which contain
the needed functionalities.
The implementation of the database of the final prototype is done with the
database management system PostgreSQL, extended with PostGIS. This combination
is a very mature, reliable, and fast database management system. The PostGIS extension
offers the most extensive set of geospatial functionality of all database management
Acknowledgements
First I’d like to thank my fellow students Jeroen Waterink, Thijs Dortman, Laura
Kester, and Adam Bako for the collaboration within the Climate Adaptive City
Enschede project. I would also like to thank my supervisor Richard Bults and my
critical observer Hans Scholten a lot, for their guidance, help, and insights during this
graduation project.
Finally, I’d like to thank Hendrik-Jan Teekens from the municipality of Enschede for
making the CAC graduation projects available to the University of Twente, as well as
Table of Contents
1. Introduction ... 1
1.1 Situation ... 1
1.2 Challenges ... 1
1.3 Research Questions ... 1
1.4 Outline ... 2
2. Background Research ... 4
2.1 Background ... 4
2.1.1 Enschede’s water problem ... 4
2.1.2 Urban Heat Island Effect ... 5
2.1.3 Sub-projects ... 6
2.2 Previous Work ... 7
2.2.1 Smart Rainwater Buffer ... 7
2.2.2 Air Temperature Monitoring ... 8
2.2.3 Conclusion ... 9
2.3 Literature Review ... 9
2.3.1 Introduction ... 9
2.3.2 Types of databases ... 10
2.3.3 Geospatial data ... 12
2.3.4 Conclusion ... 13
2.4 State Of The Art Review ... 14
2.4.1 PostGIS ... 14
2.4.2 MySQL ... 15
2.4.4 MongoDB ... 16
2.4.5 VoltDB ... 17
2.5 Conclusion ... 17
3. Methods and Techniques ... 20
3.1 Interviews ... 20
3.2 Design process for Creative Technology ... 21
3.2.1 Ideation ... 22
3.2.2 Specification ... 22
3.2.3 Realization ... 22
3.2.4 Evaluation ... 23
3.3 Stakeholder Analysis ... 23
3.3.1 Stakeholder roles ... 24
3.3.2 Stakeholder prioritization ... 24
3.4 Requirement Analysis ... 25
3.4.1 MoSCoW ... 25
3.5 Scenarios ... 26
4. Ideation ... 28
4.1 Stakeholder Identification and Analysis ... 28
4.1.1 Identification ... 28
4.1.2 Categorization and prioritization ... 29
4.2 Preliminary requirements ... 31
4.2.1 Functional requirements ... 31
4.2.2 Non-functional requirements ... 32
4.2.3 The dataset ... 32
4.3 Concept ... 35
5. Specification ... 39
5.1 Requirements ... 39
5.1.1 Functional requirements ... 39
5.1.2 Non-functional requirements ... 42
5.2 Table structure ... 42
5.2.1 RPS ... 43
5.2.2 AirT ... 44
5.2.3 SRB ... 46
5.2.4 Universal solution ... 47
5.3 Functional architecture ... 53
5.3.1 Overview ... 53
5.3.2 Repository ... 54
5.3.3 Producer interface ... 54
5.3.4 Consumer interface ... 59
5.4.5 Administrator interface ... 64
5.4 PACT Analysis ... 64
5.4.1 People ... 64
5.4.2 Activities ... 65
5.4.3 Context ... 66
5.4.4 Technologies ... 66
5.5 PACT-FICS scenario ... 66
6. Realization ... 71
6.2.1 PostgreSQL & PostGIS ... 72
6.2.2 PostgreSQL install log ... 75
6.2.3 PostGIS install log ... 76
6.2.4 Creating the database ... 77
6.3 Lumen php micro-framework ... 80
6.3.1 Installation ... 80
6.3.2 Routes ... 81
6.3.3 AdminController.php ... 86
6.3.4 ProducerController.php ... 87
6.3.5 ConsumerController.php ... 92
7. Evaluation ... 99
7.1 Postman ... 99
7.2 Functional testing ... 99
7.2.1 Tests ... 100
7.3 Performance ... 108
7.3.1 Admin interface ... 108
7.3.2 Producer interface ... 109
7.3.3 Consumer interface ... 109
7.4 Conclusion ... 110
8. Conclusion ... 113
9. Recommendations ... 116
References ... 117
Appendix ... 120
A. PostGIS Function Support Matrix ... 120
B. web.php, routes specification ... 130
C. AdminController.php ... 131
D. ProducerController.php ... 132
1.
Introduction
In this chapter a short description of the situation will be provided, followed by the challenges and research
questions regarding this graduation project. Finally, an outline of the contents of this thesis will be described.
1.1 Situation
Climate change, increase in city density and increase in hardened surfaces cause problems handling water and
heat, which are expected to increase over time [1]. The municipalities of Almelo, Hengelo and Enschede as well
as the Vechtstromen water authority participate in several projects, brought together under the name Klimaat
Actieve Stad (KAS) [2]. With the KAS projects the municipalities and water authority aim to better cope with
water and the changing climate, and contribute to an increase in quality of life for its citizens. From the KAS
projects of the municipalities and the water authority, the graduation project Climate Adaptive City (CAC)
Enschede followed.
The CAC Enschede project can be seen as a so called smart city project. Data handling arises as an
important factor in such smart city projects. The Climate Active City Enschede (CAC) graduation project
consists of several sub-projects, namely the Smart Rainwater Buffer (SRB), Air Temperature Monitoring
(AirT), and the Reference Precipitation System (RPS). These projects will generate large amounts of location
based data which has to be processed, stored, and be accessible for visualization in user interfaces.
1.2 Challenges
The goal of this graduation project is to develop a data repository for the CAC Enschede project. Data repository
development is highly dependent on the system’s requirements. To identify the requirements, close
collaboration with all projects generating and querying data and the municipality is necessary.
Each of the projects will have multiple sensor nodes deployed which frequently generate location based
data, resulting in a huge amount of data that needs to be stored. The stored data has to be accessible by user
interfaces to provide visualizations for end-users. From this, multiple challenges follow regarding how to handle
the heterogenic origin of data, the efficiency, costs, and scalability of the database system for potentially big
data, concurrent access, and data integrity. Regarding the visualization, challenges follow in querying areas
within a spatial based database system and potentially storing additional information on area types.
1.3 Research Questions
The research question that followed the challenges stated in the previous section is:
How to develop a suitable data repository for geo-tagged environmental data for the Climate Adaptive
City Enschede project?
The following sub-questions will be used in order to answer the above stated research question. The first,
What database management system is most suitable for storing geospatial data?
The second, regarding the performance of the system, is:
How to maintain performance with large amounts of data generating sensor nodes?
1.4 Outline
First a background study will be discussed in chapter 2. This chapter starts with describing the water
problem of Enschede and the urban heat island effect. Secondly, previous work on the Smart Rainwater
Buffer and Air Temperature Monitoring graduation projects in relation to data storage will be
discussed. Thirdly a literature review regarding different types of databases and storage of geospatial
data is discussed, after which a state of the art review describes 4 different database management
systems and their geospatial functionalities. Chapter 3 describes the methods and techniques used in
this graduation project. Chapters 4, 5, 6, and 7 contain the results of the Creative Technology design
process, which are the concept, requirements, functional architecture, and the final prototype. Chapter
2. Background Research
This chapter introduces the situation in Enschede regarding its water problems and the heat island
effect as the context of this research. Thereafter previous work on the SRB and AirT projects will be
discussed. Thirdly the conducted literature review as well as a state of the art review is discussed.
2.1 Background
2.1.1 Enschede’s water problem
The changing climate has an effect on the frequency and intensity of rainfall in certain periods during
the year. Periods of intense and heavy rainfall are alternated with longer periods of draught and heat
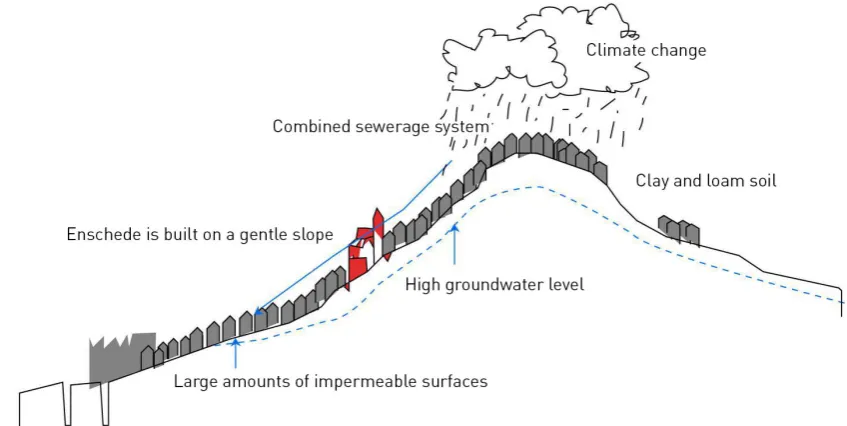
waves. Enschede faces some problems managing the amount of water in case of heavy rainfall. There
are four main reasons for the issues Enschede has with managing heavy rainfall, of which some are
visualized in figure 2.1. First of all the city is built on a moraine, causing for a difference in height of
approximately 44 meters. Enschede is built over several natural water sources on this moraine, which
would naturally dispose of water continuously and gradually. However, due to the increase of hardened
surface of the city, a very high volume of water flows during heavy rainfall in a short period of time
[3]. Secondly, Enschede has a rich history of textile industry. The decline of this industry in Enschede
has caused for factories that existed to close down, causing the groundwater levels to rise. The third
reason is that most urban brooks that flowed through Enschede have disappeared over the years, as can
be seen in figure 2.2. Finally the city is mainly build on clay ground, which is a poor permeable soil
[image:14.595.82.506.505.718.2]layer.
Figure 2.2: Urban brook system in Enschede of 1900 (left) and 2010 (right). Image by Kennisportaal
Ruimtelijke Adaptatie.
Already several projects have been deployed to improve the cities capabilities in handling heavy
rainfall. Urban brooks are being reconstructed, of which de Roombeek, Beek ‘t Zwering, and de
Stadsbeek are examples [4]. Also wadi’s are used as natural water buffers in case of heavy rainfall [5].
A wadi is a lower area for buffering rainwater, but it can be used by citizens in dry periods. Water
flows to these lower areas during rainfall and is held there so that is can gradually infiltrate the ground.
An example of a wadi can be found in figure 2.3a. Furthermore, green roofs (figure 2.3b) are used to
temporarily store rainwater and slow the drainage of the water from the roofs, a reservoir called
Kristalbad has been realized which can store approximately 187.000 m3water, and a huge water buffer will be constructed underneath de Oldenzaalsestraat.
Figure 2.3a: Example of a wadi Figure 2.3b, Example of a green roof
2.1.2 Urban Heat Island Effect
Periods of heat can have severe negative effects on the health and wellbeing of people. The
island effect (UHI) [6]. This effect means that the temperature in urban areas is higher than its
surrounding areas, as depicted in figure 2.4, and has (potentially) serious consequences for the health
and wellbeing of the citizens. Consequences of UHIs are increases in peak energy demand, degradation
of air quality, increased thermal stress on residents, strong impact on urban ecosystems, and a
significant increase in the level and risk of morbidity or illness caused by heat.
The primary cause for the UHI effect is urbanization. This means the increase of building
density and the amount of hardened and heat absorbing surfaces, and the decrease of natural vegetation.
Also the rise in city temperature causes for an increase in the use of air conditioning systems, which
in turn dissipate heat into the city air. In order to increase knowledge of the UHI effects on Enschede,
the municipality wants to monitor temperature throughout the city by deploying several sensors.
Figure 2.4:Visualization of the urban heat island effect. Image by tallsay.com.
2.1.3 Sub-projects
In this section each of the CAC sub-projects will be explained in short, excluding the data repository.
SRB
The primary goal of the SRB project is to buffer rainwater in case of heavy rainfall to reduce the strain
on the sewage system. The buffering will be done by a smart rainwater buffer which in this phase of
the project will be owned by citizens of the municipality of Enschede. In order to buffer and dispose
rainwater autonomously, the SRB will use sensors to provide the system with the water level and water
temperature measurements. The dashboard for the users will contain visualizations of the data
AirT
The AirT project consist of multiple sensor nodes deployed in the Enschede, of which the produced
data will be used by the municipality of Enschede and researchers of the University of Twente to gain
insight in the urban heat island effect in Enschede.
RPS
For the reference precipitation system, a Lambrecht precipitation sensor will be used. The data
produced by this sensor will be used to give insight in the smart rainwater barrel performance and for
historic precipitation.
2.2 Previous Work
This section covers previous graduation projects regarding the Smart Rainwater Buffer and Air
Temperature Monitoring, with focus on data storage.
2.2.1 Smart Rainwater Buffer
In 2016/2017 Felicia Rindt [7] and Gelieke Steeghs [8] worked on the development of a smart
rainwater buffering system. As a functional requirement they state that the data generated by the buffer
should be store in a central database. They use a Raspberry Pi 3B as server to host the database. A
relational database management system has been used, namely MySQL.
The database consists of 7 tables, of which a detailed view can be found in figure 2.5. The user
table holds the user’s id, name and address. The water buffer table describes a single buffer, holding
an id, location, capacity, planned discharge id, datetime heartbeat, update time, default output valve
and future volume refill. The discharge table consists of a planned discharge id, start date and time,
and the planned discharge amount. The discharge command table contains data on a discharged amount
by the citizen. It holds the unique discharge command id, the discharge buffer id, the amount, the
discharge status, the discharge creation date and time, and the valve used for the discharge. The
waterflow table holds the cumulative output flow for a valve on a single buffer. The buffer information
table contains the water level in the buffer on a certain moment in time. Lastly, the event table contains
Figure 2.5: Table structure of the current SRB database [6]
2.2.2 Air Temperature Monitoring
For the AirT graduation project, Yoan Latzer [9] and Tom Onderwater [10] have investigated several
communication techniques to transfer the sensor data to a central server. They decided to use The
Things Network (TTN), which is an open source Internet of Things focused network for low
powered devices using the LoRaWAN protocol. A Python script collects the data from an online
TTN application using the MQTT protocol and writes the data to the database’s main table, the
measurement table. A second table holds a list of all deployed sensor nodes, in order to easily return
a list of sensors for data formatting. This measurement table contains the following fields:
• measurement_type: In their project the only measured data was Temperature, so this
field was manually set to Temperature. They do state that other types of
measurements could be incorporated in the future.
• device_id: A unique identifier for each device, provided by the TTN metadata. • value
• latitude • longitude
• year • hour • minute
A relational database management system has been used. Furthermore, a Django server is used to
communicate with the database, as can be seen in figure 2.6. The Django framework does not
[image:19.595.196.407.238.462.2]officially support NoSQL databases [11].
Figure 2.6: Application structure for the air temperature monitoring project [9].
There were some performance issues loading the webpage. Thee page loading delay was caused by a
the application requesting the full measurements table data.
2.2.3 Conclusion
Following from previous work it can be concluded that limited research on data storage has been done
in the context of the CAC Enschede project.
2.3 Literature Review
2.3.1 Introduction
Data plays an increasingly important role in a large variety of projects, like smart cities, which more
and more incorporate internet of things applications and internet connected devices. City
improvements in various sectors, like water- and sewage management, city temperature monitoring
and prediction, traffic reduction, energy saving and improving overall quality of life for its citizens
[12]. The increasing amount and heterogeneity of sensor data is accompanied with challenges in
managing and storing these large volumes of data.
For the CAC Enschede a data repository has to be developed, which lays at the center of several
sub-projects. These projects are the Smart Rainwater Buffer (SRB), the Reference Precipitation
System (RPS), and Air Temperature Monitoring (AirT), and also accompanied data visualizations in
user interfaces. For the data produced and used by the sub projects, the location of the sensor nodes
are of great value. Visualizing UHIs requires location based visualization. For the smart rainwater
buffer, the location is very important as well. In order to reduce the strain on the sewage system, it is
necessary to know where rain will fall first and in what sequence the buffers should be emptied.
The total number of sensor nodes producing location based data is very likely to increase above
10.000 in the future. Therefore, exploration of possibilities for geo-tagged data processing, storing,
and managing is needed. This literature review aims at giving an overview of characteristics, and pros
and cons of several database types, database management systems and geospatial possibilities in the
context of the CAC project.
The main question to be answered in this literature review is: what solutions do exist for
managing and storing large volumes of geo-tagged date? This question will be answered by addressing
the following subtopics, namely: what database types exist, what are their characteristics, and what
is a possible solution concerning storage of location based data. Scientific literature will be used to
answer the research question and sub questions, postulated in section 1.3.
2.3.2 Types of databases
Since the mid 1960’s, data has been primarily stored in relational databases. Because they use SQL as
their querying language, they are also known as SQL database systems [13]. Data is becoming more
and more important nowadays and finds an increasing amount of possible applications. The internet
of things is a fast growing concept. The amount of generated data increases along with the growth in
the value of data and internet connected applications. This growth in generation of data has caused for
two new classes of database management systems to emerge, non-relational and new-relational data,
better known as NoSQL and NewSQL databases respectively [13]. Which type of database is most
suitable, is highly dependent on the application requirements [14]. In order to make a good decision
based on the application requirements, understanding of the key characteristics of the different types
SQL
The first and often called traditional database management system is SQL. SQL database management
systems have since the start been used to store large amounts of data in fixed schemas [13]. The
relational model has been thoroughly studied, is well understood, and has for long provided a high
level of consistency and efficiency [15]. Data is stored in tables in a traditional row and column format.
Stored data is organized in relations, using keys to link data in different tables together. SQL database
management systems adhere to the so called ACID properties. ACID stands for Atomicity,
Consistency, Isolation, and Durability. By adhering to these properties, database management systems
handle concurrency in transactions, ensuring the integrity of the data. The ACID model is standard,
efficient, and reliable and its properties are very important characteristics of a SQL database
management system [13]. SQL systems scale vertically. This means when scaling up, the centralized
storage and processing capacity have to be increased by upgrading the hardware [15]. The current
CAC project has structured data, thus the SQL class of databases could be a good fit.
NoSQL
Scalability and a decrease in performance when the dataset grows very large in SQL systems caused
for the need of another solution. NoSQL emerged as a possible system with the main intention to
improve scalability and performance issues encountered with traditional SQL systems. Database
management systems based on NoSQL are non-relational. These databases have no fixed schemas and
can therefore handle a wide variety of data [13]. NoSQL database management systems are also called
document base systems, storing data as documents in formats likes XML and JSON [15]. NoSQL
systems are not expected to substitute the relational based SQL system, but can outperform a SQL
system when a document based system better fits the requirements. However, improvement in
performance comes at a cost. R. Sánches et. Al [15] state that non-relational systems do not offer
support for join operations and do not fully adhere to all ACID properties. However, S. D. Kuznetsov
and A.V. Poskonin [16] state that NoSQL stands for all non-relational database management systems.
The term therefore also incorporates earlier non-distributable and ACID compliant systems.
Distribution means that these systems scale horizontally. By decentralizing the database, the storage
can be distributed over multiple data centers and multiple CPUs can be utilized at the same time,
improving query performance [15]. When in the future the CAC project is fully deployed, distributing
the database over different municipalities could be a good way to greatly improve and maintain
performance, but this introduces an increase in complexity for the unstructured way of storing the data.
Furthermore, a drawback of this type of database management system is that is does not offer full
NewSQL
Both SQL and NoSQL have their drawbacks. A system that tries to bring together the best of both
worlds is NewSQL. NewSQL, also referred to as the modern relational model, keeps the relational
property of traditional relational database management systems. The difference with the traditional
system is that NewSQL incorporates NoSQL solutions as well [13] [17] [18], like scalability and high
performance. NewSQL is claimed to be a very capable database management systems specifically for
the increasing amount of internet of things data [13]. NewSQL databases primarily use SQL querying
language, adhere to the ACID properties for transactions, have an architecture offering higher
performance than traditional relational database management systems, and have the possibility to run
on a large number of nodes without suffering from bottlenecks [17]. Most NewSQL database
management systems use in-memory storage of data, resulting in higher performance compared to
SQL as well as NoSQL databases [13] [17] [18]. According to K. Grolinger et. al. [19], using NewSQL
systems is in general suitable in circumstances where additional scalability and performance is required
from traditional database management systems. NewSQL could be a fitting solution in the future when
the CAC project grows amongst the entire Vechtstromen district, which will likely require higher
performance capabilities from the system than the initial pilot project.
2.3.3 Geospatial data
The data that will be generated by the CAC projects is location based. This means that the data
repository solution has to offer support for geo-tagged data and location metadata to indicate the area
type of the location. Several approaches can be used to realize storage of geospatial data.
A four layer framework is proposed by S. Luan et. al. [20], consisting of a geography node
using R-tree indexing, a logical node, an application node, and a storage node. The geography node
describes the location and shape of a place, to express location information more accurately compared
to the geometric point based representation [20]. However, this framework utilizes a hybrid SQL -
NoSQL approach and introduces an unnecessary amount of complexity to the project.
There exist database management systems specially designed for storing and querying spatial
data, namely spatial database management systems. These systems usually are a regular system,
extended with spatial capabilities. They also extend the mature querying language SQL, then called
spatial querying language, and offer spatial querying features [21]. In order to provide efficient
querying of spatial data, which is of high importance within the project, spatial indexing is required.
R-tree indexing is the most widely used method for managing spatial data objects [22]. An open source
GiST (generalized search tree), offering robust spatial indexing. Performance of PostgreSQL
compared to the NoSQL database system MongoDB, is sufficient [23]. Both implementations have
different overall characteristics, and performance differs depending on the type and amount of
simultaneous read/write operations. Again, choice of database management system is highly dependent
on system requirements. As said before, Spatial Database Management Systems are usually not an
independent software solution, but serve as an extension to existing database management systems like
PostgreSQL or MySQL [24].
The PostGIS extension for the PostgreSQL database management system is open source, has
the largest user base, and offers the most complete implementation of OGC’s Simple Feature
Specification (a standard for mostly two dimensional geometrics) of any free and open source database
management system [24]. However, in order to make a definite decision, both a clear overview of the
requirements for the CAC project has to be acquired, as well as further exploration of spatial
possibilities of NoSQL and NewSQL database management systems.
2.3.4 Conclusion
Regarding the question what solutions do exist for managing and storing large volumes of geo-tagged
data, an overview of different database management systems was provided as well as possibilities for
storing geospatial based data. Caused by an increase in the amount and importance of data and
applications generating data, two new types of database management systems have arisen: NoSQL and
NewSQL. Database management systems can be categorized in being relational (SQL) and
non-relational (NoSQL). The former being based on the traditional and most mature model, the latter
offering a new solution to immense volumes of data and performance, but with a tradeoff in one or
more of the ACID properties. Next to the traditional relational and non-relational database
management systems SQL and NoSQL respectively, a so called modern relational system has
emerged. NewSQL offers the possibility for distributed nodes, storing relational data in-memory
instead of on-disk. This means an increase in performance capabilities comparable to NoSQL, whilst
adhering to the ACID properties and the relation model used in SQL systems.
Since the choice for a database management system is highly dependent on the requirements
for system, clearly specifying these requirements in the next phase of the project is needed in order to
decide which system to use. Furthermore, sufficient research exists on SQL based solutions for storage
2.4 State Of The Art Review
In this chapter first the Simple Features Access of the Open Geospatial Consortium [25] will be
described. Second, a description of different database management systems and their possibilities for
storing geospatial data is provided, in order to be able to compare geospatial support and performance
of the different systems. As stated in the literature review in section 2.3.3, the PostGIS extension of
PostgreSQL offers a very good and reliable solution for storing geospatial data. However, performance
comparisons have shown that NoSQL and NewSQL systems are likely to have higher performance
than SQL systems, and offer better scalability [23]. Overall the CAC project will be write intense as
compared to reads, thus next to support for geo-tagged data storage, performance is an important
preliminary requirement as well. Therefor the performance of PostGIS, MySQL, MongoDB, and
VoltDB, as well as their geospatial features will be examined.
2.4.1 PostGIS
PostGIS is an extension of PostgreSQL, making it a spatial database management system by adding
support for geographical objects and location querying in SQL. It claims to offer a large set of features,
of which many are rarely found in other spatial databases [26]. PostGIS offers full support of the Open
Geospatial Consortium Simple Features standard.
PostGIS supports geography and geometry objects. Geography is a new datatype. It allows for
the storage of data in latitude/longitude pairs and supports long range distance measurements, because
no projection on cartesian spatial reference systems is done which often don’t represent the entire earth,
but it comes at a cost. Most computations on geography are slower, there are fewer functions defined
on geography than on geometry, and these functions require more CPU time to execute.
Geometry is the best fit if all data fits in a single spatial reference system representing for
instance only the Netherlands, or a lot of spatial processing is required, such as clustering of
geometries. If the data is contained in a small area like a municipality, using geometry and appropriate
projection is the best solution both in terms of performance and available functionality.
Relevant Functions
The AirT and SRB projects will cover the area of the municipality of Enschede. Eventually, the SRB
is expected to cover the area covered by the Vechtstromen water authority. With this in mind, some
relevant functions and geometry types of PostGIS are explained below. For a complete list of PostGIS
features, see Appendix A.
of which the size and shape is important. Examples given are city limits, parks, building footprints,
and bodies of water. The concept of polygons is included in most graphics systems.
Collections can be used to group simple geometries into sets. These are useful for modeling real
world objects, like the smart rainwater buffers, as spatial objects. Supported collections are the
MultiPoint, MultiLineString, MultiPolygon, and the GeometryCollection, which are a collection of
points, linestrings, polygons, and a heterogeneous collection of any geometry respectively.
Querying collections of data from multiple sensor nodes of a certain area of the city, is a
preliminary requirement of the system. Spatial databases have the ability to compare relationships
between geometries. Some functions provided by PostGIS include ST_Equals, which returns TRUE if
two geometries are of the same type and have the same x, y coordinate pair. ST_Intersects, ST_Disjoint,
ST_Crosses, and ST_Overlaps are functions that check whether two geometries of equal or differing
types have space in common. ST_Within and ST_Contains check whether a geometry is fully contained
within another geometry. In order to return geometries within a certain distance of for example a point,
the function ST_DWithin provides an index-accelerated boolean test; hence calculation of an actual
buffer is not necessary. Spatial Joins are supported and provide the functionality to combine
information from different tables, using the spatial relationship as key.
Ensuring performance when the dataset grows is very important. Searching the table rows in
sequential order becomes an issue with tables exceeding a few thousand rows. Indexing the dataset is
a solution to improve performance. Spatial indexing is claimed to be one of the greatest assets of
PostGIS. PostGIS uses R-tree indexing on top of GiST indexing. R-tree indexing means breaking up
data into rectangles, which in turn break up in sub-rectangles, which again break up in sub-rectangles,
etc. GiST, or Generalized Search Tree, indexing, breaks up data into things on one side, things that
overlap, and things that are inside. Spatial indexes greatly improve spatial query performance of the
spatial database.
2.4.2 MySQL
Compared to the PostgreSQL – PostGIS combination, MySQL offers a less complete set of Simple
Features and the documentation is less extensive. The supported spatial data types are geometry, point,
linestring, polygon, multipoint, multilinestring, multipolygon, and geometrycollection [27]. Spatial
indexes are implemented using R-tree indexing only. MySQL does not offer support for rasters which
are very useful for the creation of heatmaps. Also topology, geocoding, address standardization, and
aggregate functions are not supported. Geocoding is the transformation of a description of a location,
like a coordinate pair or an address, to an actual place on the earth’s surface. Some aggregate functions
Linestring from point geometries, returning the union of geometries, and creating a polygon
GeometryCollection from linework of a set of geometries.
Another drawback of using MySQL as a spatial database management system, is space
operation. For example, the PostGIS function ST_Contains will return all geometry types within
another geometry, like points within a polygon. MBR_Contains on the other hand, a comparable
MySQL function, only supports geometry within the minimum bounding box of another geometry,
like a polygon. See figure 2.7 for a visual representation of this difference.
Figure 2.7: Differences in spatial querying functions of PostGIS and MySQL
2.4.4 MongoDB
As previously stated in the literature review, MongoDB belongs to the non-relational database class,
also called NoSQL. The main difference between SQL and NoSQL is adherence to the ACID
properties, which ensure transactions to fully take place or not take place at all, handle concurrent
access, and ensure durability of the data in case of a crash or power loss. As said before, SQL systems
store structured data in a predefined table based schema, using keys to define relations between tables.
NoSQL systems allow for the storage of unstructured data. It does so by storing key-value pairs in
JSON like documents. Similar documents can be stored in a collection, which is comparable to a table
in SQL. Due to the more flexible data structure of NoSQL, it is easier to make mistakes. Next to the
lack of ACID adherence, NoSQL has no equivalent for the JOIN functionality of SQL systems. With
SQL, JOIN offers the possibility to query related data using a single SQL statement. Taking the SRB
project as example, obtaining the water level of all smart rainwater buffers in SQL would be possible
in a single SQL statement, combining the water_buffer and buffer_information tables of figure 2.5
using JOIN. In order to obtain the same result in a NoSQL system, the retrieval of all water_buffer
buffer_information entries are related to a water_buffer; i.e. the deletion of a water_buffer is not
permitted if one or more buffer_information entries are associated with the water_buffer. Such
integrity rules are not available to NoSQL systems, since they allow storage of any data regardless of
other documents. NoSQL systems trade-off the lesser data integrity with higher scalability and
performance, due to the denormalized way of storing data.
In MongoDB geospatial data is stored in GeoSON objects. Supported objects include Point,
Linestring, Polygon, MultiPoint, MultiLineString, MultiPolygon, and GeometryCollection [28].
Geospatial queries on GeoSON objects are calculated on a sphere. It is possible to use two dimensional
indexing with MongoDB, allowing querying of flat surface data. The list of supported query operators
is rather short, especially when compared to PostGIS. Assuming two dimensional non-spherical
indexing, the provided query operations are $geoWithin, $near, and $nearSphere. Respectively this
means the selection of geometries within a bounding GeoSON geometry, returning geospatial objects
ordered by the distance to a point, and returning geospatial objects ordered by the distance to a point
on a sphere.
2.4.5 VoltDB
VoltDB belongs to the relational database class. It is a NewSQL database management system. As
stated in the literature review of section 2.3. NewSQL aims at combining the best of both worlds into
a new type of database. The best of both worlds meaning the structured relational storage schema, SQL
language, and ACID adherence of SQL, and the scalability and performance of NoSQL systems.
Regarding the support for geospatial data, VoltDB lacks behind. Especially when compared to
PostGIS. VoltDB supports only two geospatial datatypes, namely GEOGRAPHY and
GEOGRAPHY_POINT [29]. The GEOGRAPHY_POINT represents a single point on earth which is
defined by the latitude/longitude pair. The GEOGRAPHY datatype represents a bounded region of the
earth and is defined by one or more polygons. Provided functions are AREA(), CENTROID(),
CONTAINS(), and DISTANCE(). Respectively they return the area of a region, the center point of a
region, whether a region contains a certain point, and the distance between a point an a region or two
points.
2.5 Conclusion
The previous research regarding the data storage of the SRB and AirT projects was certainly limited.
Therefor a literature and state of the art review was conducted to elaborate on the different possibilities
In the conducted literature review in section 2.3, an overview of different database types and
characteristics was provided. The conclusion drawn from this literature review is that of all open source
and free database management systems, the PostgreSQL extension PostGIS provides the most
complete list of features regarding geospatial support. However being a SQL type of database, some
issues arise regarding scalability and performance as compared to NoSQL and NewSQL database
systems.
In the state of the art review of section 2.4, several database management systems of different
database classes were investigated. In the relational class regarding the SQL database type, the
PostgreSQL extension PostGIS and MySQL were discussed. Regarding the non-relational NoSQL
database type, MongoDB was discussed. Finally, the relational NewSQL database management system
VoltDB was discussed. The state of the art review showed similar results as compared to the literature
review. PostGIS had by far the most extensive set of features supporting geospatial data. PostGIS being
completely free and open source is a big plus, as well as its extensive documentation and large user
community. MySQL, MongoDB and VoltDB all offer community as well as enterprise solutions, and
have a less rich set of supported geospatial features.
Each discussed system has its advantages and disadvantages, mainly regarding data integrity,
geospatial data support, scalability, and performance. As was concluded from the literature review,
choosing a database type is highly dependent on the system requirements. Further research is needed
in order to determine a suitable data repository solution for the Climate Adaptive City Enschede
3. Methods and Techniques
This chapter describes the methods and techniques used for this bachelor thesis, in context with the
research subject.
3.1 Interviews
Interviews with stakeholders will be used to determine and verify the (preliminary) requirements.
Interviewing can be done by applying different types of interviews. Four of these types of interviews
are explained below [30].
Structured interviews
With structured interviews, the questions are created prior to the interview and are the same for each
respondent. The questions are mostly close ended and there is usually not much room for variation in
responses. The interviewer has a neutral role, acting casual and friendly, and does not insert his or her
own opinion.
Semi-structured interviews
Semi-structured interviews take place in formal setting. The difference with a structured interview is
that the interviewer develops and follows an interview guide with topics that have to be addressed in
the interview, usually in a particular order. The interviewer is allowed to deviate from the guide when
he or she feels it is appropriate.
Unstructured interviews
Again this type of interview takes place in a formal setting, with both the interviewer and respondents
being aware that an interview is taking place. There is no structured interview guide, but the
interviewer does a plan regarding the focus and goal of the interview. The questions are usually open
ended and have low control over the respondents answers, allowing the respondents to open up.
Informal interviews
The interviewer talks with respondents informally, without the use of an interview guide. The
conversation has to be remembered by the interviewer, and he or she can make notes to help recall the
3.2 Design process for Creative Technology
The bachelor program Creative Technology aims to teach students to develop new and innovative
products. It is a multidisciplinary program with the goal to produce engineers that are able to act as a
“bridge” in multidisciplinary teams, which means being able to speak the language of different
engineering disciplines, such as for example industrial design, interaction design, electrical
engineering, and computer science. According to A. Mader and W. Eggink [31], design within the
Creative Technology field lies between user centered design and classical engineering design
approaches. They propose a Creative Technology specific design method, consisting of four phases,
namely ideation, specification, realization, and evaluation as can be seen in figure 3.1. In the following
[image:31.595.153.447.305.725.2]sections each phase will be explained in relation to their use in this thesis.
3.2.1 Ideation
The Creative Technology design process starts with a design question, which in this case consists of
the research questions stated in chapter 1. In this first phase of the design process, user
needs/stakeholder requirements and technology can be starting points or motivational forces. The
ideation phase in context of this graduation project will have technology as the starting point, primarily
using multiple existing technologies as source of inspiration. Preliminary project requirements will be
elicited from the stakeholders by the use of (informal) interviews and brainstorm sessions. These
methods will are explained in section. The inspiration from looking at existing technologies and the
preliminary requirements will be used to come up with a more elaborated project idea at the end of the
ideation phase. Looking at the possible results of the ideation phase, an experience idea, interaction
idea, product idea, service idea, and business idea as can be seen in figure 3.1, a service idea is likely
to be the result. This is because this graduation project will provide data storage, data access, and
geospatial analysis functionality as a service to the SRB and AirT projects rather than being an
experience, interaction, product, or business idea.
3.2.2 Specification
Starting with where the ideation phase ends, a creative idea which in the case of this graduation project
will be a service idea, the specification phase further explores the influence that user experience and
functional specifications have on each other by using multiple prototypes. Short evaluation and
feedback loops are used in order to determine shortcomings and strengths of prototypes, after which
prototypes can be discarded, improved, or combined into new prototypes. By using the short evaluation
and feedback loops it is also possible that new functional requirements arise, which can then possibly
result in new prototypes. Driving factor in this phase is the user experience. Prototypes are often
reduced to one or a few parts of the future product, each part being responsible for a certain part of the
user experience. At the end of this phase the requirements for this graduation project will be final. In
order to finalize the preliminary requirements, they need to be verified with the stakeholders of this
project by the use of (informal) interviews and brainstorm sessions. The specification phase results in
a complete service specification with which the realization phase will be started.
3.2.3 Realization
The realization phase starts with the conclusion of the specification phase, which is a complete service
specification. This specification will be decomposed into subcomponents by looking at different the
functionality in more detail. The separate components are then realized and integrated into one
prototype. Some functional testing will have to be done in this phase to validate whether the end service
of a prototype meets the project’s functional specifications. This will be done by writing applications
simulating components of the stakeholder’s projects. More extensive functional testing will be done
in the evaluation phase.
3.2.4 Evaluation
Evaluation is the final phase of the Creative Technology design process. Although some functional
testing has usually already taken place in the realization phase, further functional testing will be done
in the evaluation phase in order to check whether all functional requirements are met. Also user testing
can be used to check whether the user requirements and the intended experience are satisfied by the
design decisions that were made during the project. Since there are no direct end users involved in this
project, the main focus will be on testing the functional requirements. The testing done in this phase
will be more extensive as compared to the functional testing in the realization phase. Next to testing
the prototypes functionality, also the performance and storage capacity requirements will be tested.
This will be done by writing applications simulating multiple data producing and consuming clients
and analyzing measurements done on the system’s performance and the amount of produced data.
3.3 Stakeholder Analysis
The approach for analysis of the stakeholders proposed by Sharp et al. [32] will be used, together with
a power versus interest grid [33]. Sharp et al. [32] state multiple definitions for the term stakeholder,
of which the following is believed to best describe the term in context of this graduation project:
“System stakeholders are people or organizations who will be affected by the system and who have a direct or indirect influence on the system requirements”. [34]
First the stakeholders for this project will be identified by brainstorming, after which categorization
will be done. H. Sharp et al. [32] distinguish between two types of stakeholders, namely baseline- and
satellite stakeholders. For this project the focus will be on the baseline stakeholders, since they interact
with the system directly. Baseline stakeholders will be divided into two meta group roles, namely that
of producer or consumer. Also, baseline stakeholders will be assigned one or more of four types,
namely users, developers, legislators, and decision-makers. After that, individual roles within the meta
on a power versus interest grid, to determine which stakeholders to manage closely and which to just
keep up to date.
3.3.1 Stakeholder roles
As mentioned in the previous section, the baseline stakeholders will be divided into the meta role group
of either producer or consumer. Producer stakeholders produce information and provide this to the
system. Consumer stakeholders retrieve, process, and use information from the system.
3.3.2 Stakeholder types
The types that can be assigned to a baseline stakeholder are that of user, developer, legislator, and
decision-maker. Users are defined as the people, groups, or companies who interact with and control
the system directly, and those who will use the products of the system such as information. Developers
are stakeholders in the requirement process as well as the users, but have a different role in the
requirement specification and the system itself as compared to the users. Roles within the developers
baseline group could be for example analysts, designers, programmers, and project managers. Two
examples of the legislator baseline type are professional bodies and government agencies, and finally
the decision-makers are development team managers, user managers and financial controllers. The
legislators and decision-makers can affect development and operation of the system by guidelines for
operation, such as guidelines for costs, performance, security, and privacy.
3.3.2 Stakeholder prioritization
Next to categorization, each of the stakeholders will be placed on a power versus interest grid, of which
an empty example can be seen in figure 3.2. The y-axis indicates the power a stakeholder has, ranging
from low power to high power from bottom to top. The power indicates the amount of influence a
stakeholder has on the development of the system. The x-axis indicates the stakeholder’s interest in
the development of the system, ranging from low interest to high interest from left to right. The
diagram is divided into 4 equal sized sections. The sections are:
• Monitor (minimum effort) –low power and high interest • Keep satisfied – high power, low interest
• Keep informed – low power, high interest • Manage closely – high power and high interest
Depending on the combination of the power and interest, a stakeholder is placed in one of the four
Figure 3.2, An empty power versus interest grid [33]
3.4 Requirement Analysis
The requirements will be determined by informal interviews with the stakeholders (see section 3.1).
The requirements will first be categorized in functional and non-functional requirements. After that
further categorization will be done using the MoSCoW method, which is explained in section 3.4.1.
Functional requirements will describe functionality and behavior that the system should provide, and
the non-functional requirements will specify the quality attributes of the system. The MoSCoW
method is explained in the next section.
3.4.1 MoSCoW
In order to categorize the (non-)functional requirements, the MoSCoW method will be used.
Categorization will be done by specifying the requirements as must have, should have, could have,
and won’t have requirements. All must have requirements must be included in the final solution. They
are the most critical requirements that must be implemented within the current timeframe of the project.
Should have requirements are important as well, but not as critical within the current project timeframe
as must have requirements. These requirements should be implemented as much as possible after the
solutions meets the must have requirements. A could have requirement is desirable, has lower priority
than a should have requirement, and should only be implemented if it fits within the current timeframe
important requirement. Won’t have requirements will either not be implemented at all, or possibly
reconsidered for future work.
3.5 Scenarios
Scenarios will be constructed to describe how each of the clients will interact with the system, and to
further specify their needs and the preliminary requirements. In order to construct these scenarios from
both a user’s as well as a designer’s perspective, the PACT framework together with FICS will be
used.
PACT Analysis
PACT analysis can be used to describe the user’s perspective and to structure the construction of
scenarios by identifying activities of people in different contexts and using different technologies.
PACT stands for People, Activities, Context, and Technologies [35].
People
The people part of the PACT analysis for this project will consist of the different roles that the
stakeholders have.
Activities
Each individual role of the stakeholders is accompanied with specific activities in interacting
with the project. These activities are very important in constructing useful scenarios that
describe the user’s perspective.
Context
The context will describe the context in which the activities are performed.
Technologies
The technologies part focusses on the in- and output of data, the content, and communication.
FICS
FICS will be used to describe the designer’s perspective, and stands for functions and events,
4. Ideation
This chapter describes the ideation phase of this graduation project.
4.1 Stakeholder Identification and Analysis
4.1.1 Identification
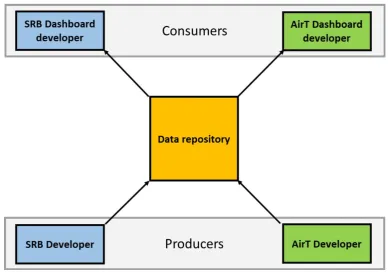
First all stakeholders have been identified by brainstorming and drawing a scheme of the total CAC
project, which can be seen in figure 4.1. As said in chapter 1, the CAC project consists of the following
(graduation) projects excluding the data repository:
• SRB
• AirT • RPS
Descriptions of each of the projects can be found in section 2.1.3.
The SRB project consists of a team of three, namely Jeroen Waterink, Thijs Dortman, and Sefora Tunc.
Sefora will not be considered to be a baseline stakeholder for this project since she focusses on the
D.I.Y. assembly instructions of the SRB and doesn’t interact with the project directly. The other two,
Jeroen and Thijs, focus on the design of a modular smart rainwater buffer and a user dashboard
respectively. The other project, AirT, consists of a team of 2, Laura Kester and Adam Bako, of which
both are considered baseline stakeholders within this graduation project. Laura Kester focusses on the
design of a sensor module and Adam Bako deals with the visualization of the sensor data. Thijs works
on the RPS as well, deploying a Lambrecht precipitation sensor.
Three other stakeholders exist within this graduation projects. These are the municipality of
Enschede, the Vechtstromen water authority, and the University of Twente. They don’t interact with
system directly, and hence they’re not considered to be baseline stakeholders within this project.
As has been said in section 3.3.1, the baseline stakeholders will be divided into the grouped
role of either producer or consumer. Within the grouped role, the baseline stakeholders are assigned
individual roles. The projects of Jeroen and Laura will both produce data. Therefore Jeroen and Laura
will both be assigned the grouped role of producer. Their individual roles are that of SRB developer
and AirT developer respectively. Thijs and Adam’s projects will consume data and are therefore
assigned the grouped role of consumer. Their individual roles will be that of SRB dashboard developer
and AirT dashboard developer respectively. Thijs will also have the role of RPS developer, since he
Figure 4.1 The CAC project from the data repository’s perspective
In figure 4.1, the baseline stakeholders are grouped per project and per meta role group. On the left
and indicated by blue are the SRB stakeholders and on the right and indicated by green are the AirT
stakeholders. As said before, the RPS stakeholder is indicated by purple. Next to the grouping by
project and specific individual roles, these stakeholders are grouped by their meta role in the CAC
project, indicated by the grey boxes.
4.1.2 Categorization and prioritization
To give a clear image of the types of stakeholders, the baseline stakeholders are categorized using the
baseline stakeholder types: users, developers, legislators, and decision makers (see section 3.3.2).
Table 4.4 contains a list with this categorization. Next to categorizing the stakeholders, they are placed
on a power vs. interest grid to give an indication of the power and interest each of the stakeholders
Table 4.4 Stakeholder categorization
Stakeholder Type
SRB developer User – developer
SRB dashboard developer User – developer
AirT developer User – developer
AirT dashboard developer User – developer
RPS developer User – developer
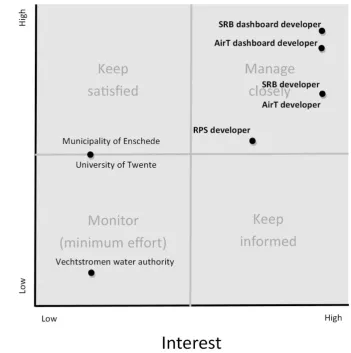
On the power vs. interest grid in figure 4.3, the baseline stakeholders are indicated by the bold text.
Although the municipality of Enschede, the Vechtstromen water authority, and the University of
Twente are not considered baseline stakeholders in this project, they are included in the power vs.
interest grid to give an indication of their power and interest in this project.
The municipality of Enschede and the University of Twente are placed on the border of the
keep satisfied and monitor boxes of the grid. Due to their indirect influence via the baseline
stakeholders, their interest in this specific project is considered low and their power medium. The
Vechtstromen water authority cooperates with the municipality of Enschede, has low power and
interest and is placed in the monitor box.
All baseline stakeholders are placed in the manage closely box. A top-down approach will be
used to determine the dataset that is needed by the consumers (see section 4.2.3). This means that the
dataset that needs to be produced by the producers will be determined by the dataset needed by the
consumers. Therefor the SRB and AirT dashboard developers are placed higher on the power axis of
the grid than the SRB and AirT developers. Their interest in this project is considered to be equal,
since both producers and consumers will have more or less equal dependency on the data repository.
The SRB dashboard developer is placed a bit higher on the power axis than the AirT dashboard
developer, because it’s expected that the SRB project will require more from the repository’s
functionality than the AirT project.
Finally, the RPS developer is considered to have less power and interest than the SRB and AirT
projects, since this is an additional non-graduation project which will have lower priority for the RPS
Figure 4.3, Stakeholder power vs. interest grid
4.2 Preliminary requirements
The requirements listed in this section are preliminary, since further specification and prioritization of
the requirements will be done in the specification phase in chapter 5. The preliminary requirements
listed in this section will be categorized in functional and non-functional requirements.
4.2.1 Functional requirements
• The system must be able to store geo-tagged data.
• The system must support multiple types of sensor system nodes (SRB, AirT, RPS). • The system must be able to store sensor system node specific characteristics. • The system should be able to provide a .csv formatted download of all raw data.
• The system must be application independent. (support multiple different visualization
applications)
• The system must be able to provide location based data.
• The system must be able to provide specific sensor system node data. • The system should be able to provide street level data.
• The system should be able to provide selected area data.
• The system should be able to provide clustered sensor system nodes data. • The system should be able to provide time based data.
• The system must be able to store sensor system specific events.
4.2.2 Non-functional requirements
• The system must maintain performance with large amounts of stored data. • The system must support clients producing data every 5 minutes minimum. • The system should require low maintenance.
• The system must shield clients from complexity. • The system must be reliable.
• The system must maintain data integrity. • The system must handle concurrency. • The system should be low cost. • The system must be flexible.
• The system must run on a hardware platform
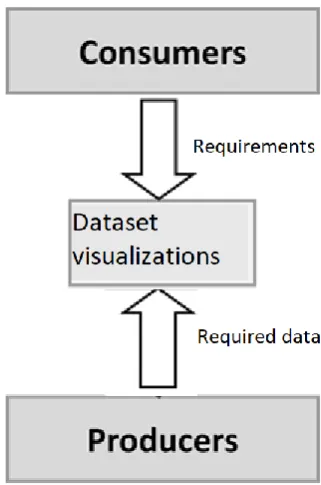
4.2.3 The dataset
A top-down approach is used in order to determine the dataset needed by the consumers for the
visualizations. By informal interviews and brainstorming with the consumers (with the producers
present as well), the preliminary required data was identified and communicated to the producers. See
figure 4.4 for a visual representation of the used approach. The results from the informal interviews
Figure 4.4, Top-down approach to determine data requirements
SRB data
The preliminary dataset needed by the SRB dashboard project is shown in table 4.5. SRB specific
characteristics are needed for calculations and visualizations in the SRB dashboard application:
location and buffer capacity. The current SRB fill level will be used to inform SRB users how much
water is available in their SRB for private usage. The historic amount of buffered rainwater is needed
to compare a SRB user’s buffering performance with other SRB users buffering performances. The
planned discharges are used to visualize what is expected to happen with the buffered rainwater in a
user’s SRB, along with the accompanied predicted precipitation. Regular discharges are used to
visualize what actually happened regarding discharges, again with the accompanied precipitation. The
manual discharges will indicate when buffered water has been drained manually using the water tap.
For legionella and frost warnings, the water temperature is needed. The historic precipitation will be
Table 4.5 Data and units needed by the SRB dashboard project
Data type Unit
Location Latitude - longitude
Buffer capacity Liters
Current fill level Liters
Historic amount of buffered rainwater Liters per time period
(Manual) discharge Date, time, desired fill level in liters,
precipitation in mm/h
Planned discharge Date, time, desired fill level in liters,
precipitation in mm/h
Precipitation predictions for SRB location mm/h
Historic precipitation for users location Per day for past month
Per month for past 2 years
Water temperature Degrees Celsius
AirT data
The preliminary dataset needed by the AirT dashboard project can be found in table 4.6. Again some
sensor system characteristics are important for calculations and visualization: the location and the
skyview factor. This skyview factor is the percentage of visible sky for the AirT location. This means
sky not blocked by for example buildings or trees. This factor will be used to calculate solar radiation.
The data that will be visualized is the air temperature, wind speed, and humidity.
Table 4.6 Data and units needed by the AirT dashboard project
Data type Unit
Location Latitude - longitude
Air Temperature Degrees Celsius
Wind speed m/s
Humidity Percentages
![Figure 2.5: Table structure of the current SRB database [6]](https://thumb-us.123doks.com/thumbv2/123dok_us/9703092.471511/18.595.57.543.72.358/figure-table-structure-current-srb-database.webp)
![Figure 2.6: Application structure for the air temperature monitoring project [9].](https://thumb-us.123doks.com/thumbv2/123dok_us/9703092.471511/19.595.196.407.238.462/figure-application-structure-air-temperature-monitoring-project.webp)
![Figure 3.1 The Creative Technology design process [31]](https://thumb-us.123doks.com/thumbv2/123dok_us/9703092.471511/31.595.153.447.305.725/figure-creative-technology-design-process.webp)
![Figure 3.2, An empty power versus interest grid [33]](https://thumb-us.123doks.com/thumbv2/123dok_us/9703092.471511/35.595.140.430.68.351/figure-power-versus-grid.webp)