Individual differences in Human-Computer Interaction: A
review of empirical studies
Jelmer Kuurstra S1099221
July 2015
Master’s Thesis in Psychology University of Twente
Faculty of Behavioural, Management and Social sciences
First supervisor: dr. Martin Schmettow
Abstract ... 4
1. Introduction ... 5
2. Theoretical background ... 7
2.1. Traits ... 7
2.2. Cognitive style ... 8
2.3. Cognitive and psychomotor abilities ... 8
2.4. Culture ... 9
2.5. Control variables - experience and domain knowledge... 10
2.6. Control variables - age and gender ... 11
2.7. Impact ... 11
3. Method ... 12
4. Results ... 14
4.1. Traits ... 15
4.1.1. Domains... 15
4.1.2. Methods ... 15
4.1.3. Impact ... 17
4.2. Cognitive style ... 19
4.2.1. Domains... 19
4.2.2. Methods ... 20
4.2.3. Impact ... 21
4.3. Cognitive and psychomotor ability ... 23
4.3.1. Domains... 23
4.3.3. Impact ... 27
4.4. Culture ... 29
4.4.1. Domains... 29
4.4.2. Methods ... 29
4.4.3. Impact ... 32
4.5. Experience, domain knowledge, age and gender ... 32
5. Discussion ... 34
5.1. Patterns in individual differences in HCI research ... 34
5.2. Impact ... 36
5.3. Implications for design ... 36
5.4. Issues with current research ... 37
5.5. Gaps in current research ... 39
5.6. Limitations ... 39
Abstract
In the field of Human-Computer Interaction, researchers have found evidence of performance
differences which may be attributed to variation among individual users. User’s traits, cognitive styles,
cognitive abilities, psychomotor abilities and culture have been investigated as levels that could help
explain this variability. This literature review focuses on eleven years of empirical journal publications
on individual differences in HCI in the period of 2004-2014. Using different search terms and criteria,
we included a total of 98 studies to be reviewed. We describe and evaluate studies’ domains, methods
and impact. In addition, this paper presents a number of gaps in current research, implications and
1. Introduction
Researchers have been studying individual differences in psychology for about a century (e.g.
Dawis, 1992). However, in the field of Human-Computer Interaction (HCI) individual differences
were often overlooked in the early years. This broad field of research focuses on interactions between
humans and computers, including studies on users, design and methods to gather user data or to
improve design. In Dillon and Watson (1996) the authors argue that user analysis in HCI could benefit
from the field of individual differences within psychology. They argue that this field appears to be of
use in issues regarding practical design. More specifically, it is argued that work on individual
differences offers the HCI community the chance to create a framework that improves user analysis
and computer systems design. Early work on individual differences within HCI suggests that
performance can differ by a large amount as a result of individual differences. For instance, Egan
(1988) reviewed several studies obtaining completion time measures on text editing, information
search and programming. He states that, for moderately small sample sizes (10 to 30 subjects),
completion times of a text editing task between the maximum and minimum time ranged about 5:1. In
other words, the lowest completion time was five times faster than the highest completion time on the
same task. This variability is thus not due to differences in the task at hand, but due to differences
between individuals. This effect was even more apparent in information search and programming tasks
where the ratios between fastest and slowest completion times were about 9:1 and 22:1 respectively.
This paper reviews contemporary studies on individual differences in HCI to present the reader the
current status of this type of research.
One way to study individual differences in HCI is to study categories of individual difference
that could predict performance and behavioural differences in computer use. In Egan (1988),
mentioned categories include ‘technical’ aptitudes (i.e. spatial and reasoning aptitudes, mathematics
and science achievements), age, experience, domain-specific knowledge and personality. Dillon and
Watson (1996) emphasize the role of cognitive abilities in psychological studies and the potential this
has for HCI. Besides cognitive abilities, potentially influencing factors include personality (traits),
cognitive style and psychomotor ability. Furthermore, there are many studies on the influence of
Regarding design, the idea that computer systems should be accessible and usable for all
people, taking diversity (i.e. different user characteristics, usage contexts, tasks) into account is known
as universal design or design-for-all (e.g. Stephanidis, Antona, & Savidis, 2006). Research on
individual differences focuses on this diversity in the human population. The design for people with
disabilities is often associated with universal design (Stephanidis et al., 2006), but universal design
entails a more broad definition of user characteristics. For designing computer systems, Aykin (1991)
lists three strategies. The first strategy is to design for one uniform user group, which focuses on the
average user and differences between users are not taken into account. The second strategy is to design
different interfaces for different user groups, which can take individual differences into account by
carefully studying user groups. The third strategy is to design an adaptive interface, which is an
automatic adaptation of computer interfaces to the individual user’s characteristics and needs (see also
Benyon, 1993; Jennings, Benyon, & Murray, 1991). A potential fourth strategy, robust design, is
mentioned by Zhou, Heesom and Georgakis (2007). This type of design focuses on creating the
product in such a way that the influence of external variability is minimized. Other implications of
individual differences could, for instance, be that researchers choose their strategies for sampling the
population more carefully, as in many cases it is likely that individual differences exist between
participants.
Nowadays, with many more people using computers and the internet than 25 years ago (cf.
Egan, 1988), a review of recent work on individual differences in HCI could shed light on
contemporary differences. Hence, the present study reviews the literature on individual differences in
HCI of the past decade (2004-2014) to see how the HCI community on individual differences has
evolved after the Dillon and Watson (1996) paper. We explore how and in which domains the HCI
community reports on individual differences and how strongly these individual characteristics actually
influence computer performance. Lastly, we discuss the potential of these categories of individual
difference to guide computer systems design. By making use of Egan’s (1988) and Dillon and
Watson’s (1996) categories and the influence of culture, we will review the HCI literature on
individual differences in the following categories: traits, cognitive style, cognitive and psychomotor
2. Theoretical background
Before describing the methods we used for the literature review, we first describe the
categories of individual difference, and their (potential) relation to computers. We report the most
common dimensions on which people can be described for the categories and some methods for
measuring the impact these dimensions may have in human-computer interaction.
2.1. Traits
Psychologists generally regard traits as internal dispositions that are relatively stable over time
and remain relatively stable in different situations (McAdams, 2009). Over the years, a taxonomical
structure to describe people’s behaviour was developed (for a historical view, see e.g. Goldberg,
1993). This has led to the emergence of five overarching factors of personality traits (i.e. the Big
Five). These factors include: Extraversion, Neuroticism, Openness to Experience, Conscientiousness
and Agreeableness (John & Srivastava, 1999; McCrae & Costa, 1987). Extraversion is related, for
instance, to being warm, talkative, spontaneous and sociable. Neuroticism relates to being nervous,
emotional, insecure and impatient. Openness to experience is related to being creative, imaginative,
curious and daring. Conscientiousness relates to being careful, reliable, well-organized, perceptive and
punctual. Lastly, Agreeableness is related to being good natured, helpful, generous, forgiving and
sympathetic (McCrae & Costa, 1987). The Big Five factors have been researched and validated
extensively (e.g. Peabody & Goldberg, 1989) and they continue to be used in contemporary research
(e.g. Specht, Egloff, & Schmukle, 2011).
Often regarded as a separate trait as well is people’s locus of control. Rotter (1966) describes
it as the extent to which a person considers events happening to be due to his own doing or
characteristics (i.e. internal locus of control) or that these events occur (partly) due to chance, luck or
other people (i.e. external locus of control).
In the context of HCI, we can imagine that these dispositions could for instance influence the
behaviour online or influence what a user thinks about (a certain) computer, service or system.
2.2. Cognitive style
Cognitive styles can be defined as “people's characteristic and typically preferred modes of
processing information” (Sternberg & Grigorenko, 1997, p. 700). Dimensions of cognitive style
include, for example, the verbalizer-visualizer distinction (e.g. Mayer & Massa, 2003) and field
dependency (e.g. Witkin, Moore, Goodenough, & Cox, 1977). The verbalizer-visualizer distinction is
based on the apparent differences between people thinking with words or thinking with images (Mayer
& Massa, 2003). Field independency reflects the degree to which perception is dominated by the
surrounding field. Field independent people experience objects as more or less separate from the
surrounding field, whereas field dependent people’s perception is more dominated by the surrounding
field (Witkin et al., 1977).
We can relate cognitive styles to HCI by imagining that a user’s preferred processing mode
could influence his or her performance on a computer. In addition, their overall preferences for certain
design elements may be explained by their cognitive styles.
2.3. Cognitive and psychomotor abilities
Carroll (1993) defines cognitive tasks as “any task in which correct or appropriate processing
of mental information is critical to successful performance” (p.13). A cognitive ability, then, is “any
ability that concerns some class of cognitive tasks” (p.13). A broadly accepted framework for
cognitive abilities is the Three-Stratum model by Carroll (1993). In this model, a hierarchical
framework of cognitive abilities is described on three levels of generality. The top level (i.e. third
stratum) consists of a general intelligence factor (g). The second stratum consists of broad cognitive
abilities (e.g. visual perception and retrieval ability). Lastly, the first stratum contains more than 80
narrow cognitive abilities, which are specialized and more specific abilities.
The Three-Stratum model has been combined with another intelligence model (i.e. the
Cattell-Horn Gf-Gc model by Cattell-Horn and Noll, 1997) into the Cattell-Cattell-Horn-Carroll (CHC) model of cognitive
abilities (McGrew, 2009). This model resembles the Three Stratum model, but identifies several more
narrow abilities like visual memory, imagery and spatial relations. Other broad cognitive abilities
include, for instance, long-term memory retrieval and storage, processing speed, fluid reasoning and
reaction and decision speed.
The CHC model also includes psychomotor abilities and psychomotor speed in the second
stratum. Narrow psychomotor abilities are more specific abilities such as finger or manual dexterity,
aiming, control precision and multi-limb coordination. Furthermore, for narrow psychomotor speed
abilities, movement time and speed of limb movement are mentioned (McGrew, 2009).
Users’ cognitive and psychomotor abilities may produce variability in performance with
computers as well. For instance, think about reaction speed and hand and finger dexterity in using a
computer mouse or touchpad.
2.4. Culture
The term ‘culture’ is used widely and various definitions exist. For instance, culture is defined
as “the social production and reproduction of sense, meaning and consciousness” (O’Sullivan, Hartley,
Saunders, Montgomery, & Fiske, 1994, p.68). Hofstede (1994) defines culture as “the collective
programming of the mind which distinguishes the members of one category of people from another”
(p. 1). For example, these categories of people could be a nation, region, gender group, social class,
religious group or a work organization (Hofstede, 1994). In the context of HCI, Ford (2005) defines
culture as “the patterns of thinking, feeling and acting that influence the way in which people
communicate amongst themselves and with computers” (p.38). It is clear that various definitions exist
and that cultural differences can be researched in several categories of people, ranging from relatively
small groups in a work organization to much larger groups of members of a certain religion.
In order to get a measure of culture, Hofstede (as cited in Hofstede, 1994) proposed five
widely used dimensions on which cultures can be described. Power distance, which refers to the extent
to which less powerful members of a certain culture accept and expect that the distribution of power is
unequal. Individualism versus collectivism, representing the degree to which individuals are integrated
into groups. On the side of the individualist, the ties between individuals within a certain group are
exchange for unquestioning loyalty. Masculinity versus femininity refers to the distribution of roles
between sexes. It is often characterized by an assertive pole (masculine) and a modest, caring pole
(feminine). Uncertainty avoidance, which deals with a society’s tolerance for ambiguity and
uncertainty. It is an indication of the extent to which members feel comfortable or uncomfortable in
unstructured, novel and unknown situations. Lastly, long term versus short term orientation is
associated with people’s concerns with past, present and future and the values they attach to each of
them. Long term orientation is associated with persistence and perseverance, while short term
orientation is associated with respect for tradition and fulfilling social obligations.
Another well-known dimension of culture is Hall's (1976) dimension of contextuality, which
distinguishes low context cultures from high context cultures. In high context cultures, communication
relies on the physical context and information is not entirely contained in words, sentences and
grammar. Communication is more implicit and words used should be interpreted with regard to the
context (Kim, Pan, & Park, 1998). In low context cultures, information is conveyed explicitly through
words and is regarded more context-independent.
2.5. Control variables - experience and domain knowledge
We can readily imagine that people with different amounts of experience with something will
display different behaviour. For example, novices tend to use different (overall less effective) search
strategies in information search than more experienced users (Hembrooke, Granka, Gay, & Liddy,
2005). However, experienced and less experienced users are not always performing that differently
from each other. With proper design, less experienced users may perform just as well as more
experienced users, as shown in Finstad (2008). Related to experience is domain knowledge, which can
be described as the knowledge a person has of a certain domain. Indeed, Hambrick and Engle (2002)
have shown that domain knowledge was a stronger predictor of cognitive performance on
domain-relevant tasks than working memory capacity, for instance. In HCI, domain knowledge is influential
2.6. Control variables - age and gender
Furthermore, the effect of age on website usability has been shown by Wagner, Hassanein and
Head (2014). They found that the effect was partially mediated by spatial ability (a cognitive ability).
Lastly, gender has been shown to influence human-computer interaction as well. For example, a study
by Hess, Fuller and Mathew (2006) found that women report being more involved with the use of a
decision support aid than men. It thus appears to be important to control for these four individual
difference characteristics when examining effects of traits, cognitive styles, cognitive abilities and
culture.
2.7. Impact
Recall that Egan (1988) found very large differences between people in task completion time.
In order to get an impression of the impact of an effect, researchers either examine the outcome
variables on a natural scale (i.e. like Egan’s ratios), or they calculate effect sizes, which come in
different variants. There are measures of explained variance, like η2 (eta squared) and ηp 2
(partial eta
squared) values, which indicate the proportion of the variance explained by a certain predictor on a
dependent variable (in analysis of variance). For an extensive paper on differences between η2 and ηp 2
,
see Levine and Hullett (2002). Another indication of the explained variance is R2, which indicates the explained variance of an entire model on a dependent variable, instead of the explained variance per
factor. Effect sizes can also be expressed in standardized group mean differences like Cohen’s d,
which is the difference between two means divided by their pooled standard deviation.
3. Method
To describe and explain the current knowledge which could guide professional practice is a
purpose that is especially well-served by a literature review (Fink, 2010). Furthermore, an overview of
the research done can reveal areas that require more thorough examination, thus guiding scientific
practice. Since this paper is concerned about the individual differences in the HCI field on several
levels, we formulated multiple search terms. An overview of the search terms used can be found in
Table 1, along with the amount of search hits found per database. We used Scopus and Web of
Science as databases, because these are multidisciplinary databases in which we expected to find a
large diversity of studies. We used an approach similar to the one used in Bargas-Avila and Hornbæk
(2011), which is an adaptation of the QUOROM statement (Moher et al., 1999). First, we identified
potentially relevant studies by searching the databases with the search terms mentioned in Table 1. We
limited our search to studies published in journals between 2004-2014. Secondly, to be included in this
review, studies had to:
- Offer an empirical analysis; qualitative, quantitative and mixed studies were all candidates.
- Report on the categories of individual difference reported before in relation to a
human-computer interaction related topic or task as an important purpose of the study, instead of
merely mentioning the category as an afterthought.
- Be written in English.
- Be available as full texts at the digital libraries of the University of Twente.
In each of the two databases, we examined titles and abstracts of studies for every search term
in order to obtain relevant studies that satisfied the above mentioned conditions. These studies were
downloaded and were analyzed afterwards. Studies’ domains, samples, data collection methods, study
type, effect sizes and key findings were collected from each study and recorded in a data set.
Moreover, we examined whether studies measured and controlled for experience, domain knowledge,
age and gender. Regarding data collection methods, we decided to report methods to assess the
individual difference categories (independent variables), as well as methods for other variables
research on individual differences. For each individual differences category, we classified the selected
studies into subgroups based on the study’s domain (e.g. social media, games). These subgroups
emerged from the selected studies and were identified using a card sorting technique. More
specifically, we wrote the name of each study on a card and grouped studies that were reporting on the
same domain. For every study, we examined whether they fit into previously established groups. If
this was not the case, a new group was created. In some studies, there was some overlap between
domains. In these cases, we grouped them in the domain subgroup which fitted best with their primary
[image:13.595.66.529.298.719.2]research goal.
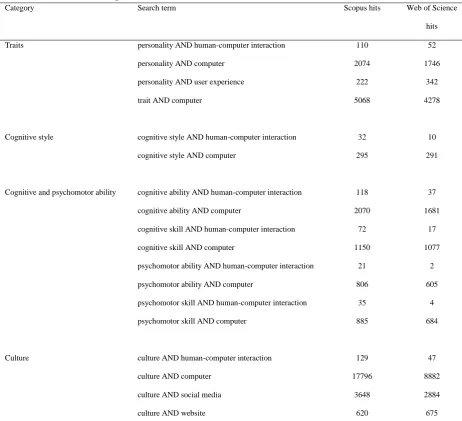
Table 1
Search terms used in Scopus and Web of Science databases
Note: We restricted the searches to a timeframe of 2004-2014 and searched for journal articles only (except for psychomotor
ability and psychomotor skill).
Category Search term Scopus hits Web of Science
hits
Traits personality AND human-computer interaction 110 52
personality AND computer 2074 1746
personality AND user experience 222 342
trait AND computer 5068 4278
Cognitive style cognitive style AND human-computer interaction 32 10
cognitive style AND computer 295 291
Cognitive and psychomotor ability cognitive ability AND human-computer interaction 118 37
cognitive ability AND computer 2070 1681
cognitive skill AND human-computer interaction 72 17
cognitive skill AND computer 1150 1077
psychomotor ability AND human-computer interaction 21 2
psychomotor ability AND computer 806 605
psychomotor skill AND human-computer interaction 35 4
psychomotor skill AND computer 885 684
Culture culture AND human-computer interaction 129 47
culture AND computer 17796 8882
culture AND social media 3648 2884
To limit the scope of our review, we did not include studies reporting on physical and mental
disabilities (e.g. individual differences due to blindness or Alzheimer’s disease). We restricted
ourselves to traits, cognitive style, cognitive and psychomotor ability and culture. Due to the small
number of studies on psychomotor abilities we found in journals, we extended our search to include
conference proceedings for just this category as well.
4. Results
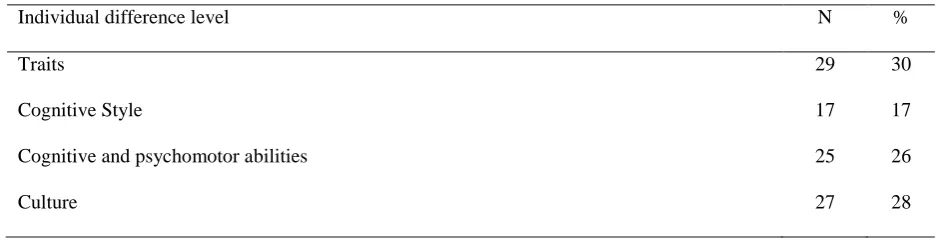
Our final set of articles consist of 98 HCI studies that matched all of the selection criteria.
Twenty-nine studies reporting on traits and personality were selected for inclusion, seventeen studies
reporting on cognitive style, twenty-five studies on cognitive and psychomotor abilities and, lastly,
twenty-seven studies were included reporting on culture.
In the following sections, we report on domains, methods, effect sizes for each of the
individual difference levels. In a separate section, we describe the studies controlling for experience,
[image:14.595.62.534.481.601.2]domain knowledge, age and gender effects.
Table 2
Number of studies in the individual difference categories
Note: Percentages do not add up to 100% due to rounding
Individual difference level N %
Traits 29 30
Cognitive Style 17 17
Cognitive and psychomotor abilities 25 26
4.1. Traits
In this section, we present the domains, methods and effect sizes of the studies we selected on
traits and human-computer interaction.
4.1.1. Domains
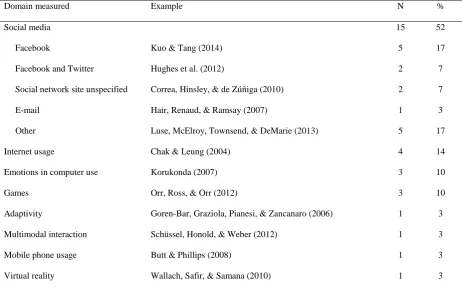
Table 3 presents an overview of the domains in which we categorized our selection of studies
reporting on traits and human-computer interaction (n=29). Half of these studies were conducted on
individual differences in social media, like Facebook (Moore & McElroy, 2012). Two studies
examined the effects of personality on both Facebook and Twitter (Davenport, Bergman, Bergman, &
Fearrington, 2014; Hughes, Rowe, Batey, & Lee, 2012). Note that we also included e-mail in the
domain of social media; thus, a broad definition of social media was employed. Furthermore, within
the ‘Other’ subdomain of social media we included studies on, for instance, the effect of personality
traits on instant messaging (Wang, Ngai, & Wei, 2012), on product ratings and participation at online
forums (Helm, Möller, Mauroner, & Conrad, 2012) and on dating site behavior (Kim, Kwon, & Lee,
2009). In the ‘Internet usage’ domain (14%, n=4), we categorized studies reporting on internet
addiction (Chak & Leung, 2004), global internet use (Engelberg & Sjöberg, 2004) and user-generated
content consumption (Moon, Kim, & Armstrong, 2014).
4.1.2. Methods
Most studies used quantitative methods (86%, n=25), while the other four (14%) used a
mixed-methods design. For example, Subramanian, Wise, Davis, Bhandari, and Morris (2014)
employed quantitative methods to measure explicit, reported, esteem as well as implicit
self-esteem by using an Implicit Association Test designed to measure self-self-esteem (Greenwald &
Farnham, 2000). In addition, they performed a qualitative content analysis in order to assess
narcissistic Facebook use. A similar study on Facebook usage was conducted by Moore and McElroy
(2012), only they examined the effect of the Big Five personality traits on Facebook usage, studied
observed in their interactions to find relations with personality traits. There were no studies using
[image:16.595.67.533.148.439.2]solely qualitative methods in traits research.
Table 3
Domains in traits research
Note: Percentages do not add up to 100% due to rounding
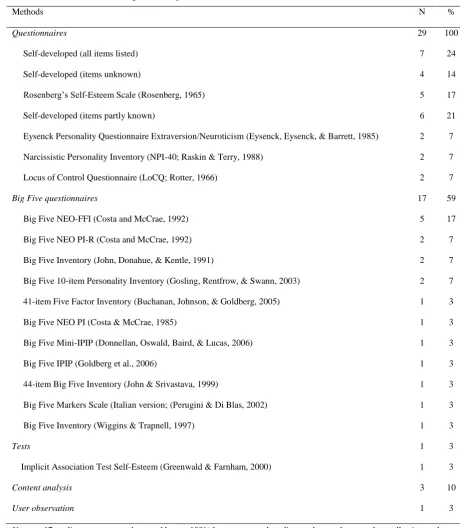
An overview of the methods used is presented in Table 4. Due to the large number of validated
questionnaires (n=60), we present only those questionnaires that were used in more than one study. An
exception to this rule was made for measures of the Big Five personality traits, which were all
mentioned. Over half of the studies used self-developed questionnaires (59%, n=17). In most of these
studies (n=7), the authors listed the items either in text, tables or in the appendix (e.g. Davenport et al.
(2014) who used a self-developed questionnaire to get an impression of participants’ Facebook and
Twitter usage, their reasons for updates and number of friends/followers). Others only mentioned
some of the items used or did not mention the items at all (n=6 and n=4, respectively). For instance,
Cole & Hooley (2013) measure participants’ number of months playing Massive Multiplayer Online
Games, their daily time spent gaming ‘’and other relevant characteristics” (p. 5), without mentioning
what these other characteristics were and how they were measured. Note that most of the
self-Domain measured Example N %
Social media 15 52
Facebook Kuo & Tang (2014) 5 17
Facebook and Twitter Hughes et al. (2012) 2 7
Social network site unspecified Correa, Hinsley, & de Zúñiga (2010) 2 7
E-mail Hair, Renaud, & Ramsay (2007) 1 3
Other Luse, McElroy, Townsend, & DeMarie (2013) 5 17
Internet usage Chak & Leung (2004) 4 14
Emotions in computer use Korukonda (2007) 3 10
Games Orr, Ross, & Orr (2012) 3 10
Adaptivity Goren-Bar, Graziola, Pianesi, & Zancanaro (2006) 1 3
Multimodal interaction Schüssel, Honold, & Weber (2012) 1 3
Mobile phone usage Butt & Phillips (2008) 1 3
developed questionnaires were used to gain measures of dependent variables, experience and domain
knowledge (i.e. not for measuring personality). In order to measure personality traits, most studies
used validated measures. However, in Kim et al. (2009) a measure of participants’ sociability was
obtained by a developed, unstandardized, 4-item questionnaire and in Helm et al. (2012) a
self-developed questionnaire for lack of social recognition was used. In the latter study, Cronbach’s Alpha
is provided and exploratory and confirmatory factor analyses were performed. Of the validated
measures, the Big Five NEO-FFI (Costa & McCrae, 1992) and Rosenberg’s Self-Esteem Scale
(Rosenberg, 1965) were used most often (18%, n=5 studies for both). Most studies (59%, n=17) used a
measure of the Big Five personality traits. Some other used measures of personality included
Narcissism (e.g. Krishnan & Atkin, 2014), Locus of Control (e.g. Hair et al., 2007) and Shyness (e.g.
Marriott & Buchanan, 2014), all measured by questionnaires.
There was one study that also included a cognitive style measure to examine the effects of
personality and cognitive style on preference for working in virtual teams (Luse et al., 2013).
Furthermore, two studies included a measure of cognitive ability, namely emotional intelligence
(Engelberg & Sjöberg, 2004) and math skills (Korukonda, 2007).
4.1.3. Impact
More than half of the studies mentioned effect sizes of some sort (62%, n=18). Most studies
(n=16) present the reader values of R2 (i.e. the variance explained by the tested model). There is quite some variation within these values and some models include more variables than others. For instance,
for social media, Davenport et al. (2014) mention explained variance of less than 10% for narcissism,
age and gender combined on social network site usage and motives. Similar effect sizes were found in
Correa et al. (2010), but for extraversion, neuroticism and openness to experience on social media use.
On the other hand, larger effect sizes in social media research were found in Moore and McElroy
(2012). They performed their analyses in steps so that, when personality was added to their model
containing experience and gender, values of 41% extra explained variance due to Big Five traits were
found for number of Facebook postings about others. Recall that this study performed a content
content analysis of Facebook data, but found low amounts of variance explained by Big Five
[image:18.595.59.520.146.675.2]personality traits (R2 = .05 for uploading personal information and .07 for number of friends). Table 4
Data collection methods in personality traits research
Note: n=17 studies; percentages do not add up to 100% because several studies used more than one data collection tool.
Studies in other domains report R2 values of 23.6% explained variance by Big Five traits and self-esteem in time spent writing and receiving SMS messages (Butt & Phillips, 2008), 26% explained
variance by empathy, immersive tendencies and locus of control on presence scores in a virtual
Methods N %
Questionnaires 29 100
Self-developed (all items listed) 7 24
Self-developed (items unknown) 4 14
Rosenberg’s Self-Esteem Scale (Rosenberg, 1965) 5 17
Self-developed (items partly known) 6 21
Eysenck Personality Questionnaire Extraversion/Neuroticism (Eysenck, Eysenck, & Barrett, 1985) 2 7
Narcissistic Personality Inventory (NPI-40; Raskin & Terry, 1988) 2 7
Locus of Control Questionnaire (LoCQ; Rotter, 1966) 2 7
Big Five questionnaires 17 59
Big Five NEO-FFI (Costa and McCrae, 1992) 5 17
Big Five NEO PI-R (Costa and McCrae, 1992) 2 7
Big Five Inventory (John, Donahue, & Kentle, 1991) 2 7
Big Five 10-item Personality Inventory (Gosling, Rentfrow, & Swann, 2003) 2 7
41-item Five Factor Inventory (Buchanan, Johnson, & Goldberg, 2005) 1 3
Big Five NEO PI (Costa & McCrae, 1985) 1 3
Big Five Mini-IPIP (Donnellan, Oswald, Baird, & Lucas, 2006) 1 3
Big Five IPIP (Goldberg et al., 2006) 1 3
44-item Big Five Inventory (John & Srivastava, 1999) 1 3
Big Five Markers Scale (Italian version; (Perugini & Di Blas, 2002) 1 3
Big Five Inventory (Wiggins & Trapnell, 1997) 1 3
Tests 1 3
Implicit Association Test Self-Esteem (Greenwald & Farnham, 2000) 1 3
Content analysis 3 10
environment (Wallach et al., 2010) and 35.5% explained variance by social phobia and trait anxiety on
problematic internet behaviour in games (Cole & Hooley, 2013). Some studies (e,g, Wang et al., 2012)
reported variance explained by other predictors, but not for personality.
Other effect sizes measures include semi-partial correlations squared (sr2; Worth & Book, 2014) and partial eta squared (ηp
2
; Schwark, Dolgov, Hor, & Graves, 2013). The former study found,
for instance, that openness to experience explained 11.4% of the variance for engaging in immersive
game play of Massive Multiplayer Online games. The latter study found high values of explained
variance (ηp 2
= .56) of neuroticism for the degree of affect change due to a hedonic computing
paradigm, but only for women.
4.2. Cognitive style
In the following section we present the domains, methods and effect sizes of selected studies
reporting on cognitive style and human-computer interaction
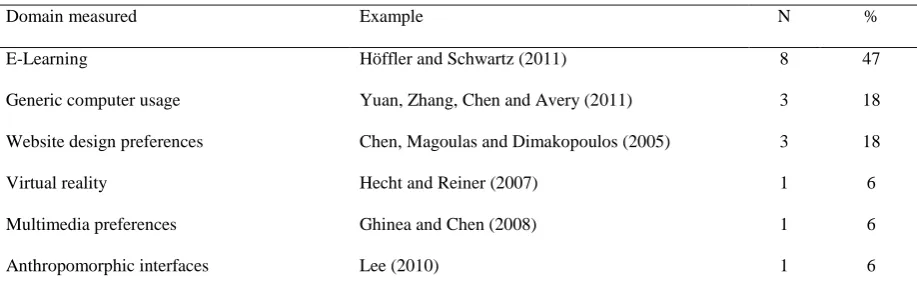
4.2.1. Domains
Table 5 shows the domains in which we categorized the studies reporting on cognitive styles
as an individual difference level in human-computer interaction (n=17). Most of the studies
(approximately 47%) were in the domain of E-Learning. For instance, Angeli (2013) examined the
effects of Field Dependence on problem solving performance and interaction with a computer
modelling tool. Furthermore, Workman (2004) studied the effects of cognitive styles in
computer-based education as well as computer-aided education. In the domain of ‘Generic computer usage’
studies report on cognitive style in relation to internet usage (McElroy, Hendrickson, & Townsend,
2007), attitudes toward computers (Altun & Cakan, 2006) and information seeking performance and
behaviour (Yuan, Zhang, Chen, & Avery, 2011). Among the least occurring domains were virtual
reality and multimedia preferences. In addition, we chose to include a study by Lee (2010) on
anthropomorphic interfaces. We acknowledge that Human-Computer Interaction has overlap with
Human-Robot Interaction on this domain. However, a line has to be drawn and we considered this
Table 5
Domains in cognitive style research.
Note: Percentages do not add up to 100% due to rounding.
4.2.2. Methods
Most studies used quantitative methods (82%, n=14) and others used a mixed-methods design
(18%, n=3). For example, Triantafillou, Pomportsis, Demetriadis and Georgiadou (2004) used a
questionnaire and a debriefing interview to collect qualitative data along with their quantitative
questionnaire in order to measure participants’ cognitive styles, performance and attitudes towards an
adaptive educational system. There were no studies using solely qualitative measures. Other
qualitative measures include user observation (Angeli, 2013) and an open-ended questionnaire (Chen
et al., 2005). Most quantitative data, by contrast, was obtained by questionnaires. Chen (2010) also
examined log-files of the interaction with a web-based learning program to obtain measures of
participants’ navigational behaviour within the program.
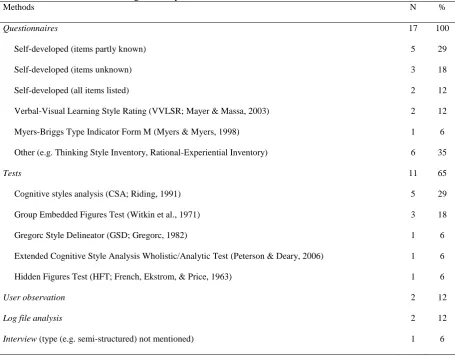
An overview of the data collection methods is presented in Table 6. About half of the studies
on cognitive style made use of self-developed questionnaires for dependent variables, experience and
domain knowledge (59%, n=10). In three of these studies, the items of the questionnaire were not
mentioned by the authors (e.g. Chen et al. (2005), in which “thirty closed questions were applied to
identify the participants’ perceptions toward the features of interface design” (p.74), without
mentioning exactly what these items were). Five other studies mentioned some of the items in text or
in tables. Lastly, only two studies using self-developed questionnaires listed all items either in text,
tables or in the appendix (e.g. Lee and Koubek (2011) which mentioned all items on a questionnaire
that measured perceived usability, perceived aesthetics and user preference before actual use of
Domain measured Example N %
E-Learning Höffler and Schwartz (2011) 8 47
Generic computer usage Yuan, Zhang, Chen and Avery (2011) 3 18
Website design preferences Chen, Magoulas and Dimakopoulos (2005) 3 18
Virtual reality Hecht and Reiner (2007) 1 6
Multimedia preferences Ghinea and Chen (2008) 1 6
simulated systems). Note that, for the measurement of cognitive styles, every study used a validated
questionnaire and/or test. Most self-developed questionnaires were created to obtain data on
participants’ previous experience with a computer or system or participants’ domain knowledge.
Another study used a self-developed questionnaire to measure attitudes towards computers as well
(Triantafillou et al., 2004).
Of the validated cognitive style measures, the Cognitive Styles Analysis by Riding (1991) was
used most often (29%, n=5), followed by the Group Embedded Figures Test (Witkin, Oltman, Raskin,
& Karp, 1971) and Mayer and Massa's (2003) Verbal-Visual Learning Style Rating (n=3 and n=2,
respectively). Most validated measures were only mentioned in a single study. These include the
Myers-Briggs Type Indicator Form M (Myers & Myers, 1998) and the Rational-Experiential
Inventory short version (Pacini & Epstein, 1999).
Beside cognitive styles, some studies measured other individual difference levels as well. For
instance, cognitive ability measures were also obtained in a study on hypermedia navigation
(Calcaterra, Antonietti, & Underwood, 2005) and in a study on multimedia instructions (Massa &
Mayer, 2006). One study included a measure of personality (McElroy et al., 2007).
4.2.3. Impact
Only six of the studies (35%) reported effect sizes of some sort. Massa and Mayer (2006) and
Angeli (2013) both mention η2 values. These values differ substantially between the two studies; whereas 20% of the variance in overall computer interaction and 16% of the variance in
problem-solving performance with a computer modelling tool was explained by Field Dependency (Angeli,
2013), the study by Massa and Mayer (2006) found a maximum of 5% explained variance for a
verbalizer-visualizer distinction on an electronic learning test score. One study used partial eta-squared
(ηp2), but found many low proportions of explained variance (5% and less) for cognitive styles and
social responses to anthropomorphic interfaces (Lee, 2010). McElroy et al. (2007) present values of R2 of 10% and 11% explained variance in internet use and e-selling respectively, albeit not for cognitive
style but for personality. These values were obtained after adding personality to the existing model of
Table 6
Data collection methods in cognitive style research
Methods N %
Questionnaires 17 100
Self-developed (items partly known) 5 29
Self-developed (items unknown) 3 18
Self-developed (all items listed) 2 12
Verbal-Visual Learning Style Rating (VVLSR; Mayer & Massa, 2003) 2 12
Myers-Briggs Type Indicator Form M (Myers & Myers, 1998) 1 6
Other (e.g. Thinking Style Inventory, Rational-Experiential Inventory) 6 35
Tests 11 65
Cognitive styles analysis (CSA; Riding, 1991) 5 29
Group Embedded Figures Test (Witkin et al., 1971) 3 18
Gregorc Style Delineator (GSD; Gregorc, 1982) 1 6
Extended Cognitive Style Analysis Wholistic/Analytic Test (Peterson & Deary, 2006) 1 6
Hidden Figures Test (HFT; French, Ekstrom, & Price, 1963) 1 6
User observation 2 12
Log file analysis 2 12
Interview (type (e.g. semi-structured) not mentioned) 1 6
Note: n=17 studies; percentages do not add up to 100% because several studies used more than one data collection tool.
The only study that reported Cohen’s d values was Lee and Koubek (2011). For instance,
they found that visualizers (high and low; d = 0.432) responded more sensitively to aesthetic features
than verbalizers (high and low; d = 0.081). It is noteworthy that this study reported d values of
non-significant findings as well. Lastly, Miller (2005) mentions differences in the amount of material
learned from a computer-based instruction system between participants with different cognitive styles.
For example, the author states that Concrete Random participants learned 22% more than Concrete
Sequential participants. Furthermore, Abstract Random participants learned 14% more than Concrete
Sequential participants. This way of reporting the impact of cognitive styles is similar to the way Egan
(1988) reported his findings. Differences are expressed in percentages, but no standard deviations are
mentioned anywhere in the paper. Hence, Cohen’s d cannot be calculated and it will be harder to
4.3. Cognitive and psychomotor ability
In this section, we present the domains, methods and effect sizes of selected studies on
cognitive and psychomotor ability and human-computer interaction.
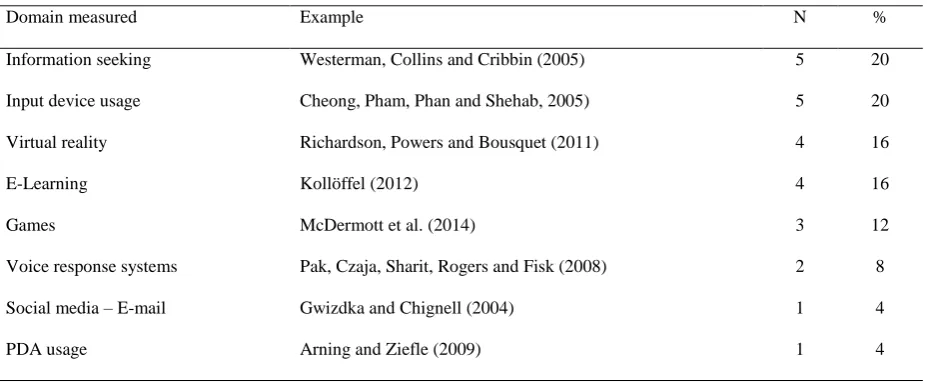
4.3.1. Domains
An overview of the domains in which we categorized HCI studies reporting on cognitive and
psychomotor ability as a level of individual differences is presented in Table 7. In total, we selected 25
studies that met the criteria. Most studies on psychomotor ability were conducted within the domain of
input device usage (20%, n=5). In the input device usage domain only studies of psychomotor ability
were mentioned. For instance, in an early study by Cheong, Pham, Phan and Shehab (2005), the
authors found that precision control ability was related to movement time in a computer mouse task. In
a later study, Cheong, Shehab and Ling (2013) analyzed the effects of age and psychomotor ability
(e.g. arm-hand steadiness, wrist-finger speed and manual dexterity) on computer mouse aiming
movement. The authors found that manual dexterity was related to most measures of mouse movement
(e.g. peak velocity and the time needed until peak velocity was reached). In the E-learning domain,
Ownby, Czaja, Loewenstein and Rubert (2008) found that psychomotor speed and cognitive ability
were associated with older participants’ performance on a computer-based training program. A
commonality in all these studies is that they argue that age itself may not directly affect performance,
but that other characteristics like psychomotor ability mediate the influence of age. In addition, Sutter,
Oehl and Armbrüster (2011) mention domain-specific motor skills with using an input device like a
touchpad or a mini-joystick as influencing factors of usage of these devices. Experts and novices of
touchpads and mini-joysticks were compared and it was found that experts performed at a novice level
on the non-congruent device (i.e. expert users of touchpads performed at a novice level on
mini-joysticks and vice versa). Novices were even able to outperform experts in mouse movement time
when training was received. The authors claim that domain-specific motor skills are essential for
expert performance in these devices. In other words, they argue that experience is associated with
Table 7
Domains in cognitive and psychomotor ability research
Most studies on cognitive ability were conducted within the domain of information seeking
(20%, n=5). For example, Dommes, Chevalier and Lia (2011) examined the influence of cognitive
flexibility and vocabulary abilities of older and younger users on finding information using Google.
Another example in the information seeking domain is the study by Downing, Moore and Brown
(2005). The authors examined the effects of spatial visualization ability and domain knowledge on
information search using an electronic archive tool. In the domain of virtual reality (VR), studies
report on, for instance, the effects of spatial ability in VR versus non-VR (Lee & Wong, 2014), spatial
ability and experienced presence in a public speaking virtual environment (Ling, Nefs, Brinkman, Qu,
& Heynderickx, 2013) and visual attention ability on navigation in a virtual environment and
manipulation of an object in a virtual environment (Tyndiuk, Lespinet-Najib, Thomas, & Schlick,
2007). Furthermore, three studies on individual difference in cognitive ability were conducted in the
domain of games (16%). These studies report on differences in visual short-term memory between
action game players and non-gamers (McDermott et al., 2014), on differences between expert gamers
and non-gamers in object tracking performance, visual short-term memory, mental rotation and
task switching (Boot, Kramer, Simons, Fabiani, & Gratton, 2008) and differences in mathematical
skill, logical skill and school performance between Massive Multiplayer Online Role Playing Game
players and non-gamers (Campello De Souza, De Lima E Silva, & Roazzi, 2010). Studies in the
E-Learning domain (16%, n=3) were mostly focused on spatial ability in relation to performance on
Domain measured Example N %
Information seeking Westerman, Collins and Cribbin (2005) 5 20
Input device usage Cheong, Pham, Phan and Shehab, 2005) 5 20
Virtual reality Richardson, Powers and Bousquet (2011) 4 16
E-Learning Kollöffel (2012) 4 16
Games McDermott et al. (2014) 3 12
Voice response systems Pak, Czaja, Sharit, Rogers and Fisk (2008) 2 8
Social media – E-mail Gwizdka and Chignell (2004) 1 4
animated versus static computer-based learning material (Falvo & Suits, 2009; Lee & Shin, 2011). In
Kollöffel (2012), the relation between performance on a spatial visualization test and a
computer-based mathematical learning task was explored. Among the less researched domains was voice
response systems (e.g. Pak et al. (2008) report on the mediating effects of spatial ability, working
memory and attention in age-related performance decline on an auditory voice response task).
4.3.2. Methods
Most studies in our selection used solely quantitative measures (92%, n=23), whereas a study
by Sharit et al. (2008) also conducted a structured interview to measure participants’ domain
knowledge of the internet and search engines besides quantitative measures (e.g. the Paper Folding
test; Ekstrom, French, Harman, & Dermen, 1976) and a study by Agudo et al. (2010) observed
children interacting with a computer mouse and recorded how many errors were made. In the
quantitative studies on psychomotor ability, mouse usage was mostly measured by log files of the
interaction. Data such as initiation speed, peak velocity and peak acceleration were obtained this way
(e.g. Cheong et al., 2013). Quantitative measures on cognitive ability were mostly in the form of tests
and questionnaires. There were five studies (20%) that analyzed log files of their participants’
interaction with the computer, obtaining measures like navigation behaviour.
A total of 55 validated tests and 8 validated questionnaires were used. Of these measures, 50
tests measured cognitive ability and there were no questionnaires measuring cognitive ability (the 8
validated questionnaires mainly measured personality traits). Only three of the six psychomotor ability
studies measured psychomotor abilities. For example, Cheong et al. (2013) measured participants’
psychomotor ability with several standard apparatus (see Cheong et al., 2013). In Cheong et al. (2005),
one of these apparatus (i.e. a photoelectric rotary pursuit unit) was used to measure precision control
ability. The other psychomotor ability studies did not provide any measures of these abilities, but
nevertheless made inferences about them.
Two cognitive ability tests were self-developed, without providing any attempts to validate
them. These include the Knowledge Test and Psychometric Test in Campello De Souza et al. (2010).
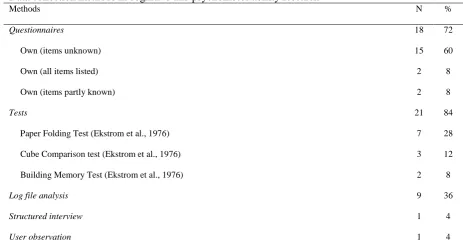
measures that were used in more than one study in Table 8. Regarding questionnaires for measures
other than cognitive and psychomotor ability, what stands out is the amount of self-developed
questionnaires with unknown items (60%, n=15). We found that many studies do not report the items
used to measure individual differences in mainly experience and domain knowledge. For example,
Lee and Wong (2014) gave their participants a pretest (to measure prior domain knowledge) and a
posttest but do not provide the reader with the items used. Similarly, Falvo and Suits (2009) do not
report the items used on their pretest for domain knowledge and do not report items used to measure
participants’ experience in science either. On the other hand, two studies reported the items used partly
(e.g. Dommes et al. (2011), who present slightly more information about the items) and two studies
listed all used items (e.g. Arning & Ziefle (2009), who present all items used for gathering information
about participants’ duration of computer usage, ease of computer usage and frequency of computer
[image:26.595.62.526.397.649.2]usage).
Table 8
Data collection methods in cognitive and psychomotor ability research
Methods N %
Questionnaires 18 72
Own (items unknown) 15 60
Own (all items listed) 2 8
Own (items partly known) 2 8
Tests 21 84
Paper Folding Test (Ekstrom et al., 1976) 7 28
Cube Comparison test (Ekstrom et al., 1976) 3 12
Building Memory Test (Ekstrom et al., 1976) 2 8
Log file analysis 9 36
Structured interview 1 4
User observation 1 4
Note: n=19 studies; percentages do not add up to 100% because several studies used more than one data collection tool.
In order to measure cognitive abilities, the Paper Folding test (Ekstrom et al., 1976) was used
most often (37% of the studies, n=7). Indeed, two more cognitive ability tests by Ekstrom and her
colleagues (1976), the Cube Comparison test (16%, n=3) and the Building Memory test (11%, n=2),
thus not incorporated in Table 8, were cognitive tests like the WAIS-IV (Wechsler, 2008).
There were some studies that measured more than one level of individual difference. Two
studies also included a measure of participants’ cognitive style (Kollöffel, 2012; Sharit et al., 2008),
one study included several traits measures, like empathy and locus of control (Ling et al., 2013) and
one study included a psychomotor speed measure (Pak, Rogers, & Fisk, 2006).
4.3.3. Impact
About half of the studies reported effect sizes of some sort (52%, n=13). Most of these studies
presented a measure of effect size in the form of R2 (i.e. the variance explained by the tested model). For example, in Sharit et al. (2008) reasoning ability was the most important predictor of performance
on a simple information seeking task and accounted for 21.4% of the variance over and above domain
knowledge. In more complex information seeking tasks, working memory seemed to be a more
important predictor, accounting for 12.2% of the variance in performance again over and above total
knowledge (Sharit et al., 2008). Interestingly, adding age to the model in a subsequent step did not
increase R2 any further for simple nor complex tasks. This implies that after controlling for knowledge and cognitive ability, the effect of age on information seeking performance was absent. Pak, Rogers
and Fisk (2006) also report on information search performance but mainly for spatial ability. In their
study, spatial orientation (i.e. a subfactor of spatial ability) accounted for 7.7% of the variance (ΔR2) in the more navigationally demanding condition. This effect was found after measures of perceptual and
psychomotor speed, working memory, crystallized intelligence and attention were already in the
model a step before spatial orientation was added. For specific tasks, cognitive abilities accounted for
higher amounts of variance (as expressed by R2) in several studies. For instance, in Dommes et al. (2011), cognitive flexibility and age together accounted for 72% of the variance in total number of
requests made by the participant (age accounted for 36% of the variance in cognitive flexibility; ηp2 =
.36). Moreover, spatial ability and age accounted for 73.2% of the variance in number of tasks solved
on a PDA and accounted for 74.4% variance on the time spent on these tasks (Arning & Ziefle, 2009).
Four studies mention effect sizes in ηp 2
(21%, n=4). In Gwizdka and Chignell (2004), visual
visual memory were overall slower than their higher visual memory counterparts. Another study found
an interaction between set size of a visual short-term memory task and group (action video game
players vs. non-gamers), accounting for 10.2% of the variance; action video game players performed
better at higher set sizes for the visual memory task than non-gamers (McDermott et al., 2014).
Two studies reported semi-partial correlations (11%). For example, Kollöffel (2012) found
that verbal ability accounted for 8.9% of the variance in situational knowledge scores and spatial
visualization accounted for 10.6% of the variance in situational knowledge scores. One of the findings
in Miller, Gagnon, Talbot and Messier (2013) was that working memory scores predicted 16% of the
variance in the number of interactive voice response tasks completed.
Lastly, one study reported Cohen’s d values for some of their effects. Falvo and Suits (2009)
found that high spatial ability people performed better on a post-test for knowledge than low spatial
ability (d=0.60). The authors, however, did not specifically state that Cohen’s d was used and merely
called it ‘effect size’.
The only study presenting relevant effect sizes for psychomotor abilities was Cheong et al.
(2013). The authors provide effect sizes in the form of η2 for age on computer mouse usage. They found, for instance, that age accounted for 27.7% of the variance in time from peak velocity until end
of movement, 20.1% of the variance in the time until peak velocity was reached and 19.8% of the
variance for time until peak acceleration was reached. They then examined how much variance was
shared between age and psychomotor ability (mainly manual dexterity). For time until peak velocity,
87.7% of the variance was shared; for time until peak acceleration, 90.6% of the variance was shared.
In fact, age and psychomotor ability shared more than 80% of variance for all dependent variables,
except for time from peak velocity until end of movement (which the authors term the ‘homing
phase’). On this variable, age and psychomotor ability shared 48.9% of the variance. The authors
concluded that direct age influence was minimal in the first mouse movements and that psychomotor
ability mediated this effect. However, for the homing phase, the same cannot be said and other
4.4. Culture
In this section, we present the domains, methods and effect sizes of selected studies on culture
and human-computer interaction.
4.4.1. Domains
Table 9 presents an overview of the domains in which we categorized studies reporting the
effect of culture in human-computer interaction (n=27). We found that most studies report on the
cultural influences in the domain of E-commerce (41%, n=11). For instance, Lee and Choi (2006)
examined the effects of horizontal and vertical individualism and collectivism on participants’
attitudes towards web advertising. Most studies in the E-commerce domain were focused on websites.
However, Choi, Lee and Kim (2006) explored the effects of individualism/collectivism, uncertainty
avoidance and contextuality in mobile data services. Research was also focused on cultural effects in
the social media domain (37%, n=10). During the process of categorization, we decided to group
studies in several subdomains. Most subdomains were only researched in a single study. In the
subdomain of e-mail, however, two studies were conducted. The first, Lee and Lee (2009), examined
the differences between US and Korean employees in e-mail usage. In the second study, Tan, Sutanto,
Phang and Gasimov (2014), the effect of contextuality on people’s preferences for commercial
communications via e-mail or via SMS was studied. In the ‘Other’ subdomain of social media, we
categorized a study reporting on the effect of culture and communication medium on the degree of
social conformity in a line judgment task (Cinnirella & Green, 2007).
4.4.2. Methods
Most studies used solely quantitative measures (70%, n=19), two studies used solely
qualitative measures (7%) and six studies reported measures of both quantitative and qualitative
measures (22%). All quantitative data was obtained through questionnaires, while qualitative data was
obtained through, for instance, interviews (e.g. Choi et al., 2006), content analyses (e.g. Pflug, 2011)
Table 9
Domains in culture research
Note: Percentages do not add up to 100% due to rounding
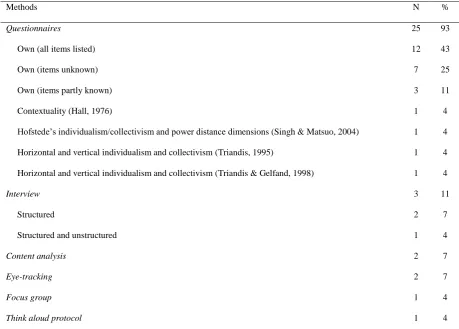
An overview of the data collection methods used in culture research is presented in Table 10.
A total of 22 validated questionnaires were used in our selection of studies. We chose to only present
validated questionnaires measuring cultural dimensions. Curiously, there were only four studies
measuring cultural dimensions with validated questionnaires. These include the study by Tan et al.
(2014) measuring Hall's (1976) cultural dimension of contextuality mentioned before, a study by
Gevorgyan and Manucharova (2009) measuring individualism/collectivism and power distance
dimensions using a scale by Singh and Matsuo (2004) and two studies measuring horizontal and
vertical individualism and collectivism (Triandis, 1995; Triandis & Gelfand, 1998). Nine studies
(33%) did not measure cultural dimensions of their participants, but nevertheless present conclusions
of these dimensions. These studies obtained data from participants with different nationalities and use,
for instance, Hofstede's (1980) characterization of countries. Indeed, several studies concluded that
their sample of participants from a certain country has certain cultural characteristics based on
research done several decades ago.
Domain measured Example N %
E-Commerce Choi et al. (2006) 11 41
Social media 10 37
E-mail Lee and Lee (2009) 2 7
Internet forums Pflug (2011) 1 4
Instant messaging Guo, Tan, Turner and Xu (2008) 1 4
Flickr Dotan and Zaphiris (2010) 1 4
Online community Ishii and Ogasahara (2007) 1 4
Personal communication technology Vishwanath and Chen (2008) 1 4
Facebook Rui and Stefanone (2013) 1 4
Social network sites in general Choi, Kim, Sung and Sohn (2011) 1 4
Other Cinnirella and Green (2007) 1 4
Website design preferences Mazaheri, Richard, Laroche and Ueltschy (2014) 4 15
Other studies examined differences between members from different countries without
mentioning cultural dimensions (41%, n=11), between members from a certain religion (Siala,
O’Keefe, & Hone, 2004) or between English and French speaking members in Canada (Nantel &
Glaser, 2008).
Most studies also made use of self-developed questionnaires for measures other than cultural
dimensions (81%, n=22). Twelve studies (44%) listed all used items either in text, tables or in the
appendix (e.g. Cyr, Head, & Larios, 2010). Furthermore, seven studies (26%) used self-developed
questionnaires of which no items were presented anywhere in the paper. Such a questionnaire was
used in a study by Zaharias and Papargyris (2009), who measured participants’ perceived game
usability with an unstandardized questionnaire of which the items were not mentioned anywhere in the
paper. Lastly, three studies (11%) presented the items of the questionnaire only in part (e.g. Hwang,
[image:31.595.65.525.406.735.2]Jung, & Salvendy, 2006).
Table 10
Data collection methods in culture research
Note: n=27 studies; percentages do not add up to 100% because several studies used more than one data collection tool.
Methods N %
Questionnaires 25 93
Own (all items listed) 12 43
Own (items unknown) 7 25
Own (items partly known) 3 11
Contextuality(Hall, 1976) 1 4
Hofstede’s individualism/collectivism and power distancedimensions (Singh & Matsuo, 2004) 1 4
Horizontal and vertical individualism and collectivism(Triandis, 1995) 1 4
Horizontal and vertical individualism and collectivism(Triandis & Gelfand, 1998) 1 4
Interview 3 11
Structured 2 7
Structured and unstructured 1 4
Content analysis 2 7
Eye-tracking 2 7
Focus group 1 4
4.4.3. Impact
Ten studies (37%) reported effect sizes of some sort in their study. Most of these reported
measures of R2. For instance, Guo, Tan, Turner and Xu (2008) report increases in explained variance of 2 to 8% in media preferences for instant messaging, telephone and e-mail due to culture (i.e. being
Australian or being Chinese) over gender, age and experience. Slightly higher proportions of variance
(maximum 16% for status seeking expected outcome) were explained by horizontal and vertical
individualism/collectivism on expected outcomes and usage patterns of social network games (Lee &
Wohn, 2012).
Three studies reported η2 values to report proportions of explained variance per effect. For example, Lee and Lee (2009), found that task equivocality (i.e. task ambiguity) explained more
variance in media choice for US employees (i.e. 18.1%) than for Korean employees (i.e. 6.3%).
Moreover, communication direction explained 0.67% of the variance in media choice for US
employees and 10.8% for Korean employees. This is an example of a situation where both effects (i.e.
task equivocality and communication direction) were significant (p<0.01), but both effects have
different implications.
Lastly, Cyr (2008) reports Cohen’s f2 to present the effect size of website trust and satisfaction on e-loyalty for participants from China, Germany and Canada. The effect size of trust on e-loyalty
was 0.31 for Chinese, 0.26 for German and 0.11 for Canadian participants. For satisfaction, effect
sizes were 0.06 for Chinese, 0.28 for German and 0.27 for Canadian participants. The author
concludes that trust is a stronger relation with e-loyalty for Chinese and German people than for
Canadian people. Moreover, satisfaction seems to be of less importance for Chinese people in
e-loyalty.
4.5. Experience, domain knowledge, age and gender
We found that 31% of traits studies, 24% of cognitive style studies, 68% of cognitive and
psychomotor ability studies and 44% of culture studies controlled for effects of experience. In our total
set of studies this amounts to approximately 43% of the studies. Some studies merely mentioned
Goren-Bar et al. (2006), previous experience with natural voice interaction was regarded as “quite limited”
(p. 7), without having measured this in the sample. In the ‘Effect sizes’ sections of the previously
mentioned categories of individual difference, experience was sometimes mentioned already. Most
often, a certain predictor explained extra variance over the effect of experience (e.g. stepwise
regression) or the total amount of variance explained by the tested model containing experience and
other predictors was mentioned (i.e. R2). For instance, one study mentioned an effect size of experience (together with gender), which was found to explain 20% of the variance in number of posts
about oneself (Moore & McElroy, 2012).
Furthermore, 14% of traits studies, 29% of cognitive style studies, 32% of cognitive and
psychomotor ability studies and none of the culture studies controlled for domain knowledge. This
amounts to 17% of the total number of studies. Some studies measure domain knowledge (and/or
experience) but do not test for any effects these might have. For example, Yuan et al. (2011) mention
they have measured domain knowledge and experience with an information search system, but do not
provide any results on their potential effects. In other studies, a measure is provided but the authors
mention that none had any prior knowledge of the domain (Angeli, 2013). Measures of domain
knowledge were often in the form of a pre-test for prior knowledge (e.g. Lee & Shin, 2011). One study
that performed stepwise analyses shows that variance explained in preference for working in virtual
teams vs. preference for working in face to face teams or alone was low for domain knowledge (R2 = .03; Luse et al., 2013), while another study showed higher variance explained by domain knowledge in
information seeking (R2 = 19% for complex problems and 17% for simple problems; Sharit et al., 2008).
Effects of age were controlled in 41% of traits studies, none of the cognitive style studies, 40%
of cognitive and psychomotor ability studies and 41% of culture studies. This amounts to 34% of the
total number of studies controlling for age. Several studies found age-related effects in cognitive and
psychomotor abilities. For example, Pak et al. (2008) found that age was no longer a predictor of
performance on an auditory voice response task after controlling for spatial ability, working memory