Determinants of occupational mobility: the importance of place of work
David McColluma, Ye Liuab*, Allan Findlaya, Zhiqiang Fengc, Glenna Nightingalea
Abstract
This research focuses on individual and place-based determinants of occupational mobility in Scotland 2001-2011. The originality of the paper relates to the importance of workplace location, rather than residential locations, on occupational mobility, and in the questioning of the idea that spatial mobility accelerates occupational mobility. The findings also indicate that skill level and employment in ‘knowledge intensive’ sectors are key determinants of career progression. Urban career escalator effects are found to be particularly evident for higher skilled workers. The findings point to the importance of spatial sophistication and sectoral sensitivity in understandings of occupational mobility.
Keywords: escalator regions, place of work, migration, occupational mobility, Scotland JEL classification: J24, J61, J62, R23
a School of Geography and Geoscience, University of St Andrews, Irvince Building, North Street, St Andrews
KY16 9AL, UK.
b School of Geography and Planning, Sun Yat-sen University, Xingang W Rd, Haizhu, Guangzhou, 510275,
China.
c Institute of Geography, School of GeoSciences, University of Edinburgh, Drummond Street, Edinburgh,
EH8 9XP, UK
* Corresponding author
Acknowledgement
The help provided by staff of the Longitudinal Studies Centre – Scotland (LSCS) is acknowledged. The LSCS is supported by the ESRC/JISC, the Scottish Funding Council, the Chief Scientist’s Office and the Scottish Government. The authors alone are responsible for the interpretation of the data. Census output is Crown copyright and is reproduced with the permission of the Controller of HMSO and the Queen’s Printer for Scotland.
This work was supported by the ESRC under Grant ES/G027153/1.
Introduction
that offer extraordinary opportunities for it, raises the theoretically stimulating and policy pertinent question of how individual and place effects and spatial mobility combine to generate certain career outcomes for specific types of people in particular types of places. The research seeks to address the following research questions:
1. Which individual level characteristics are associated with upward occupational
mobility?
2. Is there evidence of place-based effects in the determinants of upward occupational
mobility?
3. Is spatial mobility a driver of upward occupational mobility?
Literature review
The notion that career success is and ought to be determined chiefly by one’s talents and efforts is inherent to understandings of social justice and economic productivity. As such the ability and propensity of individuals to move up or down the social ladder depending on their achievements has long been one of the foremost issues in the social sciences (Lipset and Bendix, 1959). In practice social mobility is often empirically assessed through measures of occupational mobility, as this reflects shifts in one’s standing on the socio-economic ladder (broadly defined as changes in occupation over a given time period). This research sits within the body of literature that is concerned with the determinants of occupational mobility, and the roles of place-based and individual characteristics in these processes (Fielding, 1992; Gordon, 2015; Newbold and Brown, 2012).
Despite being the focus of much discussion (Fielding, 1992; Gordon et al, 2015; van Ham et
al, 2012; Savage, 1988), the nature of relationship between spatial and social mobility remains
Occupational mobility: individual-level factors
Ideally, workers should progress within the labour market over time as they acquire the education, experience and skills that enable them to undertake increasingly qualified tasks (Rooth and Ekberg, 2006). In a meritocracy this process of workers moving up (and down) occupational categories would be based on their efforts and abilities. However career outcomes are patently based on more than just merit, and as such the research literature has focused on
issues such as persistent gender and ethnic inequalities in occupational mobility (Dex et al,
2008; Fleming et al, 2016). Setting aside wider structural inequalities (Crawford et al, 2011),
research undertaken in various spatial and temporal contexts points to a number of key individual factors consistently being determinants of occupational progression.
Age is one important predictor of occupational mobility: career progression is faster at early stages, while careers stabilize later as workers tend to reach ‘occupational maturity’ (Manzoni
et al, 2014). Whilst the magnitude of the effect is decreasing, gender is still an important determinant of occupational mobility, mainly due to women’s careers being sensitive to family related factors such as childbearing and the career interruptions and reduced working hours that are associated with these events (Blossfeld and Hakim, 1997). The research literature also
points to education (van Ham et al, 2012; Sicherman and Galor, 1990) and social class
background being powerful determinants of career success (Härkönen and Bihagen, 2011), with the relative strengths of these effects varying spatially and temporally (Tolsma and
Wolbers, 2014). Finally, whilst difficult to quantify, Ng et al (2007) and Gordon (2015) have
highlighted how individual personality traits, career interests and ambitions, values and attachment styles can influence the mobility of workers within the occupational hierarchy.
Occupational mobility: place-based factors
Whilst it is widely accepted that individual attributes such as career ambitions play an important role in shaping career outcomes, economic and urban geographers and regional economists have emphasised the ways in which locational factors influence occupational trajectories. Local labour market ‘tightness’ is one such factor, and occupational mobility is procyclical, meaning that it is greater during recovery and boom periods and lower during
performance, since places which perform better across the business cycle and have more
buoyant labour markets in turn generate higher rates of career progression (Gordon et al, 2015).
Another factor is size: it is widely recognised that earnings and rates of career progression are significantly higher in large metropolitan areas than in smaller urban and rural locations, largely due to high productivity levels and a concentration of skilled workers in these locales (Brown and Newbold, 2012; Glaeser and Mare, 2001). These points reasonably infer that the characteristics of the labour market within which one is embedded are a key determinant of occupational mobility. However most studies that incorporate locational factors into analysis of social mobility focus on where people live rather than where they work. As discussed in more detail below, this research is innovative in that it includes both place of work and place of residence as potential determinants of career progression.
The literature relating to so-called world cities is also relevant to understanding the role of certain city-regions in career progression as they have long been recognised as points of destination for large numbers of domestic and international migrants due to the variety and quality of employment opportunities they offer (Friedmann, 1986). These ideas are of relevance to the Scottish context, since Edinburgh, and to a lesser extent Glasgow, are increasingly being recognised as offering positive opportunities for career progression and as
such attract migrants from the rest of the UK and further afield (van Ham et al, 2012). This
analysis investigates whether the premise that larger urban areas, particularly bigger cities, offer relatively beneficial rates of upward occupational mobility holds in the Scottish context. The discussion now turns to the relationship between spatial and occupational mobility.
Occupational mobility and spatial mobility
individual and place based determinants of occupational mobility. This spatially sensitive conceptual framework forms the rationale behind the third of the research questions posed above.
The notion that the migration of individuals that are well placed to achieve occupational mobility, to places that are well placed to offer it, sits within the literature on so-called escalator regions. This term was first coined by the geographer Tony Fielding in 1992 to refer to those urban centres that offer exceptional opportunities to climb the occupational hierarchy, and thus attract skilled and ambitious migrants. This framework was originally applied to London and the wider South East of England and encapsulates the notion that those with greatest ‘promotion potential’ are attracted to those regions which act as the fastest ‘escalators’ in terms of career progression. According to Fielding’s (1992) original exposition, the following three features defined escalator regions. Firstly, acting as a magnet for those with greatest promotion potential (stepping on the escalator). Secondly, providing residents with accelerated upward social mobility (promoted by the escalator). Finally, the loss via out migration of some of the initial migrants at later point in their careers (stepping off the escalator).
Fielding’s original framework has since formed the basis of a number of studies, predominantly in a European and North American context, into the influence of spatial mobility on
occupational mobility (Brown and Newbold, 2012; van Ham et al, 2012; King et al, 2015).
However there remains some uncertainty regarding the role that migration can have in career progression. Some have argued that the self-selectivity of migration means that migrants in escalator regions experience accelerated occupational mobility relative to non-migrants, as a
consequence of being more highly qualified (van Ham et al, 2012). Others have argued that it
is not because people are migrants that they benefit from the escalator process in specific city-regions, but that it is because migration is positively selective of the most highly educated that the effect is observed, and that they advance no more quickly than equivalently well qualified
and ambitious individuals originating from within the escalator region (Findlay et al, 2008).
Others contend that it is really those working in particular kinds of skilled jobs and in specific
sectors that gain most from career escalator effects (Gordon et al, 2015). This analysis tests
these ideas, along with the claim that similar escalator processes operate in cities that do not
Efforts to interrogate the spatial-social mobility nexus can fruitfully draw lessons from the growing literature that focuses on ‘mobilities’ in migration studies (King, 2012), as this relatively nascent paradigm emphasises the inherent connections between spatial mobility and other forms of mobility, such as career progression. Emphasis on the point that physical mobility is frequently motivated by the prospect of social mobility (Glick-Schiller and Salazar, 2013) encourages consideration of the ways in which moving between places can be a source of status and power, and that critically these processes operate in an uneven manner (Schiller and Urry, 2006). This recognition helps to widen understandings of mobility (and immobility) as occurring within particular social and economic relationships, rather than just purely in relation to geographic borders (Kalir, 2013). The new mobilties paradigm also encourages a rejection of longstanding binaries in the social sciences, particularly in this case between migration and other forms of spatial mobility, such as commuting (Halfacree, 2012). Such a conceptual lens is thus a helpful means through which the outcomes of empirical research into the determinants of career process and outcomes can be theorised.
Data and methods
Methodological approach: overview
By definition, analyses of geographic and occupational mobility rely on the availability of longitudinal data at suitable temporal and spatial scales. In fact it was the initial linking of decennial national census records in England and Wales through the ONS Longitudinal Study that enabled Fielding (1992) to propose and empirically verify his escalator region hypothesis. The current analysis makes use of the Scottish Longitudinal Study (SLS), a census derived 5.3 per cent representative sample of the population of Scotland that allows for the circumstances
of the same individuals to be tracked between the 1991, 2001 and 2011 censuses (Boyle et al,
2009). In this instance the study sample consisted of SLS members who were aged 16-45 in 1991 and who held a valid socio-occupational classification at each of the 1991, 2001 and 2011 censuses (summary statistics in Appendix Table 1).
occupational mobility. The study examines how a person’s residence and workplace at the start of a decade influences his/her job status change over the subsequent decade. An ordinary least squares (OLS) regression model examining the determinants of a person’s occupational mobility between 2001 and 2011 can be written as follows:
log(
J
01-11
)
U
01
M
01
S
01
X
01
J
01
log(
J
91-01
)
(1)where Δlog(J01-11)represents the job status change between 2001 and 2011. U01 denotes the
place of residence and the place of work in 2001; M01 indicates the presence of migration over
the decade of 1991-2001; S01 denotes the knowledge-intensive index of an individual’s
industrial sector in 2001; X01 denotes a vector of other individual-specific characteristics in
2001; J01 denotes job status level in 2001, which is used to capture both floor and ceiling effects
(Gordon et al, 2015; van Ham et al, 2012); Δlog(J91-01)represents the job status change between
1991 and 2001, which was included in the model to further control for unobserved
heterogeneity (e.g. career ambition); and ε denotes unobservable errors.
It is worth noting that, although the SLS is a longitudinal dataset in nature, this study conducted a cross-sectional analysis instead of a longitudinal analysis. One may argue that it is possible to make two repeated observations of individuals’ job status change over the period of 1991-2011 and to examine factors underlying individuals’ job status change using a longitudinal analysis. However, using a longitudinal analysis such as a first-difference approach is problematic in this case (Wooldridge, 2012), because key explanatory variables in regressions (i.e. place of residence, place of work and the presence of migration) do not vary much over time (less than ten percent respondents reported the presence of migration over the periods of 1991-2001 and 2001-2011). Therefore, a cross-sectional type analysis was used to examine the links between key explanatory variables and individuals’ job status change over the decade of 2001-2011.
Refined measure of occupational mobility
Many analyses of occupational mobility rely on a relatively crude measure of career progression, that is upward movement into one of the top main social class groupings from a
lower social class grouping (Findlay et al, 2008; van Ham et al, 2012). The more refined
across a large number of discrete occupational categories using an innovative measure of job status. Such a perspective is of value since in the study sample nearly four fifths of those in a high skilled socio-economic group in 2001 remained within this category by 2011, and thus any career progression made by these individuals 2001-2011 would not be captured through traditional measures of occupational mobility.
Rather than rely on broad socio-economic classifications, this research operates on the logic that the value that the labour market attaches to occupations through wages is an effective measure of occupational standing and thus change. This approach, inspired by Nickell (1982)
and Gordon et al (2015), reasons that market evaluations (i.e. wages) are a more apposite
reflection of relevant labour market supply and demand factors than the more value laden judgements concerning which jobs are superior that class-based analyses entail. Unfortunately, as a census-based dataset, the SLS does not contain information on income. Consequently this analysis uses the Labour Force Survey, and controls for inflation, to construct estimates of earnings specific to particular occupations (Dibben and Clemens, 2012). As SOC information is highly detailed (81 groups 2001-2010 and 90 in 2011-2015), the synthesised weekly wage can form the basis of a job status index (van Ham and Manley, 2015). Upward occupational mobility in this study is defined as having an occupation with a higher job status index in 2011 than 2001. Individuals’ job status changes over this decade are regressed on a set of other census-based indicators in order to investigate the determinants of occupational mobility.
Spatial sophistication of analysis
Place and migration naturally sit at the centre of understandings of the spatial–social mobility nexus. Much research, through focusing on the potential escalator effect of London and the South East of England has simply aggregated these two Government Office Regions and compared occupational trajectories in this large area (population 18 million) against those in
the rest of the country (Champion, 2012; Fielding, 2007; Findlay et al, 2008; Reuschke, 2015).
capital city and is the seat of the country’s devolved government. The economically buoyant city hosts the headquarters of a range of public sector, financial and other business institutions. Glasgow is the biggest city in Scotland and is one of the largest cities in the UK. The former industrial powerhouse suffered widespread job losses due to post-war economic restructuring, but has since reinvented itself as a major retail, entertainment and cultural hub. In career terms, the attractiveness of these cities to migrants lies in their enhanced opportunities for employment and their concentration of higher ranking jobs. Edinburgh has a much higher proportion of jobs in the top main three standard occupational classifications than both the Scottish and UK averages (57%, 43% and 46% respectively). Average earnings also far exceed the Scottish and UK averages and the city has three times the volume of finance jobs than Scotland and the UK generally (ONS, 2017a). Whilst Glasgow’s labour market is not as buoyant as Edinburgh’s the city is home to a higher share of top ranking jobs than the Scottish and UK averages and has an impressive jobs density (1.04). The city has a relatively high share of jobs in the information and communication, finance and health sectors relative to the rest of Scotland and UK (ONS, 2017b). The ‘other urban area’ category contains places with a population in excess of 125,000: the cities of Dundee and Aberdeen and some densely populated parts of the Central Belt (see Fraser of Allander Institute, 2015 for details of economic performance of Scotland’s cities). Finally the rest of Scotland category contains those locations with a population smaller than 125,000.
lives, and thus can contribute to an enhanced understanding of the nature of place based predictors of occupational mobility.
An additional aspect of importance concerning the spatial-social mobility nexus relates to how migration is measured. A challenge associated with assessing the migration experiences of members of census based longitudinal datasets is that the significant time lapse between censuses means that researchers only have information about respondents’ location (and occupational status) at ten year intervals, with subsequent significant gaps in understanding of their circumstances between these periods. As such researchers must turn to imperfect indictors of spatial mobility. One such proxy is country of birth. As migration is a selective process, people who migrate from other parts of the UK or other countries to Scotland are hypothesised to be relatively skilled and ambitious and therefore perform well in terms of labour market
mobility (van Ham et al, 2012).
Whilst a general indicator of the presence of migration, the main limitations of the country of birth measure are that it does not give an indication of when someone actually moved to Scotland and it cannot account for mobility within Scotland. For these reasons a further measure of geographic mobility was developed: presence of migration. This study classified individuals who changed their residential location by a distance greater than 40km over the decade between the 1991 and 2001 censuses as migrants. This distance threshold was set so as to filter out short-distance residential housing related mobilities that most likely do not involve a change of workplace. For robustness the analysis also tests the effects of presence of
migration on subsequent occupational mobility using a variety of distance cut-offs (Abreu et
al, 2014).
Sectoral and gender sensitivity
This analysis incorporated a knowledge intensive index to reflect the fact that career
progression rates vary across different industries (Glaeser and Mare, 2001; Gordon et al, 2015).
for the relative effect of working in particular sectors, along with other potential determinants of occupational mobility. The modelling of job status change was carried out separately for male and female sample members, given the significant and longstanding gender differentials
that exist in terms of earnings and occupational mobility patterns and processes (Dex et al,
2008; Xu et al, 2006). This gender sensitivity was especially important since existing analyses
have pointed to women’s career progression being especially sensitive to escalator effects (Fielding and Halford, 1993), potentially due to larger labour markets being more open to female advancement than provincial ones (Bruegel, 2000).
Temporal sequencing of events
The motivation for assessing spatial mobility 1991-2001 against subsequent occupational mobility 2001-2011 was to negate the common criticism that this type of research does not account for the direction of influence i.e. the timing and sequencing of changes in location and job status. Many individuals will experience both spatial and occupational mobility over a ten-year period, but the decade gap between censuses means that researchers only have access to information about their location and job status at beginning and end of this period. As such a longstanding challenge is that it is difficult to infer whether occupational mobility precedes,
occurs in conjunction with, or follows spatial mobility (Findlay et al, 2009). A pragmatic
response to this quandary is to assess spatial and occupational mobility over separate consecutive time periods, as is the case in this analysis. This perspective improves on the conventional approach of assessing social and spatial mobility over the same period (Gordon
et al, 2015; Newbold and Brown, 2012; Fielding, 1992). A drawback however of this approach is that it may fail to fully capture the relationship between spatial and social mobility due to the potentially lengthy time lapses between identifiable events.
Accounting for selection bias
of the escalator effect (or migration effect). This problem is partially addressed in this research through the use of lagged dependent variables (job status level in 2001 and occupational mobility 1991-2001) in the regressions. Propensity score matching techniques are used to control for either spatial selectivity or migration selectivity due to observed characteristics such as educational qualification (Newbold and Brown, 2012; Rosenbaum and Rubin, 1983). However, selection bias could not be completely removed by controlling for unobserved ability and ambition due to the following reasons. First, proxy variables for ability and ambition are not available in census-based SLS dataset. Second, fixed-effect panel data models are not feasible due to the structure of the dependent variable (which is the change of occupational status over a decade rather than a certain level of occupational status). Third, there is a lack of a suitable instrumental variable that predicts the place of work or residence (or migration) and is orthogonal to unobserved ability.
Results
The geography of occupational mobility
in Table 1 is the much higher rates of upward occupational mobility amongst longer distance movers (23.95% versus 15.90% for males, and 20.75% versus 15.25% for females).
Table 1: The percentage of SLS members moving from lower into high skill occupational categories in 2001-2011a, by place of work and residence in 2001 and by the presence of migration (40km+) 1991-2001
By place of
residence 2001 By place of work 2001 Male Female Male Female
Glasgow 13.24 12.65 20.95 18.43
Edinburgh 19.88 19.40 20.79 19.96
Other large urban 17.28 15.86 19.95 19.66
Rest of Scotland 15.81 15.25 18.11b
Yes No
Male Female Male Female
Migration (40km+) 1991-2001 23.95 20.75 15.90 15.25
Note: a. High skill occupation: NS-SEC groups 1 & 2, lower skill categories: NS-SEC groups 3, 5, 6 & 7. NS-SEC group 4 (small employers and own account workers) excluded as this covers a variety of skill levels. b. These statistics differentiated by gender are not available because the corresponding cell counts are less than 10.
Source: Author’s analysis of the SLS
In order to investigate these ideas in more depth, the researchers examined the reasons that might underlie uneven geographies of upward occupational mobility in Scotland. One possible line of enquiry was to explore whether geographic variations in individual characteristics (either based on structural divisions in society or inequalities in the organisation of labour market opportunities) could account for variations in personal advancement. A second line of inquiry was to move away from the crude measure of occupational mobility employed in Table 1 and to base inferential statistical examination on a more sophisticated continuous measure of occupational advancement as previously introduced in the methodology section. Interestingly, as shown in Appendix Table 2, those working in Glasgow seemingly enjoy the highest rate of upward occupational mobility, with those working in Edinburgh apparently having the lowest rates of upward mobility. This result is another motivating factor behind the use of multiple regression modelling.
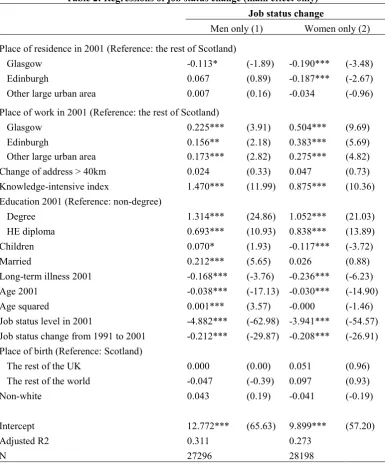
Determinants of occupational mobility: all workers
occupational mobility according to place of work as well as place of residence: living in particular places is not necessarily associated with better rates of career progression, but working in larger urban areas is. Glasgow workers experience the highest upward mobility (0.225 and 0.504 log points for men and women, respectively). Edinburgh workers enjoy higher level of occupational progress than those working in the rest of Scotland (0.156 and 0.383 log points). The results confirm that place of work appears to exert particular influence on occupational mobility in the case of women’s careers. As might be expected, working in knowledge intensive industries and higher levels of education are positively associated with
upward occupational mobility (Gordon et al, 2015). Again, in line with the existing literature,
familial circumstances (marriage and the existence of children) impact differently on the career
outcomes of and women (Dex et al, 2008). Being married and living with dependent children
Table 2: Regressions of job status change (main effect only)
Job status change
Men only (1) Women only (2)
Place of residence in 2001 (Reference: the rest of Scotland)
Glasgow -0.113* (-1.89) -0.190*** (-3.48)
Edinburgh 0.067 (0.89) -0.187*** (-2.67)
Other large urban area 0.007 (0.16) -0.034 (-0.96)
Place of work in 2001 (Reference: the rest of Scotland)
Glasgow 0.225*** (3.91) 0.504*** (9.69)
Edinburgh 0.156** (2.18) 0.383*** (5.69)
Other large urban area 0.173*** (2.82) 0.275*** (4.82)
Change of address > 40km 0.024 (0.33) 0.047 (0.73)
Knowledge-intensive index 1.470*** (11.99) 0.875*** (10.36)
Education 2001 (Reference: non-degree)
Degree 1.314*** (24.86) 1.052*** (21.03)
HE diploma 0.693*** (10.93) 0.838*** (13.89)
Children 0.070* (1.93) -0.117*** (-3.72)
Married 0.212*** (5.65) 0.026 (0.88)
Long-term illness 2001 -0.168*** (-3.76) -0.236*** (-6.23)
Age 2001 -0.038*** (-17.13) -0.030*** (-14.90)
Age squared 0.001*** (3.57) -0.000 (-1.46)
Job status level in 2001 -4.882*** (-62.98) -3.941*** (-54.57)
Job status change from 1991 to 2001 -0.212*** (-29.87) -0.208*** (-26.91)
Place of birth (Reference: Scotland)
The rest of the UK 0.000 (0.00) 0.051 (0.96)
The rest of the world -0.047 (-0.39) 0.097 (0.93)
Non-white 0.043 (0.19) -0.041 (-0.19)
Intercept 12.772*** (65.63) 9.899*** (57.20)
Adjusted R2 0.311 0.273
N 27296 28198
Notes: ***, **, * denote statistical significance at 1%, 5%, and 10% level, respectively. Numbers in parentheses are t values. Robust variance estimators are computed.
Source: Authors’ analysis of SLS
migration effect is that the direction of migration is not taken into account. For example, people moving from non-escalator to escalator regions are expected to experience higher rates of upward mobility compared with those moving in the opposite direction. However, when residential locations in both 1991 and 2001 were included in the regressions, no evidence suggested that the direction of migration mattered for individuals’ occupational mobility (results are shown in Appendix Table 3).
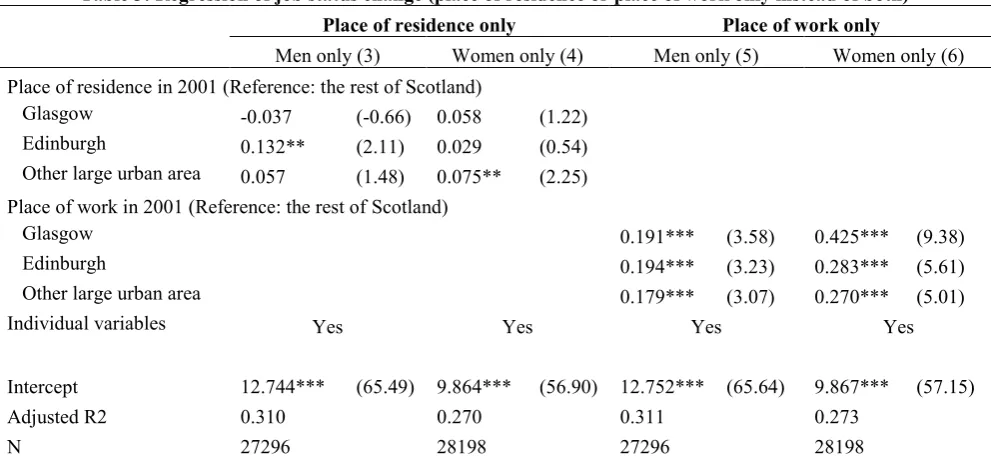
Table 3: Regression of job status change (place of residence or place of work only instead of both) Place of residence only Place of work only
Men only (3) Women only (4) Men only (5) Women only (6)
Place of residence in 2001 (Reference: the rest of Scotland)
Glasgow -0.037 (-0.66) 0.058 (1.22)
Edinburgh 0.132** (2.11) 0.029 (0.54)
Other large urban area 0.057 (1.48) 0.075** (2.25)
Place of work in 2001 (Reference: the rest of Scotland)
Glasgow 0.191*** (3.58) 0.425*** (9.38)
Edinburgh 0.194*** (3.23) 0.283*** (5.61)
Other large urban area 0.179*** (3.07) 0.270*** (5.01)
Individual variables Yes Yes Yes Yes
Intercept 12.744*** (65.49) 9.864*** (56.90) 12.752*** (65.64) 9.867*** (57.15)
Adjusted R2 0.310 0.270 0.311 0.273
N 27296 28198 27296 28198
Notes: ***, **, * denote statistical significance at 1%, 5%, and 10% level, respectively. Numbers in parentheses are t values. Robust variance estimators are computed.
18
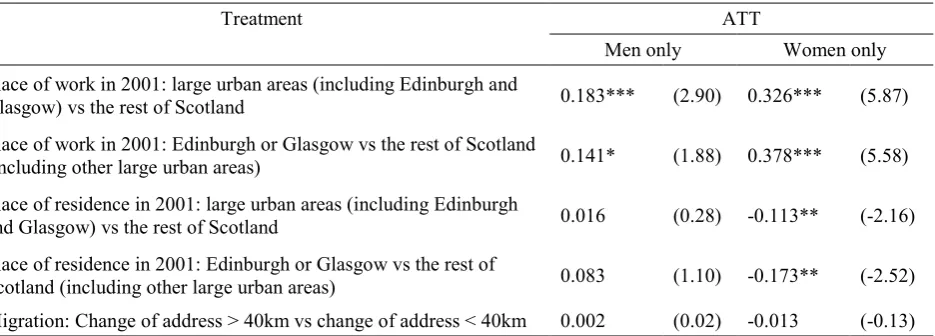
Table 4: Propensity score matching estimates of escalator effect and migration effect on job status change
Treatment ATT
Men only Women only
Place of work in 2001: large urban areas (including Edinburgh and
Glasgow) vs the rest of Scotland 0.183*** (2.90) 0.326*** (5.87)
Place of work in 2001: Edinburgh or Glasgow vs the rest of Scotland
(including other large urban areas) 0.141* (1.88) 0.378*** (5.58)
Place of residence in 2001: large urban areas (including Edinburgh
and Glasgow) vs the rest of Scotland 0.016 (0.28) -0.113** (-2.16)
Place of residence in 2001: Edinburgh or Glasgow vs the rest of
Scotland (including other large urban areas) 0.083 (1.10) -0.173** (-2.52)
Migration: Change of address > 40km vs change of address < 40km 0.002 (0.02) -0.013 (-0.13)
Note: ***, **, * denote statistical significance at 1%, 5%, and 10% level, respectively. Numbers in parentheses are t values. ATT: the average treatment effect on the treated. The outcome is job status change between 2001 and 2011. The treatment is working in large urban areas for model 1, working in escalator regions for model 2, living in large urban areas for model 3, living in escalator regions for model 4, and the presence of migration for model 5. Edinburgh, Glasgow, and other large urban areas are combined to generate a treatment group. Logit models are used to calculate the propensity scores, and bootstrapping is used to obtain standard errors for the matching estimators. Other variables included in the logit models are the same with those in Table 2. Single nearest-neighbour matching is used.
Source: Authors’ analysis of SLS.
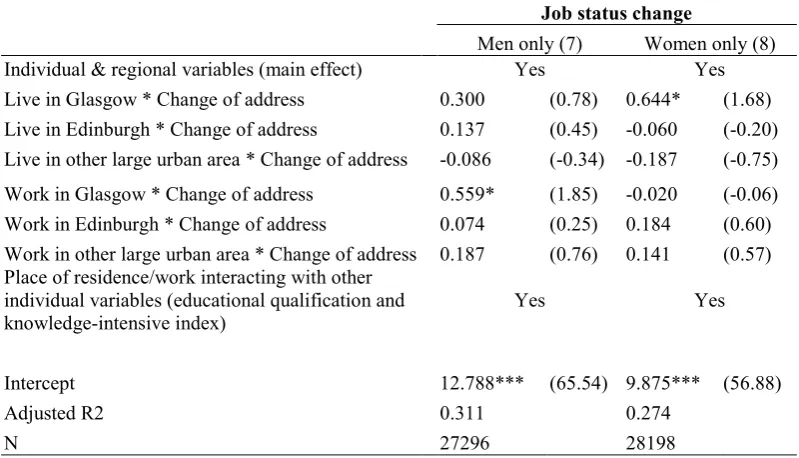
In an attempt to substantiate this conclusion, further robustness tests were carried out to
investigate whether movement into particular labour markets as opposed to movement per se
19
Table 5: Interaction effects, regressions of job status change (main effect and interaction)
Job status change
Men only (7) Women only (8)
Individual & regional variables (main effect) Yes Yes
Live in Glasgow * Change of address 0.300 (0.78) 0.644* (1.68)
Live in Edinburgh * Change of address 0.137 (0.45) -0.060 (-0.20)
Live in other large urban area * Change of address -0.086 (-0.34) -0.187 (-0.75)
Work in Glasgow * Change of address 0.559* (1.85) -0.020 (-0.06)
Work in Edinburgh * Change of address 0.074 (0.25) 0.184 (0.60)
Work in other large urban area * Change of address 0.187 (0.76) 0.141 (0.57)
Place of residence/work interacting with other individual variables (educational qualification and
knowledge-intensive index) Yes Yes
Intercept 12.788*** (65.54) 9.875*** (56.88)
Adjusted R2 0.311 0.274
N 27296 28198
Notes: ***, **, * denote statistical significance at 1%, 5%, and 10% level, respectively. Numbers in parentheses are t values. Robust variance estimators are computed.
Source: Authors’ analysis of SLS
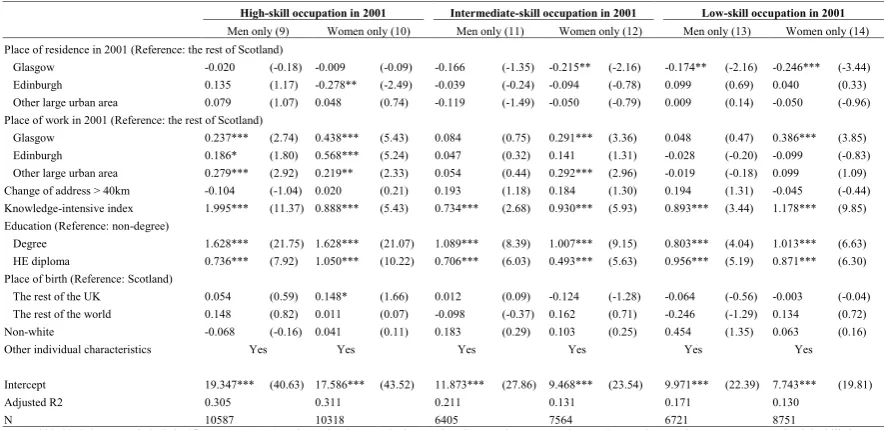
Determinants of occupational mobility: by skill group
The analysis thus far has modelled the drivers of the career progress of all workers in Scotland over the period 2001-2011, and found little evidence in support of geographic mobility determining subsequent occupational mobility. However the literature suggests that it is in fact the careers of higher skilled workers that are most sensitive to the escalator effects offered by
escalator regions (Gordon et al, 2015; Newbold and Brown, 2012). To test this thesis, the study
20
Table 6: Regressions of job status change (by different skill groups, main effect only)
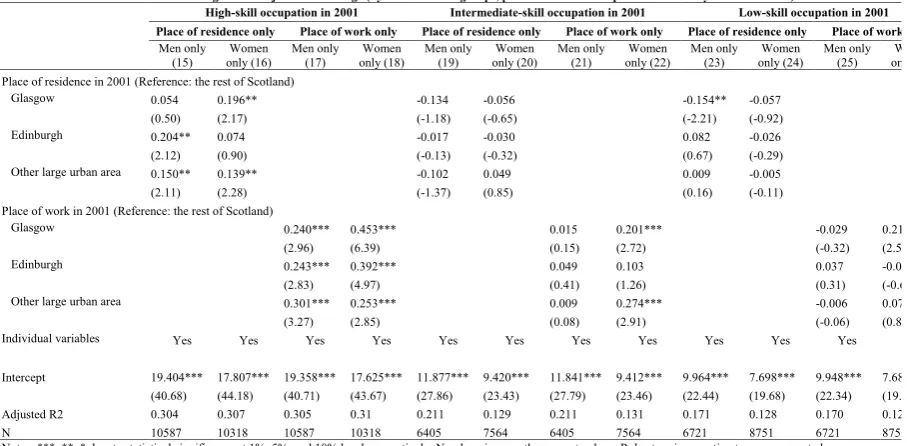
The results show that the escalator effects of being located in a large urban labour market are chiefly applicable to higher skilled groups, and exert a relatively strong effect on women’s career trajectories. More specifically, high skilled female workers in Edinburgh, Glasgow, and other large urban areas on average have upward mobility 0.568, 0.438, and 0.219 log points, respectively, faster than their counterparts in the rest of Scotland. The career progression 2001-2011 of those already in high skilled positions in 2001 benefits from working in a large urban area, whereas this is largely not the case for those in lesser skilled positions (except women working in Glasgow). These effects are especially strong for female levels of occupational mobility, where the impact of working in Edinburgh and Glasgow is particularly noteworthy. Whilst showing that the escalator effects of working in a city operate chiefly for higher skilled workers (especially women), the contents of Table 6 do not contradict the earlier finding concerning spatial mobility. In line with Gordon (2015), this suggests that all workers in big cities benefit from escalator effects, not just those who have moved there in search of enhanced career progression. This finding is further supported by model results when only place of residence or place of work is included in the models (Table 7).
High-skill occupation in 2001 Intermediate-skill occupation in 2001 Low-skill occupation in 2001
Men only (9) Women only (10) Men only (11) Women only (12) Men only (13) Women only (14) Place of residence in 2001 (Reference: the rest of Scotland)
Glasgow -0.020 (-0.18) -0.009 (-0.09) -0.166 (-1.35) -0.215** (-2.16) -0.174** (-2.16) -0.246*** (-3.44) Edinburgh 0.135 (1.17) -0.278** (-2.49) -0.039 (-0.24) -0.094 (-0.78) 0.099 (0.69) 0.040 (0.33) Other large urban area 0.079 (1.07) 0.048 (0.74) -0.119 (-1.49) -0.050 (-0.79) 0.009 (0.14) -0.050 (-0.96) Place of work in 2001 (Reference: the rest of Scotland)
Glasgow 0.237*** (2.74) 0.438*** (5.43) 0.084 (0.75) 0.291*** (3.36) 0.048 (0.47) 0.386*** (3.85) Edinburgh 0.186* (1.80) 0.568*** (5.24) 0.047 (0.32) 0.141 (1.31) -0.028 (-0.20) -0.099 (-0.83) Other large urban area 0.279*** (2.92) 0.219** (2.33) 0.054 (0.44) 0.292*** (2.96) -0.019 (-0.18) 0.099 (1.09) Change of address > 40km -0.104 (-1.04) 0.020 (0.21) 0.193 (1.18) 0.184 (1.30) 0.194 (1.31) -0.045 (-0.44) Knowledge-intensive index 1.995*** (11.37) 0.888*** (5.43) 0.734*** (2.68) 0.930*** (5.93) 0.893*** (3.44) 1.178*** (9.85) Education (Reference: non-degree)
Degree 1.628*** (21.75) 1.628*** (21.07) 1.089*** (8.39) 1.007*** (9.15) 0.803*** (4.04) 1.013*** (6.63) HE diploma 0.736*** (7.92) 1.050*** (10.22) 0.706*** (6.03) 0.493*** (5.63) 0.956*** (5.19) 0.871*** (6.30) Place of birth (Reference: Scotland)
The rest of the UK 0.054 (0.59) 0.148* (1.66) 0.012 (0.09) -0.124 (-1.28) -0.064 (-0.56) -0.003 (-0.04) The rest of the world 0.148 (0.82) 0.011 (0.07) -0.098 (-0.37) 0.162 (0.71) -0.246 (-1.29) 0.134 (0.72) Non-white -0.068 (-0.16) 0.041 (0.11) 0.183 (0.29) 0.103 (0.25) 0.454 (1.35) 0.063 (0.16) Other individual characteristics Yes Yes Yes Yes Yes Yes
Intercept 19.347*** (40.63) 17.586*** (43.52) 11.873*** (27.86) 9.468*** (23.54) 9.971*** (22.39) 7.743*** (19.81) Adjusted R2 0.305 0.311 0.211 0.131 0.171 0.130
21
Discussion and conclusions
[image:21.595.72.526.78.301.2]The overarching aim of this study has been to contribute to understandings of how individual and place characteristics, and geographic mobility, act together to influence career progression, as measured through the concept of occupational mobility. The most original findings relate to the importance of locational effects in these dynamics, with the statistical modelling demonstrating that place matters in terms of one’s propensity to move up the occupational hierarchy. The spatial sophistication of analysis was innovative in this respect since it shows that workplace is a much better predictor of occupational mobility than place of residence (the conventional measure of place effects). This distinction is important since, as the case of Glasgow illustrates, many individuals reside outside the boundaries of cities but commute to and work in them. Changing migration-commuting thresholds (how a worker negotiates the relationship between place of work and place of residence) could potentially explain some of the findings reported in this paper. Research thus needs to be sensitive to how commuting patterns might skew analyses of the role of place in career progression. A possible way forward in this respect could be to incorporate Travel to Work Areas (TTWAs) into statistical models, and thus integrate city regions with their commuting hinterlands. At the aggregate level in Scotland, longer distance commutes increased only marginally between the 2001 and 2011 censuses (12.5% and 13.6% of commutes respectively were 20km+) whereas the proportion of movers was fairly constant over this period (11.6% and 11.3% of the population changed address in 2000-2001 and 2010-2011 respectively).
Table 7: Regression of job status change (by different skill groups, place of residence or place of work only instead of both)
High-skill occupation in 2001 Intermediate-skill occupation in 2001 Low-skill occupation in 2001 Place of residence only Place of work only Place of residence only Place of work only Place of residence only Place of work only
Men only (15) Women only (16) Men only (17) Women only (18) Men only (19) Women only (20) Men only (21) Women only (22) Men only (23) Women only (24) Men only (25) Women only (26) Place of residence in 2001 (Reference: the rest of Scotland)
Glasgow 0.054 0.196** -0.134 -0.056 -0.154** -0.057 (0.50) (2.17) (-1.18) (-0.65) (-2.21) (-0.92) Edinburgh 0.204** 0.074 -0.017 -0.030 0.082 -0.026 (2.12) (0.90) (-0.13) (-0.32) (0.67) (-0.29) Other large urban area 0.150** 0.139** -0.102 0.049 0.009 -0.005 (2.11) (2.28) (-1.37) (0.85) (0.16) (-0.11) Place of work in 2001 (Reference: the rest of Scotland)
Glasgow 0.240*** 0.453*** 0.015 0.201*** -0.029 0.219**
(2.96) (6.39) (0.15) (2.72) (-0.32) (2.54)
Edinburgh 0.243*** 0.392*** 0.049 0.103 0.037 -0.059
(2.83) (4.97) (0.41) (1.26) (0.31) (-0.66)
Other large urban area 0.301*** 0.253*** 0.009 0.274*** -0.006 0.074
(3.27) (2.85) (0.08) (2.91) (-0.06) (0.88)
Individual variables Yes Yes Yes Yes Yes Yes Yes Yes Yes Yes Yes Yes
Intercept 19.404*** 17.807*** 19.358*** 17.625*** 11.877*** 9.420*** 11.841*** 9.412*** 9.964*** 7.698*** 9.948*** 7.688*** (40.68) (44.18) (40.71) (43.67) (27.86) (23.43) (27.79) (23.46) (22.44) (19.68) (22.34) (19.65) Adjusted R2 0.304 0.307 0.305 0.31 0.211 0.129 0.211 0.131 0.171 0.128 0.170 0.129 N 10587 10318 10587 10318 6405 7564 6405 7564 6721 8751 6721 8751 Notes: ***, **, * denote statistical significance at 1%, 5%, and 10% level, respectively. Numbers in parentheses are t values. Robust variance estimators are computed.
22
A core component of this research was the potential role that spatial mobility plays in social mobility. Whilst the descriptive statistics (Table 1) inferred that those who moved in 1991-2001 subsequently experienced higher rates of upward occupational mobility 1991-2001-2011 than those who did not move, the presence of migration was not a significant determinant of career progression in the statistical models used in this analysis. These findings fit with existing research in other spatial contexts in that it suggests that larger urban areas offer opportunities for accelerated occupational mobility for those who work there (Brown and Newbold, 2012), regardless of whether or not they migrated there. These place effects were strongest for those already near the top of the occupational hierarchy and for women. Therefore in Scotland, as elsewhere, highly skilled migrants benefit from the escalator effects offered by particular
regions (Findlay et al, 2008; Newbold and Brown, 2012) but no more so than the well-educated
residents already working in them (Gordon, 2015). The spatially uneven nature of labour market opportunities has implications for efforts to promote a meritocracy: to gain optimal career progression one must not only be highly skilled, but must also work in (through originally residing in or commuting or migrating to) specific types of places. Locational factors thus exert a significant enabling, and also constraining, influence on the ability and propensity of individuals to achieve upward occupational mobility. This leads to the pertinent question of whether the spatial mobility of able workers towards escalator regions should be facilitated, or whether the currently increasing spatial disparities in earnings in many countries should be the focus of greater policy attention.
23
potential interesting sector specific escalator effects. For example the city of Aberdeen may offer particular types of accelerated career progress as a consequence of its concentration of jobs in the oil and gas sector. However potential challenges associated with low cells counts has necessitated the aggregation of geographic areas in this investigation.
In addition to the substantive findings listed above, the study has also responded to calls for
methodological innovations within the burgeoning mobilities paradigm (Findlay et al, 2015).
Firstly, it has demonstrated how estimates of wage levels can be applied to census based datasets in order to generate more sophisticated measures of job status change. Secondly, by using relatively small geographical units the research highlights and underlines the importance of refined spatial indicators in these types of analyses, as demonstrated by the difference between the influence of place of work and place of residence on career progression. Thirdly, the analysis underlines the extent to which place based determinants of occupational mobility are structured according to gender, with escalator effects being particularly evident for highly skilled females in larger urban areas. A fruitful avenue for future research would be to seek explanation for why escalator effects play out differently for men and women. Fourthly, by focusing on Scotland the investigation confirms that escalator effects can occur beyond core global city regions. Finally, by investigating occupational mobility over the period 2001-2011 the research is one of the first studies to cover a period post the 2008 financial crash. Future research could examine how this period of economic change and uncertainty has impacted on patterns and processes of social mobility, perhaps drawing on the recently instigated UK Household Longitudinal Study for example.
References
Abreu, M., Faggian, A., & McCann, P. (2014). Migration and inter-industry mobility of UK
graduates. Journal of Economic Geography, 15, 353–385.
Blossfeld, H. P., & Hakim, C. (Eds.). (1997). Between equalization and marginalization:
Women working part-time in Europe and the United States of America. New York: Oxford University Press.
Boyle, P. J., Feijten, P., Feng, Z., Hattersley, L., Huang, Z., Nolan, J., & Raab, G. (2009).
Cohort profile: the Scottish longitudinal study (SLS). International Journal of Epidemiology,
24
Brown, W., & Newbold, K. (2012). Cities and Growth: Moving to Toronto – Income Gains Associated with Large Metropolitan Labour Markets. Statistics Canada. Economic Analysis Division.
Bruegel, I. (2000). The restructuring of London's labour force: migration and shifting
opportunities 1971-1991. Area, 32(1), 79-90.
Champion, T. (2012). Testing the return migration element of the ‘escalator region’ model:
an analysis of migration into and out of south-east England, 1966–2001. Cambridge Journal
of Regions, Economy and Society, 5, 255–269.
Crawford, C., Johnson, P., Machin, S., & Vignoles, A. (2011). Social Mobility: A Literature Review. Report for UK Government, Department for Business, Innovation and Skills.
Dex, S., Ward, K., & Joshi, H. (2008). Gender differences in occupational wage mobility in
the 1958 cohort. Work, Employment and Society, 22(2). 263–280.
Dibben, C., & Clemens, T. (2012). Estimating an occupational based wage in the census: A mixed model approach to generate empirical bayes estimates. Edinburgh, 1-11.
Fielding, A. J. (1992). Migration and Social Mobility: South East England as an Escalator
Region. Regional Studies, 26 (1), 1-15.
Fielding, A. J. (2007). Migration and social mobility in urban systems: national and
international trends. In H. Geyer (ed) International Handbook of Urban Policy Volume 1
Contentious Global Issues (107-137). Edward Elgar: Cheltenham.
Fielding, A. T., & Halford, S. (1993). Geographies of opportunity: a regional analysis of
gender-specific social and spatial mobilities in England and Wales, 1971- 81. Environment and
Planning A, 25, 1421-1440.
Findlay, A., Mason, C., Harrison, R., Houston, D., & McCollum, D. (2008). Getting off the
escalator? A study of Scots out-migration from a global city region. Environment and Planning
A, 40(9), 2169-2185.
Findlay, A., Mason, C., Houston, D., McCollum. D,, & Harrison, R. (2009). Escalators, Elevators and Travelators: The Occupational Mobility of Migrants to South-East England.
Journal of Ethnic and Migration Studies, 35(6), 861-879.
Findlay, A. McCollum, D. Coulter, R. and Gayle, V. (2015). ‘New Mobilities Across the Life Course: a Framework for Analysing Demographically Linked Drivers of Migration’.
Population, Space and Place 21(4). pp 390-402.
25
Fraser of Allander Institute. (2015). Scotland’s Economic Powerhouses. Available at:
https://www.scottishcities.org.uk/site/assets/files/1221/foa_-_scotland_27s_economic_powerhouses_-_28-10-15_1.pdf
Accessed 3rd May 2017.
Friedmann, J. (1986). The world city hypothesis. Development and Change, 17, 69-83.
Glaeser, E., & Maré, D. (2001). Cities and Skills. Journal of Labor Economics, 19(2), 316-342.
Glick Schiller, N. and Salazar, N. (2013). ‘Regimes of Mobility Across the Globe’. Journal of Ethnic and Migration Studies 39:2. pp 183-200
Gordon, I. (2015). Ambition, Human Capital Acquisition and the Metropolitan Escalator.
Regional Studies, 49(6), 1042-1055.
Gordon, I., Champion, T., & Coombes, M. (2015). Urban escalators and interregional elevators: the difference that location, mobility, and sectoral specialisation make to
occupational progression. Environment and Planning A, 47, 588–606.
Halfacree, K. (2012). ‘Heterolocal Identities? Counter‐Urbanisation, Second Homes, and
Rural Consumption in the Era of Mobilities’. Population, Space and Place 18. pp 209-224.
Härkönen, J., & Bihagen, E. (2011). Occupational attainment and career progression in
Sweden. European Societies, 13(3), 451-479.
Kalir, B. (2013). ‘Moving Subjects, Stagnant Paradigms: Can the ‘Mobilities Paradigm’
Transcend Methodological Nationalism?’ Journal of Ethnic and Migration Studies 39:2. pp
311-327,
King, R. (2012). ‘Geography and migration studies: Retrospect and prospect’. Population, Space and Place 18. pp 134–153.
King, R., Lulle, A., Parutis, V., & Saar, M. (2015). Young Baltic Graduates Living and Working in London: From Peripheral Region to Escalator Region in Europe. Sussex Centre for Migration Research. Working Paper No. 82.
Lindstrom, D., & Ramírez, A. (2010). Pioneers and Followers: Migrant Selectivity and the
Development of U.S. Migration Streams in Latin America. Annals of the American Academy
of Political Social Science, 630(1), 53–77.
26
Manzoni, A., Harkonen, J., & Mayer, K. U. (2014). Moving on? A growth-curve analysis of
occupational attainment and career progression patterns in West Germany. Social Forces,
92(4), 1285–1312.
Newbold, K., & Brown, W. (2012). Testing and Extending the Escalator Hypothesis: Does the Pattern of Post-migration Income Gains in Toronto Suggest Productivity and/or Learning
Effects? Urban Studies, 49(15), 3447-3465.
Ng, T., Sorensen, K., Eby, L., & Feldman, D. (2007). Determinants of job mobility: A
theoretical integration and extension. Journal of Occupational and Organizational Psychology,
80, 363–386.
Nickell, S. J. (1982). ‘The determinants of occupational success in Britain’. Review of Economic Studies 49. pp 43–53
Office for National Statistics. (2017a). NOMIS local authority profile: Edinburgh. Available at: https://www.nomisweb.co.uk/reports/lmp/la/contents.aspx. Accessed 4th September 2017.
Office for National Statistics. (2017b). NOMIS local authority profile: Glasgow. Available at: https://www.nomisweb.co.uk/reports/lmp/la/contents.aspx. Accessed 4th September 2017.
Reuschke, D. (2015). Self-Employment as a Route In and Out of Britain's South East. Regional Studies, 49(4), 665-680.
Roosaar, L., Mõtsmees, P., & Varblane, U. (2014). Occupational mobility over the business
cycle. International Journal of Manpower, 35(6), 873-897.
Rooth, D., & Ekberg, J. (2006). Occupational Mobility for Immigrants in Sweden.
International Migration, 44(2), 57-77.
Rosenbaum, P., & Rubin. D. (1983). The Central Role of the Propensity Score in
Observational Studies for Causal Effects. Biometrica, 70(1), 1-55.
Savage, M. (1988). The Missing Link? The Relationship between Spatial Mobility and Social
Mobility. The British Journal of Sociology, 39(4), 554-577.
Sheller, M. and Urry, J. (2006). ‘The new mobilities paradigm’. Environment and Planning
A 38. pp 207-226
27
Tolsma, J., & Wolbers, M. (2014). Social origin and occupational success at labour market
entry in the Netherlands, 1931–80. Acta Sociologica, 57(3), 253–269.
van Ham, M., Findlay, A., Manley, D., & Feijten, P. (2012). Migration, Occupational
Mobility, and Regional Escalators in Scotland. Urban Studies Research, 2012, 1-15.
van Ham, M., & Manley, D. (2015). Occupational Mobility and Living in Deprived
Neighbourhoods: Housing Tenure Differences in ‘Neighbourhood Effects’. Applied Spatial
Analysis and Policy, 8, 309–324.
Wooldridge, J. (2012). Introductory Econometrics: A Modern Approach (5th Edition). OH:
South-Western Cengage Learning.
Xu, W., Tan, K. C., & Wang, G. (2006). Segmented local labor markets in postreform China:
Gender earnings inequality in the case of two towns in Zhejiang province. Environment and