Different Measures of Auditory and Visual Stroop
Interference and Their Relationship to Speech
Intelligibility in Noise
Sarah Knight1*, Antje Heinrich1
1MRC Institute of Hearing Research, University of Nottingham, United Kingdom
Submitted to Journal: Frontiers in Psychology Specialty Section:
Auditory Cognitive Neuroscience ISSN:
1664-1078 Article type:
Original Research Article Received on:
18 Oct 2016 Accepted on: 06 Feb 2017
Provisional PDF published on: 06 Feb 2017
Frontiers website link: www.frontiersin.org
Citation:
Knight S and Heinrich A(2017) Different Measures of Auditory and Visual Stroop Interference and Their Relationship to Speech Intelligibility in Noise. Front. Psychol. 8:230.
doi:10.3389/fpsyg.2017.00230 Copyright statement:
© 2017 Knight and Heinrich. This is an open-access article distributed under the terms of the
Creative Commons Attribution License (CC BY). The use, distribution and reproduction in other forums is permitted, provided the original author(s) or licensor are credited and that the original publication in this journal is cited, in accordance with accepted academic practice. No use, distribution or reproduction is permitted which does not comply with these terms.
This Provisional PDF corresponds to the article as it appeared upon acceptance, after peer-review. Fully formatted PDF and full text (HTML) versions will be made available soon.
Frontiers in Psychology | www.frontiersin.org
1
Different Measures of Auditory and Visual Stroop Interference
1
and Their Relationship to Speech Intelligibility in Noise
2
3
Sarah Knight1*, Antje Heinrich1
4 5
1Medical Research Council Institute of Hearing Research, University of Nottingham, 6
Nottingham, UK. 7
8
*Correspondence:
9
Sarah Knight 10
11 12
Keywords: speech-in-noise, inhibition, aging, Stroop tasks, scoring
13
2
Abstract
14
Inhibition – the ability to suppress goal-irrelevant information – is thought to be an important 15
cognitive skill in many situations, including speech-in-noise (SiN) perception. One way to 16
measure inhibition is by means of Stroop tasks, in which one stimulus dimension must be 17
named while a second, more prepotent dimension is ignored. The to-be-ignored dimension 18
may be relevant or irrelevant to the target dimension, and the inhibition measure – Stroop 19
interference (SI) – is calculated as the reaction time difference between the relevant and 20
irrelevant conditions. Both SiN perception and inhibition are suggested to worsen with age, 21
yet attempts to connect age-related declines in these two abilities have produced mixed 22
results. We suggest that the inconsistencies between studies may be due to methodological 23
issues surrounding the use of Stroop tasks. First, the relationship between SI and SiN 24
perception may differ depending on the modality of the Stroop task; second, the traditional SI 25
measure may not account for generalized slowing or sensory declines, and thus may not 26
provide a pure interference measure. 27
We investigated both claims in a group of 50 older adults, who performed two Stroop tasks 28
(visual and auditory) and two SiN perception tasks. For each Stroop task, we calculated 29
interference scores using both the traditional difference measure and methods designed to 30
address its various problems, and compared the ability of these different scoring methods to 31
predict SiN performance, alone and in combination with hearing ability. Results from the two 32
Stroop tasks were uncorrelated and had different relationships to SiN perception. Changing 33
the scoring method altered the nature of the predictive relationship between Stroop scores and 34
SiN perception, which was additionally influenced by hearing ability. These findings raise 35
questions about the extent to which different Stroop tasks and/or scoring methods measure 36
the same aspect of cognition. They also highlight the importance of considering additional 37
variables such as hearing ability when analysing cognitive variables. 38
3
1 Introduction
39
Inhibition – the ability to suppress goal-irrelevant information (MacLeod, 1991) – is thought 40
to be important in many situations. One of these situations is speech-in-noise (SiN) 41
perception, in which listeners aim to focus on the foreground (target speech) and ignore the 42
background (distractor) sound. The ability to inhibit irrelevant information has been 43
suggested to worsen with age (Hasher & Zacks, 1988), with implications across a variety of 44
cognitive domains including language, memory and attention (Burke, 1997; Stoltzfus, Hasher 45
& Zacks, 1996). This cognitive decline has potential consequences for everyday activities 46
such as reading and text comprehension (Dywan & Murphy, 1996) and even engaging in 47
appropriate social behaviour (von Hippel, 2007). The ability to understand speech-in-noise is 48
also observed to worsen with age, affecting the ability to hold conversations and engage in 49
social activities (CHABA, 1988). Given the suggested importance of inhibition for SiN 50
perception, researchers have begun to ask whether or not age-related declines in inhibition 51
could account, at least in part, for the observed difficulties older adults have when listening in 52
noisy environments. However, answering this question has been made difficult by the fact 53
that it is not clear what role modality plays in the measurement of inhibition (whether or not 54
inhibition tasks in different modalities measure the same underlying ability) and whether the 55
standard scoring method adequately accounts for other, unconnected, age-related changes. 56
In the following section we introduce two types of Stroop task, a paradigm commonly used to 57
assess inhibitory abilities and the focus of this study. We first explain the nature of Stroop 58
tasks, and discuss the effect perceptual modality has on task outcomes. Next, we explore the 59
effect of age-related changes on Stroop interference and consider potential underlying 60
mechanisms. Finally, we discuss the relationship between the most common outcome, 61
measure of Stroop interference, reaction times (RTs), and strength of inhibition, and propose 62
that trials which are responded to more slowly may not only represent inhibition more 63
accurately than trials responded to more quickly but may also better reveal differential levels 64
of inhibition between participants. We then turn to speech-in-noise perception, and discuss 65
the possible role of inhibition in SiN perception. In particular, we focus on the role inhibition 66
plays during lexical access, a key element of speech perception, and consider how changes 67
across the lifespan in lexical access effects might indicate age-related changes in inhibition. 68
Finally, we discuss the results obtained from existing studies designed to test the relationship 69
between inhibition and SiN perception, and suggest some reasons why these discrepancies 70
might arise. 71
1.1 Stroop tasks
72
One common means of assessing inhibition is by using variants of the Stroop task (Stroop, 73
1935). In the traditional visual colour-word Stroop task (ibid.), participants are required to 74
name the ink colour of a string of letters, irrespective of the letters themselves. The string of 75
letters can be either meaningless (e.g. XXXX) – the neutral condition – or can form a 76
conflicting colour word (e.g. BLUE printed in red) – the incongruent condition. Since word 77
reading is a more prepotent response than colour naming in this situation (Melara & Algom, 78
2003), word naming has the potential to interfere with colour naming. In order to prevent this 79
interference, participants must attempt to inhibit, or suppress, the incongruent word. The 80
difference in reaction time (RT) between colour naming in the neutral condition and colour 81
naming in the incongruent condition is taken as a measure of inhibitory ability, and termed 82
Stroop interference (SI). Besides the traditional visual paradigm, auditory versions of the 83
Stroop task have also been successfully used (e.g. Green & Barber, 1981; Morgan & Brandt, 84
1989). In auditory Stroop tasks, participants are required to respond as quickly as possible to 85
some perceptual feature of a word (e.g. speaker gender, voice pitch, stimulus location) while 86
4 ignoring the semantic information, which can be either irrelevant (e.g. “cat”) or conflicting 87
(e.g. “man” spoken by a woman, “low” in a high-pitched voice, “right” heard in the left ear). 88
Again, SI is typically obtained by calculating the difference in reaction time between feature 89
naming with irrelevant semantic content and feature naming with an incongruent semantic 90
distractor. 91
1.1.1 Stroop tasks across modalities.
92
The visual and auditory versions of the Stroop task are generally assumed to tap the same 93
underlying domain-general inhibitory ability; however, the relationship between the two 94
measures and the extent to which this assumption is true remains unclear. On the one hand, 95
there is evidence to suggest that carefully-matched Stroop tasks presented across different 96
modalities do probe shared inhibitory processes, producing similar patterns of neural 97
activation and correlated behavioural responses (Roberts & Hall, 2008). On the other hand, it 98
has been shown that, even within the same modality, measures of inhibition that are not so 99
closely matched do not correlate within individuals, suggesting either that there is no single 100
inhibitory function supporting performance across different tasks and/or that task-specific 101
demands determine individual differences more strongly than general inhibitory abilities 102
(Shilling, Chetwynd & Rabbitt, 2002). This suggests that any two inhibition tasks, either 103
within or across modalities, are unlikely to be comparable unless they have been deliberately 104
matched, and in particular that an auditory Stroop task cannot automatically be assumed to be 105
an alternative way of measuring the same ability tapped by a given visual Stroop task. In the 106
current study we will address the question of the relationship between visual and auditory 107
versions of the Stroop task by comparing scores from the same participants on an auditory 108
and a visual Stroop task, both deliberately chosen to meet certain criteria. 109
1.1.2 Age-related declines in Stroop performance.
110
When calculated in the traditional way, SI (Stroop interference) on both visual and auditory 111
tasks is generally observed to increase with age, implying a worse performance on the 112
incongruent Stroop task compared to the neutral condition and – hence – poorer inhibition. 113
However, it has long been recognised that no task is ever a “pure” measure of a given 114
cognitive function, but instead includes other, additional processes – something referred to as 115
the “impurity principle” (Surprenant & Neath, 2009). In the case of the Stroop task, it has 116
been suggested that these age-related increases in SI could be due, at least in part, to just such 117
additional processes; that is, that there are potential confounds with non-inhibitory factors 118
created by the methods typically used to calculate SI (Ben-David & Schneider, 2009) – and 119
that methods should be used which account for these factors. 120
One of these confounds is generalised age-related slowing. In the traditional SI measure, 121
inhibition is represented by the absolute difference in time taken to name the background 122
colour between conditions with and without a distracting colour word. A change in the speed 123
of processing would slow performance on all tasks by the same factor (Verhaeghen & 124
Cerella, 2002; Cerella & Hale, 1994), leading to a proportional increase of RTs in 125
incongruent and neutral conditions; this would result in a larger absolute difference between 126
RTs in the two condition, and thus a larger SI (Shilling et al, 2002; Ben-David and Schneider, 127
2009). Crucially, in such a case the increased SI does not necessarily represent any decline in 128
inhibitory ability, but a change in processing speed. One way to address this issue is to use a 129
method for calculating Stroop scores which accounts for, or factors out, changes in overall 130
processing speed. For example, it is possible to use normalised scores, in which the RT in the 131
incongruent condition is divided by the RT in the neutral condition, thus removing any 132
5 changes in SI caused by proportional RT increases in both conditions. This is further
133
discussed in Sections 4.2 below. 134
While a generalised slowing of processing speed is expected to affect Stroop tasks across 135
different modalities in similar ways, the confounding effects of sensory change will be 136
specific to the perceptual domain of any given Stroop task. For visually presented Stroop 137
tasks, such confounding effects may be particularly critical when they adversely affect the RT 138
of the incongruent condition. If we accept the proposal of Melara & Algom (2003) that the 139
Stroop interference effect arises due to a failure to inhibit the more rapidly accessed printed 140
word until access to the incongruent colour name is achieved, then changes in colour vision 141
may make access to the colour word slower and/or more difficult, thereby increasing reaction 142
times during colour naming (Ben-David & Schneider, 2010). Such changes could be brought 143
about by age-related yellowing of the lens and a loss of photo receptors (Anstey et al, 2002; 144
Werner & Steele, 1988). These age-related changes in colour vision do not affect word 145
reading (Salthouse & Meinz, 1995), the speed of which remains largely unchanged with age 146
provided the words are sufficiently legible (Akutsu et al, 1991). As a result, the difference 147
between the time taken to read incongruent words and to name ink colours will be much 148
greater for individuals with an age-related decline in colour vision than for those with better 149
colour vision (i.e. younger adults). Melara & Algom (2003) characterised this discrepancy 150
between colour naming speed and reading speed as the “Dimensional Imbalance”, or DI. 151
Having a larger DI – that is, a greater discrepancy in processing time between reading and 152
colour naming – puts individuals at an increased risk of a failure of inhibition (as expressed in 153
larger SIs), since participants have to suppress the irrelevant word for longer. In this case, 154
then, increased SI scores may reflect a combination of reduced inhibitory control and an 155
increased likelihood of inhibitory failure caused by differences in processing speed for words 156
as opposed to colours (i.e. a large DI). One way to address this issue is to use a method for 157
calculating Stroop scores which accounts for, or factors out, differences in DI. For example, it 158
is possible to regress RTs in the incongruent condition on DI scores, and then use the 159
residuals as a measure of Stroop interference. This is discussed further in Section 4.2 below. 160
In the current study we will examine the effect of general age-related slowing and age-related 161
sensory changes by comparing alternative scoring methods that capture age-related changes 162
in inhibitory ability to different extents. 163
1.1.3 RT distributions in Stroop tasks.
164
In addition to questions of how to appropriately capture the differential age trajectories of the 165
processes contributing to the overall effect, there is a further issue with the way in which 166
Stroop scores are traditionally calculated, namely that they usually use an average score over 167
all trials. If it is true (e.g. Ridderinkhof et al, 2004) that the strength of inhibition depends on 168
the overall processing time, with the slowest responses allowing more time for inhibition to 169
build up, then differences in inhibitory ability are likely to be most evident during those trials 170
with the longest reaction times. That is, trials with longer reaction times will be more 171
informative when assessing inhibitory differences than trials with shorter reaction times, 172
since the gap between those with good inhibition and those with poor inhibition will be at its 173
most pronounced. In averaging over all trials, the traditional SI measure may blur crucial 174
information by mixing outcomes from some informative (slow) trials with outcomes from 175
many uninformative (fast) trials. In the second part of the paper we will examine this 176
hypothesis by investigating the differing extent of Stroop interference for slow and fast trials. 177
1.2 Speech-in noise perception and inhibition
178
6 Research into SiN perception difficulties in older adults has revealed that only some of these 179
difficulties can be accounted for by hearing loss, and that other abilities must play a role 180
(Schneider & Pichora-Fuller, 2000; Wingfield & Tun, 2007). One of those abilities is 181
cognition, which must be examined alongside hearing loss in order to better explain age-182
related difficulties (Akeroyd, 2008). Cognition is not a unitary construct, and has many 183
different components. The exact number and nature of the cognitive components varies 184
across different cognitive models; however, inhibition is generally identified as a core ability 185
(e.g. Diamond, 2013; Baddeley, 2011; Conway & Eagle, 1994; Friedman & Miyake, 2004). 186
Two potential ways in which inhibition may affect SiN perception have been suggested. First, 187
poor inhibition may increase susceptibility to background noise during SiN listening (Janse, 188
2012). This implies not only that those with poor inhibition will perform worse on SiN tasks 189
than those with good inhibition, but also that their difficulties may increase 190
disproportionately as the signal-to-noise ratio (SNR) becomes more adverse. Second, it is 191
suggested that poor inhibition may make it harder for listeners to successfully select the target 192
during lexical access. 193
1.2.1 Lexical access and inhibition.
194
One way to conceptualise lexical access is in terms of the Neighborhood Activation Model 195
(NAM) (Luce & Pisoni, 1998). The NAM proposes that items in the mental lexicon are 196
organised into similarity neighborhoods, defined as all words that can be created from a 197
target item by adding, deleting or substituting a single phoneme. Any given target word will 198
activate both the target and, to varying degrees, its surrounding neighborhood, which may be 199
large (dense) or small (sparse); furthermore, words which are more commonly encountered 200
(have a high frequency of occurrence) will be activated more strongly than those less 201
commonly encountered. Words are therefore classified as “lexically easy” if they have a high 202
word frequency and relatively sparse neighborhoods, and as “lexically hard” if they have a 203
low word frequency and relatively dense neighborhoods. It is assumed that inhibition plays a 204
larger role in the perception of lexically hard words than easy words. It is therefore expected 205
not only that listeners will be less likely to correctly identify lexically hard words than 206
lexically easy words, but also that individual differences in inhibition will relate more closely 207
to the perception of lexically hard words than lexically easy words. The first prediction has 208
been borne out experimentally in studies with normal-hearing adults (Sommers & Danielson, 209
1999; Taler et al, 2010; Helfer & Jesse, 2015), children (Eisenberg et al, 2002), cochlear 210
implant users (Kaiser et al, 2003; Bierer et al, 2015) and native and non-native speakers 211
(Bradlow & Pisoni, 1999); the second prediction has also received some experimental 212
support (Sommers & Danielson, 1999; Taler et al, 2010) and will be further tested in the 213
current study. 214
Lexical access can also be affected by the semantic context provided by the words preceding 215
the target: a certain semantic context can markedly increase the likelihood that a given word 216
will occur. It is commonly found that recognition is better for words in semantically 217
meaningful sentences than words in isolation (Miller et al, 1951; Nittrouer & Boothroyd, 218
1990), and for items in sentences with higher as opposed to lower semantic predictability 219
(Bilger et al, 1984). These findings can also be explained in terms of the NAM: as semantic 220
information builds over the course of a sentence, it increases activation levels for contextually 221
consistent words (Sommers & Danielson, 1999). 222
The phenomenon of retrieval-induced forgetting has also been suggested by some researchers 223
(e.g. Anderson, Bjork & Bjork, 2000; Aslan & Bäuml, 2011) as evidence for the role of 224
active inhibition in lexical access (however, see e.g. MacLeod et al (2003) and Williams & 225
Zacks (2001) for alternative interpretations). Retrieval-induced forgetting refers to a situation 226
7 in which recall for verbal material suffers when related material (e.g. a member of the same 227
category) has earlier been cued and correctly recalled. This suggests that inhibitory processes 228
suppress relevant but uncued material during the initial recall phase, leading to poorer recall 229
for that same material later. 230
1.2.2 Age-related changes in inhibition and lexical access
231
The fact that effects of lexical difficulty and semantic context on word recognition vary 232
through the lifespan has been taken as indicating age-related changes in inhibition. For 233
example, the finding that identification of isolated lexically hard words declined with age, 234
while performance for isolated lexically easy words was comparable for younger and older 235
listeners, was interpreted by Sommers (1996) as reflecting an age-related decline in inhibitory 236
control: since competing words from the target’s neighborhood have to be suppressed or 237
inhibited for successful word identification, poorer inhibition would reduce the ability to 238
perform the required suppression of competing words and hence result in lower performance 239
for lexically hard words. Results from the audiovisual (AV) domain have been interpreted in 240
a similar vein: the finding that older adults were disproportionately poorer at identifying 241
words with dense audiovisual neighbourhoods was taken as indicating an age-related decline 242
in inhibition (Dey & Sommers, 2015); this hypothesis was supported by the fact that Stroop 243
scores predicted AV word recognition in older, but not younger, adults. Finally, Sommers & 244
Danielson (1999) attribute Pichora-Fuller et al.’s (1995) finding that older listeners benefitted 245
more from the addition of semantic context than younger listeners to higher activation of 246
contextually consistent words amongst older listeners due to increased linguistic experience. 247
However, it is important to note that several studies have failed to show a relationship 248
between inhibitory abilities and SiN perception (Tamati, Gilbert & Pisoni, 2013; Helfer & 249
Freyman, 2014). It is unclear why these discrepancies arose, but one possibility is that these 250
differences were due, at least in part, to the methodological issues described above. Although 251
all of these studies used Stroop tasks to assess inhibition, they differed in the modality of the 252
task used (auditory versus visual), and in the way in which Stroop interference was 253
calculated. In particular, some used traditional SI scores, which as discussed above may be 254
subject to confounds with generalized slowing and/or sensory decline, while others used 255
adjusted scoring systems that may have accounted for slowing, poor colour vision or both. In 256
order to better understand the relationship between inhibition, SI scores and SiN perception, 257
and to investigate how the predictive relationship between SI scores and SiN perception 258
changes depending on whether or not possible confounds in the SI measures have been taken 259
into account, we assessed the predictive value for SiN perception of SI measures derived 260
from an auditory and a visual Stroop task using scoring methods that did or did not account 261
for possible age-relate confounds. If the power of Stroop scores to predict SiN perception is 262
based on their ability to measure inhibition, then a purer inhibitory measure free from age-263
related confounds should improve prediction. However, Stroop scores may primarily measure 264
more general age-related changes, such as generalised slowing and sensory declines. Since 265
generalised slowing will affect performance across a range of tasks, and sensory declines are 266
likely to be shared across the visual and auditory domains (Linderberger & Baltes, 1994), the 267
predictive relationship between Stroop scores and SiN perception may be based more 268
strongly on these age-related changes than on inhibition. If this is the case, then the 269
traditional, unadjusted SI measures should prove more useful in predicting SiN performance. 270
2 Hypotheses
271
2.1 Different scoring systems
272
8 H1: Scoring methods can be devised that do or do not take age-related changes in processing 273
speed and sensory decline (i.e. poorer colour vision) into account. If non-inhibitory age-274
related changes are independent contributors to Stroop scores alongside inhibitory ability 275
(Melara & Algom, 2003), we would expect a low correlation between traditional scores, 276
which do not account for these age-related changes, and the new scores, which do. 277
H2: Stroop scores can be calculated across all trials, or only across trials which are responded 278
to particularly slowly or quickly. We expect the size of the Stroop effect to be larger on 279
average for the slower trials than the faster trials, since a proportional slowing of both longer 280
and shorter RTs leads to a larger differences between the two overall. If it is true that 281
differences in inhibitory ability are more in evidence when participants take longer to respond 282
(Ridderinkhof et al., 2004), then we also expect to see greater variation in individual Stroop 283
effects when examining slower trials as opposed to faster trials. 284
2.2 Visual versus auditory tasks
285
H3: The results from the visual and auditory Stroop tasks will be broadly comparable, 286
assuming that a) inhibition is a modality-independent general cognitive ability, b) inhibition 287
influences individual performance to a greater extent than do task-specific demands and c) 288
the two types of task are tapping into the same ability. If this is not the case, this raises 289
questions about the extent to which the two tasks measure the same aspect of cognition. 290
2.3 Relationship to SiN tasks
291
H4: Based on previous studies (Sommers & Danielson, 1999; Janse, 2012) we predict larger 292
Stroop interference (SI) scores to be predictive of worse performance on SiN tasks – that is, a 293
negative relationship between SI scores and SiN scores. If SI scores provide a genuine 294
measure of inhibitory ability, then this relationship should be particularly strong when the 295
SiN stimuli demand high levels of inhibition: at lower (less favourable) SNRs, when 296
sentential context is lacking (i.e. when targets are isolated words), when target words have a 297
low word frequency and/or high neighborhood density, or when semantic context does not 298
aid inference (i.e. when targets appear in low-predictability sentences). It is possible that 299
these effects may be particularly pronounced for those with poorer hearing sensitivity (Helfer 300
& Jesse, 2015). 301
H5: If the relationship between SI scores and SiN perception is partially driven by shared 302
sensory decline, we might expect the predictive power of Stroop interference for speech 303
perception to decrease once sensory decline is taken into account. If, on the other hand, it is 304
the inhibition component of the Stroop task that drives the relationship with speech 305
perception, then a purer measure less affected by sensory change might improve the 306
association between the two measures. 307
H6: Based on previous studies suggesting that differences in inhibitory ability are more in 308
evidence when participants take longer to respond (Ridderinkhof et al., 2004), we expect 309
Stroop scores derived from slower trials be better predictors of SiN perception than scores 310
derived from faster trials or averages across all trials. 311
3 Material and methods
312
3.1 Participants
313
Participants were 50 adults aged over 60 (mean: 69.5 years, SD: 6.4, range = 61-86) with 314
mild hearing loss. A sample size of N = 50 allowed for the detection of a medium-sized effect 315
(r = 0.35) at alpha (two-tailed) = 0.05 with a probability of 80%. This was deemed sufficient 316
9 given that the most closely related previous studies (Janse et al., 2012; Sommers &
317
Danielson, 1999) typically show medium-to-large effect size correlations. Exclusion criteria 318
were hearing aid use and non-native English language status. This study was carried out in 319
accordance with the recommendations of the University of Nottingham's Code of Research 320
Conduct and Research Ethics, with written informed consent from all subjects. All subjects 321
gave written informed consent in accordance with the Declaration of Helsinki. The protocol 322
was approved by the University of Nottingham’s School of Psychology Ethics Committee 323
(ref. 464). 324
Visual accuracy was assessed using a Landolt C Chart, and colour vision was tested using the 325
card version of the City University Colour Vision Test. All participants were able to 326
successfully read a full line of optotypes on the Landolt C Chart at a logMAR value of at 327
least 0.3, with the majority (34) able to read a full line at between -0.1 and 0.1 logMAR. Four 328
participants failed the Colour Vision Test, and the same group also verbally reported colour 329
blindness; these participants were excluded from the visual Stroop task. No other participant 330
reported any difficulty in reading the test materials for the visual Stroop task. Two 331
participants were excluded from the auditory Stroop task due to technical failure. 332
Additionally, all participants were screened for mild cognitive impairment (MCI) using the 333
Montreal Cognitive Assessment (MoCA) (mean: 27.86; SD: 1.95). 334
The reported results are part of a larger study into cognitive contributions to speech 335
perception in older adults. Unreported results do not relate to the topics discussed in this 336
paper. 337
3.2 Auditory measures
338
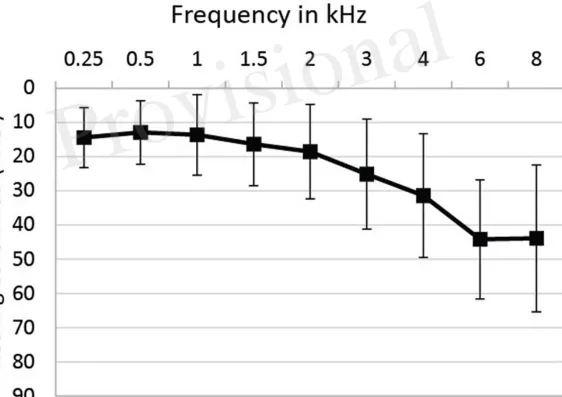
Pure-tone air-conduction thresholds (PTA) were collected for nine frequencies between 0.25-339
8kHz for each ear, following the procedure recommended by the British Society of 340
Audiology (British Society of Audiology, 2011) using an Interacoustics Audiometer AT235 341
(Interacoustics, Middelfart, Denmark) and TDH39P headphones (Telephonics, Farmingdale, 342
NY, USA). Mean thresholds as a function of frequency are presented in Figure 1. As this 343
figure shows, there was considerable variability between participants in terms of hearing 344
acuity, particularly at the higher frequencies. 345
FIGURE 1 HERE 346
Speech reception thresholds (SRT) were obtained using 30 sentences from the Adaptive 347
Sentence List (MacLeod & Summerfield, 1990). Sentences were initially presented at 60dB 348
SPL, with a one-down-one-up procedure and step sizes of 10dB down, then 5dB up for the 349
first reversal; the remainder of the trials used a three-down-one-up procedure with a step size 350
of 2dB. The last two reversals were averaged to determine the 79% accuracy point (Levitt, 351
1971). Based on this, all auditory stimuli used throughout the study, including the auditory 352
Stroop stimuli, were presented at 30dB SL – that is, 30 dB above each participant’s 353
individual threshold. This procedure was used to partially control for differences in 354
intelligibility in quiet due to the considerable range in participants’ hearing sensitivity. 355
3.3 Stroop tasks
356
In the visual Stroop task, modelled after Janse (2012), participants were presented with grids 357
formed of 48 boxes in an 8 x 6 arrangement. There were three types of grid: i) a reading grid, 358
consisting of white boxes containing black colour words; ii) a control grid, consisting of 359
coloured boxes containing the string “XXXX” in black; iii) an interference grid, consisting of 360
coloured boxes containing mismatched colour words in black. The colours used were red, 361
10 blue, green and brown. Using relatively large boxes of colour instead of font colour
362
maximised the opportunity for older participants to clearly see the colours. The distractor 363
words were printed in black and displayed in each box using 20 pt Calibri font. In order to 364
ensure best possible visibility the light in the test room was always at least 880 lux and was 365
set in such a way that each participant could optimally see colours and text without 366
experiencing glare. For i), the task was to read the words aloud as quickly and accurately as 367
possible. For ii) and iii), the task was to name the background colour of the boxes as quickly 368
and accurately as possible. There was a short practice session for each of the 3 tasks. 369
Participants saw two versions of each grid. The total time taken to complete each grid was 370
timed by the experimenter using a stopwatch, and overall scores for each grid type were 371
calculated by averaging the two times obtained. 372
In the auditory Stroop task, modelled after Sommers & Danielson (1999), participants heard 373
two male and two female speakers, and were required to respond as quickly and accurately as 374
possible to the gender of the speaker. Any given trial consisted of one of three words: 375
“mother”, “father” or “person”. These words could therefore be congruent with gender (e.g. 376
female + “mother”), incongruent with gender (e.g. male + “mother”) or neutral (“person”). 377
RTs for gender decisions were obtained via button presses. Participants always used their 378
self-reported dominant hand to respond, and returned their hand to the rest position in front of 379
the button box after the end of each trial. For each trial, the RT was measured from the onset 380
of the sound file; however, the recordings had been trimmed so that, for the words “father” 381
and “person”, voicing started at a similar point in all files (around 13ms after onset for 382
“father”, and around 7ms after onset for “person”). For “mother”, voicing was considered to 383
start early enough that the point of vowel onset was not meaningfully different between any 384
of the four recordings. The location (left/right) of the buttons corresponding to “female” and 385
“male” were swapped for half of the participants. Participants received a short practice 386
session containing all three conditions before the start of the task. 387
3.4 Speech-in-noise tasks
388
The SiN tasks varied in both semantic context and lexical difficulty. Semantic context was 389
varied as part of the sentence task, where target words were the final words of low- (LP) and 390
high-predictability (HP) sentences. Stimuli were 112 sentence pairs from a recently 391
developed sentence pairs test (Heinrich et al., 2014). This test, based on the SPIN-R test 392
(Bilger et al., 1984), comprises sentence pairs with identical sentence-final monosyllabic 393
words, which are more or less predictable from the preceding context (e.g. “We’ll never get 394
there at this rate” versus “He’s always had it at this rate”). High and low predictability 395
(HP/LP) sentence pairs were matched for duration, stress pattern, and semantic complexity. 396
Sentences were recorded using a male Standard British English speaker. Only the HP or LP 397
version of a sentence was heard by a single participant. 398
Lexical difficulty was assessed in the word task, where target stimuli were 200 isolated words 399
whose lexical difficulty was varied in terms of word frequency (WF) and neighborhood 400
density (ND). The set of words comprised the 112 final words from the sentence task and an 401
additional 88 monosyllables. WF was measured using the BNC corpus 402
(http://www.natcorp.ox.ac.uk/), filtered for nouns (exact form). This corpus was chosen 403
because it both uses British English and also allows particular parts of speech to be isolated: 404
in this case, the measure of interest was the frequency of the target words as nouns, since the 405
sentence contexts led listeners to anticipate a noun target, and as the exact form heard in the 406
sentence, not with potential pluralisations or any other alterations. This limitation was 407
mirrored in the scoring of the SiN task, where only the exact form of a stimulus was scored as 408
correct. ND was determined using N-Watch (Davis, 2005). This tool uses the Celex database 409
11 to create neighborhood measures using a letter-substitution algorithm, but cross-checks the 410
measures with word frequency to ensure that extremely rare words are not included. This 411
stops over-estimation of ND with respect to most people’s vocabulary. It also uses British 412
English. Based on these measures, the 200 words were divided into 4 groups, with WF and 413
ND ranges as follows: 414
TABLE 1 HERE 415
All 200 words were re-recorded using a different male Standard British English speaker. 416
All SiN stimuli were presented in speech-modulated noise (SMN). The SMN was created by 417
using an inverse FFT to generate a noise signal with the same long-term average spectrum as 418
the target speech. This noise signal was then modulated in level by dot multiplying it with the 419
absolute value of the smoothed Hilbert transform of the target speech (smoothing was 420
accomplished by convolving the speech envelope with a 46 ms vector of ones). Finally the 421
SMN was scaled to match the RMS level of the target speech. This made the speech signal 422
unintelligible while keeping the long-term average spectrum, level, and temporal envelope of 423
the original signal intact. SiN stimuli were presented in two SNRs to create a more or less 424
adverse listening condition (words at +1dB and -2dB; sentences at -4dB and -7dB). SNR 425
levels were chosen to vary the overall difficulty of the task between 20% and 80% accuracy. 426
Each of the 112 sentence-final words was only heard once by each participant, either in the 427
context of an HP or an LP sentence, and half the sentences of each type were heard with high 428
or low SNR. Each of the 200 words was heard only once, with either high or low SNR, and 429
there were equal numbers of words in each combination of word frequency and neighborhood 430
density categories. After hearing each sentence or word participants repeated as much as they 431
could. Testing was self-paced, and responses were recorded for offline scoring. 432
3.5 Procedure
433
Testing was carried out in a double-wall sound-attenuating booth (Industrial Acoustics 434
Company (IAC), Winchester, UK) using Sennheiser HD280 headphones. All testing was in 435
the left ear only. The SiN and Stroop tasks formed part of a larger battery of tests, which were 436
administered over the course of two sessions around a week apart. The two SiN tasks (words 437
and sentences) were always tested in different sessions; the two Stroop tasks (auditory and 438
visual) were tested in different sessions wherever possible, which was the majority of cases. 439
The order of SiN tasks was counterbalanced across participants. There was no systematic 440
pairing of SiN and Stroop tasks within sessions. 441
3.6 Modelling
442
In all cases, the outcome measure was speech intelligibility as measured in RAUs 443
(Studebaker, 1985). A number of stimulus-based variables were coded as categorical 444
predictors: semantic predictability (LP/HP) of sentence-final words; word frequency 445
(high/low) and neighborhood density (high/low) of isolated words; speech type 446
(sentences/words) of words and sentences; SNR (high/low). In addition, the following 447
listener variables were coded as continuous predictors: Stroop score (on either the auditory or 448
visual Stroop tasks, using a specified scoring system), and PTA. The PTA variable was 449
calculated by averaging the obtained thresholds at all tested frequencies for each participant, 450
and then centering these values. 451
The relationship between predictor and outcome variables was assessed in a series of linear 452
mixed models (LMMs) using ML estimation, with predictor variables as fixed effects and 453
Type 3 SS. All models included participants as random effects. 454
12 A backwards stepwise procedure was used to determine the final set of predictors for each 455
model.1 This procedure was implemented through manual checking and effect removal. All 456
analyses were performed in IBM SPSS Statistics 21. 457
4 Results
458
4.1 Mean results for speech-in-noise (SiN) perception
459
Mean intelligibility values for all SiN conditions are given in Table 2. 460
TABLE 2 HERE 461
Repeated-measures ANOVAs were conducted to investigate group differences in word and 462
sentence intelligibility due to stimulus-based predictor variables. For intelligibility of 463
sentence-final words, a semantic predictability (LP/HP) x SNR (low/high) within-subjects 464
ANOVA showed significant main effects of both predictability (F(1, 49) = 571.72; MSE = 465
91.67, p < 0.001, η2 = 0.921; HP > LP) and SNR (F(1, 49) = 168.54; MSE = 76.81, p < 466
0.001, η2 = 0.775; easy > hard), but no predictability x SNR interaction. For intelligibility of 467
isolated words, a word frequency (low/high) x neighborhood density (low/high) x SNR 468
(low/high) within-subject ANOVA showed significant main effects of word frequency (WF) 469
(F(1, 49) = 111.67; MSE = 37.37, p < 0.001, η2 = 0.695; high > low), neighborhood density 470
(ND) (F(1, 49) = 33.89; MSE = 70.11, p < 0.001, η2 = 0.409; low > high) and SNR (F(1, 49) 471
= 120.69; MSE = 66.54, p < 0.001, η2 = 0.711; easy > hard); additionally, a significant WF x 472
ND interaction (F(1, 49) = 180.40; MSE = 54.53, p < 0.001, η2 = 0.786) indicated that words 473
with both a high word frequency and a low neighborhood density were more intelligible than 474
words in the other three conditions (Bonferroni-corrected at p = 0.05). 475
4.2 Visual Stroop
476
4.2.1 Calculating Stroop scores
477
The Stroop Interference measure (SI) traditionally used in the literature (MacLeod, 1991) is 478
calculated as follows: 479
[1] vSIraw = Ci – Cn 480
The mean for Cn was 31.66s (SD = 5.41s); the mean for Ci was 47.13s (SD = 8.14s); and in 481
all cases the difference between them was positive (i.e. Ci > Cn). The mean difference 482
1 First, the most complex model was run (i.e. full factorial: all main effects and all possible interactions). Then,
non-significant effects were removed one level at a time. For example, if the highest-level interaction was a 4-way interaction and was not significant, it was removed. The model was subsequently re-run. All non-significant 3-way interactions were then removed, and the model was re-run. All non-non-significant 2-way interactions were then removed, and so on. If a previously significant higher-order interaction lost significance at any stage, this interaction was removed immediately before any further modifications are made. As a general rule, the principle of marginality was observed. As a consequence, if a higher-level interaction was kept in the model, the nested lower-level interactions were also retained. For example, if A*B*C was kept in the model, then the model also included A*B, A*C and B*C. These relevant nested interactions are called "marginal effects". As this approach has repercussions with regard to model parsimoniousness, a balance between the competing demands of marginality and parsimony was needed. This was achieved by keeping these guidelines in mind: (1) Even if the highest-level interaction was significant, it was not included in the model if it contained 5 or more factors. This allowed the models to be reasonably trimmed in the first instance. (2) A lower-level significant 5- or 4-way interaction was only kept in the model if it contained the Stroop variable. (3) All significant and/or marginal 3-way and 2-way interactions were included, regardless of whether they contained the Stroop variable. (4) All main effects were kept in the model at all times.
13 between RTs in the two conditions for the current dataset was 15.5s (SD = 4.49s) overall, 483
which represents a mean of 0.32s (SD = 0.09s) per item (word). 484
One problem with using the traditional SI measure as an estimate of inhibition in older adults 485
is that there can be age-related changes in general processing speed (Ben-David & Schneider, 486
2009). This would be expected to slow performance on incongruent (Ci) and neutral (Cn) 487
trials by the same factor, leading to different absolute increases – which in turn lead to larger 488
SI values when the difference between the two conditions is calculated. A possible way to 489
account for this age-related change and minimise its effect on interference estimates is to use 490
a normalised measure of Stroop interference. This can be calculated as follows: 491
[2] vSInorm = Ci/Cn 492
In the case of the current dataset this gives a mean score of 1.49 (SD = 0.14). 493
Another problem with the visual SI measure is that the different age-related trajectories for 494
colour vision (declining) and reading speed (stable) mean that colour naming RTs in the 495
neutral condition (Cn) may slow with age relative to reading speed (Rn) (Salthouse & Meinz, 496
1995). The Stroop effect originates from the difference in time course between colour naming 497
in the presence versus absence of a readable distracting colour word. If colour naming slows 498
while word reading remains unchanged with age, then there will be a greater difference in 499
processing speed between the colour naming and reading dimensions, and this puts 500
participants at greater risk of inhibition failure in the incongruent (distractor) condition: that 501
is, if a participant’s colour naming speed is relatively slow compared to their reading speed, 502
they have to suppress the irrelevant word for longer, and this increases their chances of 503
experiencing an inhibition failure. 504
Melara & Algom (2003) refer to the discrepancy between access to words and colour names 505
as the Dimensional Imbalance (DI) i.e. 506
[3] DI = Cn – Rn 507
Thus a large DI score indicates a slow colour naming speed relative to reading speed. Melara 508
& Algom found DI to be strongly positively correlated with Stroop interference (SI) as 509
measured by [1]: larger DI scores (relatively slow colour naming speeds) were associated 510
with larger Stroop effects. 511
If an increased dimensional imbalance indeed contributes to larger SI (inhibitory failure) in 512
older adults, then it needs to be taken into account when calculating inhibition ability. There 513
are two possible ways to do this. The first is to calculate a standardised Ci using the DI score, 514
as follows: 515
[4] vSIstandard = Ci/DI 516
This factors out the part of Ci which is determined by DI. As a result, differences in colour 517
naming speed relative to reading speed are controlled for, leaving only the portion which 518
represents “true” inhibitory ability. 519
An alternative approach is to use residuals. For a linear regression modelled as Cii = α + βDIi 520
+ εi, the residuals can be calculated as: 521
[5] vSIres = yCi – ŷCi 522
This method regresses Ci on DI, and then takes the unstandardised residual (i.e. the 523
difference between the observed Ci value (yCi) and the predicted Ci value (ŷCi)) for each 524
participant. These residuals represent the difference between a participant’s observed Ci score 525
14 relative to what their DI score would predict: a residual near to 0 indicates that the observed 526
Ci score is very similar to what the DI score would predict, suggesting that DI explains 527
almost all of the increase in Ci relative to Cn. A positive residual suggests that the observed 528
Ci score is higher than what could be predicted by DI, indicating “true” inhibitory failure; 529
while a negative residual suggests that the observed Ci is lower than what would be predicted 530
based on DI, and represents “true” inhibitory success. This method thus provides a measure 531
of inhibitory control free from the effects of visual sensory decline. It also accounts for 532
general cognitive slowing since, like [2], it is a relational measure. One issue with this 533
method is that the residual scores depend on the performance of the sample – that is, the 534
predictive relationship between DI and Ci is derived only from the study participants, who 535
may not be representative of the wider population. It would be preferable to independently 536
derive a “gold-standard” relationship between DI and Ci; however, this has not yet been 537
done, and so for the current study we must rely on the data from our sample alone. 538
4.2.2 The relationship between visual Stroop scores and speech-in-noise (SiN)
539
perception
540
This section examines the predictive value of visual Stroop interference for SiN perception in 541
high and low predictability sentences and for single words varying in word frequency and 542
neighborhood density. Predictive power for SiN perception was investigated for two 543
measures of visual Stroop interference: vSIraw, the traditional measure for Stroop interference 544
unadjusted for sensory decline, and vSIres, the new measure of Stroop interference that takes 545
general age-related slowing as well as sensory decline into account. The predictive 546
relationship between each of the visual Stroop scores and performance on the sentence task, 547
the word task and the sentence and word tasks combined, are presented in Tables 3, 4 and 5 548
respectively. The analyses combining the scores from the sentence and word tasks (Table 5) 549
was included in order to directly compare the predictive effect of Stroop scores across the 550
two outcome measures. In a second step, PTA was added to each set of analyses in order to 551
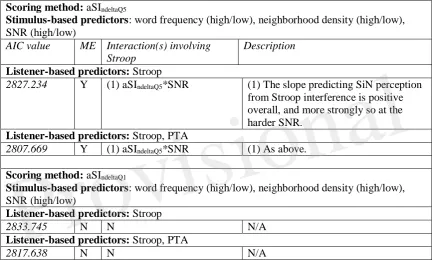
examine how it modified the predictive effect of the Stroop scores. 552
Tables 3-5 indicate, for each combination of model type and dataset, a) whether a predictive 553
effect of the Stroop measure on SiN performance was present, and what the nature of the 554
effect was; and b) what, if any, significant interactions between the Stroop measure and 555
stimulus-based variables or PTA were present. The effects are described as rate of change 556
where a positive slope indicates an average increase in SiN performance with every 557
additional increase in Stroop interference, while a negative slope indicates an average 558
decrease in SiN performance with every additional increase in Stroop interference. Based on 559
our hypotheses, we expect negative slopes. While PTA was always entered as a continuous 560
predictor, we use a categorical median split when reporting and discussing its effects, because 561
it allows for clearer descriptions, particularly of complex interactions. The tables do not list 562
significant interactions if they do not involve the Stroop measure. The AIC value is included 563
for each model as an indication of goodness-of-fit, with lower AIC values corresponding to a 564
better fit. 565
TABLE 3 HERE 566
TABLE 4 HERE 567
TABLE 5 HERE 568
The models reveal a complex pattern of results with the direction of the relationship between 569
the vSI measures and SiN performance, as well as the strength of the relationship, depending 570
on the scoring method and characteristics of the stimulus and the listener. However, in all 571
15 cases, the inclusion of PTA in the model enhanced model fit (i.e. produced a lower AIC 572
value). 573
We will now examine, for each dataset in turn, how the nature of the relationship between 574
Stroop scores and SiN performance was modulated by stimulus-based variables and PTA for 575
each Stroop scoring method. 576
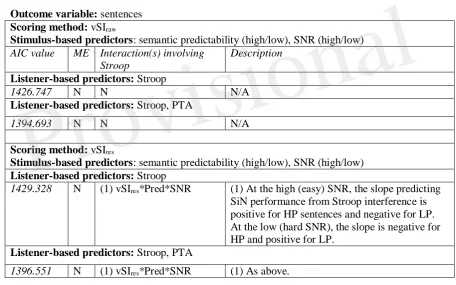
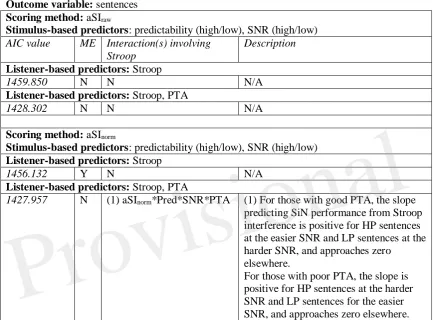
4.2.2.1 Sentence perception
577
Traditional (vSIraw) measure.Therewas no predictive effect of the Stroop measure
578
overall, and stimulus-based predictors did not modulate the predictive effect of Stroop 579
interference. There was also no modulating effect of PTA. 580
Adjusted (vSIres) measure.While there was no predictive main effect of Stroop
581
interference, an interaction of vSIres x Pred x SNR indicates that the predicted negative 582
relationship between Stroop scores and sentence perception was seen for the high 583
predictability (HP) sentences in the harder SNR, and for the low predictability (LP) sentences 584
in the easier SNR, but not for the HP sentences in the easier SNR or the LP sentences in the 585
harder SNR. There was no modulating effect of PTA. 586
4.2.2.2 Word perception
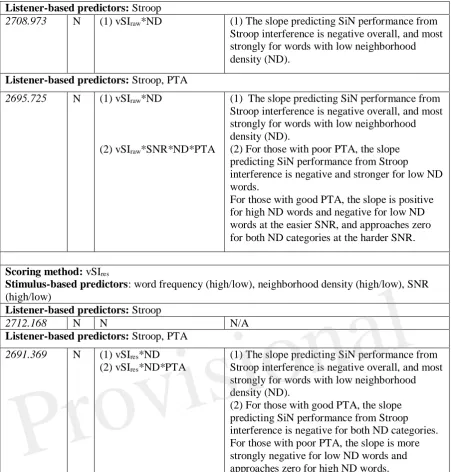
587
Traditional (vSIraw) measure.Whilethere wasno predictive main effect of Stroop
588
interference, an interaction with neighborhood density (ND) indicates that the observed 589
relationship between vSIraw and word perception was more negative for words with less dense 590
neighborhoods. Once PTA was added to the model, an interaction of vSIraw x ND emerged. 591
This indicates that the predictive effect of Stroop scores was strongest for low ND words. 592
This interaction was modulated by SNR and PTA, indicating that the relationship between 593
Stroop scores and SiN perception changed in different ways across ND and SNR conditions 594
for listeners with better and worse hearing. Specifically, the relationship was negative for 595
those with PTA, but was more mixed for those with good PTA, being positive for high ND 596
words in the easier SNR and approaching zero for both ND conditions in the harder SNR 597
Adjusted (vSIres) measure. There was no main effect of Stroop interference and no
598
modulating effects of stimulus-based variables. The interaction of vSIres x ND indicates that 599
the predictive effect of Stroop scores was strongest for low ND words. This interaction was 600
further modulated by PTA, indicating that the relationship between Stroop scores and SiN 601
perception changed in different ways for the two ND conditions when examining listeners 602
with better and worse hearing. Specifically, for those with worse hearing the Stroop/SiN 603
relationship was more negative for low ND words but less negative for high ND words when 604
compared to those with better hearing 605
4.2.3.3 Speech (combined dataset)
606
Traditional (vSIraw) measure. There was no predictive main effect of Stroop measure.
607
An interaction with Type indicates that the predictive effect of Stroop scores for SiN 608
perception differed in direction between sentences and words, being negative for the word 609
task and positive for the sentence task. PTA did not modulate the found relationships. 610
Adjusted (vSIres) measure. There was no main effect of Stroop interference and no
611
modulating effects of stimulus-based variables, and no modulating effect of PTA 612
In summary, the predictive effect of visual Stroop scores for SiN perception is similar 613
in some respects regardless of the scoring method. Both scoring systems reveal influences of 614
lexical factors (sentence predictability and word neighborhood density), and neither system 615
16 shows a large effect of PTA. However, there are also important differences between the two 616
scoring systems. In particular, the direction of the Stroop/SiN relationship changes depending 617
on the type of target speech when using the traditional scoring method, whereas it is 618
consistently negative across speech types for the vSIres method. 619
4.3 Auditory Stroop (all trials)
620
4.3.1 Calculating Stroop scores
621
The auditory Stroop task resulted in three measures for each participant: average RT for 622
neutral trials (aRTn), congruent trials (aRTc) and incongruent trials (aRTi). Initial inspection 623
of the data revealed that not all four speakers produced Stroop interference effects for every 624
participant. We therefore analysed for each participant the responses to the female and male 625
speaker who produced, for that participant, the largest overall traditional Stroop interference 626
(RTi – RTn). Speakers M1 and M2 were chosen 13 and 35 times respectively, speakers F1 627
and F2 25 and 23 times respectively. Following Green & Barber (1981), only correct trials 628
(from the aRTi and aRTn conditions were included in any analysis. 629
Congruent trials are usually included in Auditory Stroop tasks, and previous studies (Green & 630
Barber, 1981; Jerger et al, 1988) have found a facilitation effect (i.e. faster responses to 631
congruent than neutral trials), although this is not always the case (Sommers & Danielson, 632
1999). Using a 1-way repeated-measures ANOVA (Greenhouse-Geisser corrected for 633
violations of sphericity) with aRTn, aRTc and aRTi as within-subject levels of condition, we 634
found a main effect of condition (F(2, 79) = 53.40; MSE = 0.005, p < 0.001, η2 = 0.532). 635
Post-hoc testing showed an interference effect but no facilitation effect (aRTi > aRTc, aRTi > 636
aRTn, aRTc = aRTn (Bonferroni-corrected at p = 0.05)). 637
The traditional Stroop Interference measure (SI) for the auditory Stroop is calculated 638
analogously to the visual Stroop: 639
[6] aSIraw = aRTi – aRTn 640
The mean aRTi (per item) is 1.33s (SD = 0.23s), the mean aRTn is 1.20s (SD = 0.21s), and 641
aRTi is higher than RTn for all but 3 listeners. The mean difference between RTs in the two 642
conditions for the current dataset is 0.13s (SD = 0.09s) per item (word). This difference is 643
smaller than for the visual Stroop. 644
As explained above, the issue of generalised slowing makes the traditional Stroop (SI) 645
measure problematic: if aRTi and aRTn increase by the same factor, SI will also increase; this 646
means that a larger SI may reflect slowing rather than paucity of inhibition. Normalised SI 647
was proposed as one means of addressing the issue of generalised slowing, and can be 648
calculated for the auditory Stroop as follows: 649
[7] aSInorm = aRTi/aRTn 650
In the case of the current dataset this gives a mean score of 1.11 (SD = 0.08). 651
4.3.2 The relationship between auditory Stroop scores and speech-in-noise (SiN)
652
perception
653
This section examines the predictive value of auditory Stroop interference for SiN perception 654
in high and low predictability sentences, and for single words varying in word frequency and 655
neighborhood density. As before, performance in these conditions was predicted by one of two 656
auditory Stroop interference measures: aSIraw, the traditional measure for Stroop interference, 657
or aSInorm, a measure of Stroop interference that takes generalised slowing into account. The 658
17 relationship between each Stroop measure and SiN perception, as characterised by a series of 659
LMMs, is summarised in Tables 6 to 8. In all cases, the first part of the table presents the results 660
when Stroop interference and stimulus-based variables are the only predictors of SiN 661
performance. The second part of each table presents the results when PTA is considered in 662
addition to Stroop interference and stimulus-based variables. 663
TABLE 6 HERE 664
TABLE 7 HERE 665
TABLE 8 HERE 666
For both auditory Stroop scoring systems, the overall relationship between Stroop scores and 667
SiN perception is mostly positive. This is truer for the normalised (aSInorm) scores than the 668
traditional (aSIraw) scores, since Stroop scores never reach significance as a main effect when 669
using the aSIraw scoring method, but is significant across all datasets when using the aSInorm 670
measure without PTA. As before, including PTA improved the fit of the model in all cases. 671
We will now examine, for each dataset in turn, how the nature of the relationship between 672
Stroop scores and SiN performance was modulated by stimulus-based variables and PTA for 673
each Stroop scoring method. 674
4.3.2.1 Sentence perception
675
Traditional (aSIraw) measure. There was no main effect of Stroop interference and no
676
modulating effects of stimulus-based variables or PTA. 677
Adjusted (aSInorm) measure. There was a positive predictive main effect of Stroop
678
scores but no modulating effects of stimulus-based variables on their own. When PTA was 679
added as an additional predictor an interaction of aSInorm x Pred x SNR x PTA emerged, 680
which indicates that the predictive strength, but not the direction, of Stroop interference for 681
speech perception in a particular condition depended on a person’s hearing ability. 682
4.3.2.2 Word perception
683
Traditional (aSIraw) measure. Whilethere was no predictive main effect, an
684
interaction of aSI x SNR indicates that the positive predictive effect of Stroop scores on SiN 685
performance was stronger at the harder SNR. There was also no modulating effect of PTA 686
Adjusted (aSInorm) measure. As for aSIraw above.
687
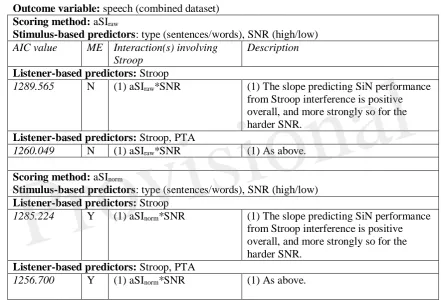
4.3.2.3 Speech (combined dataset)
688
Traditional (aSIraw) measure. Again,there was no predictive main effect of Stroop,
689
but an interaction with SNR indicating a stronger positive predictive effect at the 690
harder SNR. There was no modulating effect of PTA 691
Adjusted (aSInorm) measure.As for aSIraw above.
692
In summary, the predictive relationship between auditory Stroop scores and SiN perception is 693
in some ways similar for auditory Stroop scores calculated using the traditional method 694
(aSIraw) and the normalisation method (aSInorm). For both scoring methods, the Stroop/SiN 695
relationship is positive overall and stronger at the more challenging SNR. However, there are 696
also important differences. In particular, the traditional Stroop scores (aSIraw) have no 697
predictive value for performance on the sentence task, whereas the aSInorm scores do. 698
4.4 Auditory Stroop (slow vs. fast trials)
699
18 As discussed in the introduction, using average measures across all trials of a Stroop task may 700
not be the most efficient way of quantifying inhibition and its failure. We know that 701
inhibition takes time to build up, and that its effects may therefore be strongest for each 702
participant’s slowest RTs for incongruent trials (Ridderinkhof, 2002; Ridderinkhof et al, 703
2004; Roelofs et al, 2011). During these trials the distractor has the greatest chance to 704
interfere, but inhibition also has the greatest potential to be deployed by those who can 705
successfully do so; thus individual differences in inhibitory abilities will be most in evidence, 706
since the disparity between those able to successfully deploy inhibition and those less able to 707
do so will be largest during these trials (Roelofs et al, 2011). To assess this, slow and fast 708
trials must be analysed separately. This type of differential analysis of single trials is usually 709
done using delta plots and delta scores. 710
Delta scores were calculated using neutral (aRTn) and incongruent (aRTi) conditions. For 711
each participant and each condition, the trials were sorted by RT, and then split into equally-712
sized quintiles. The average RT was calculated for each quintile in each condition. Mean RT 713
per quintile is the averaged RT across aRTn and aRTi for a given quintile. Delta RT per 714
quintile is calculated as mean aRTi minus mean aRTn for a given quintile. When averaged 715
over all participants the grand mean RT and grand delta RT can be obtained for each quintile. 716
It is worth noting that, since delta RT per quintile is obtained by calculating aRTi – aRTn for 717
that quintile, it is conceptually no different to using the traditional (aSIraw) measure (see 718
equation [6] above). It is the same calculation, but performed using only a subset of trials. 719
Delta plots show grand mean RTs plotted against grand delta RTs for the five RT quintiles 720
(Q1-Q5). Since the delta RT measure compares conditions with and without distractors, and 721
interference from distractors increases over time, the plots typically show an overall increase 722
in delta RTs as mean RTs increase. Individual differences in the build-up of inhibition are 723
expressed in a delta plot by differences in this relationship between mean and delta RTs 724
(Ridderinkhof et al, 2004). Those who are not successfully inhibiting show a monotonic 725
increase in delta RT as mean RT increases. In contrast, those who are successfully engaging 726
inhibition initially show a monotonic increase in delta RT, but for the slowest trials the 727
relationship between delta RT and mean RT will become less steep, flatten out or even 728
become negative.Delta plots therefore allow us to focus on those trials that both allow and 729
require the most inhibition for successful performance, thereby maximizing the chance of 730
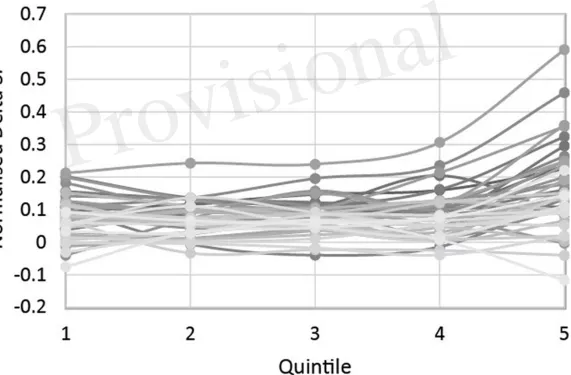
seeing individual differences in inhibitory ability. 731
Because participants varied widely in overall RTs, we divided each delta RT by its relevant 732
mean RT to get a normalised delta score, called hereafter aSIndelta. These scores are plotted in 733
Figure 2. 734
FIGURE 2 HERE 735
A repeated-measures 1-way ANOVA with quintiles as within-subject effects (Greenhouse-736
Geisser corrected for violations of sphericity) showed a main effect of quintile (F(2,84) = 737
18.69, MSE = 0.007; p < 0.001, η2 = 0.284), and subsequent pairwise comparisons 738
(Bonferroni corrected at p = 0.05) revealed that Q5 had significantly higher normalised delta 739
scores compared to all other quintiles, which were not significantly different from each other. 740
However, as Figure 2 shows, Q5 produced not only the largest delta scores (largest Stroop 741
effects) on average, but also the largest variation in scores: the standard deviation of scores in 742
Q5 is 0.12s, compared to a range of 0.05-0.07 for Q1-4. This is in concordance with 743
Ridderinkhof et al. (2004), and also suggests that Q5 is most likely to reveal differential 744
associations between the auditory Stroop measure and SiN perception. If Ridderinkhof and 745
colleagues are correct that there is not enough time for inhibition to become sufficiently 746