Perceptions of an automotive load space in a virtual environment
Glyn Lawsona, Tessa Ropera, Paul Herriottsb, Louise Malcolmb, Davide Salanitria a[email protected]; [email protected];
Human Factors Research Group, Faculty of Engineering, The University of Nottingham, United Kingdom, NG7 2RD
b[email protected]; [email protected] Jaguar Land Rover, Gaydon, Warwickshire, CV35 0RR
Corresponding author: [email protected]
Coates C41, Faculty of Engineering, University Park, The University of Nottingham, NG7 2RD +44(0)115 951 4003
Dr Glyn Lawson is an Associate Professor in the Faculty of Engineering at The University of Nottingham, UK. Glyn is also a member of the Human Factors Research Group. His research interests include the human factors of advanced technologies for design and manufacturing applications. He has over 25 publications in journals, academic conferences and book chapters. Glyn is a Chartered Fellow of the Institute of Ergonomics and Human Factors.
Dr Tessa Roper is a Research Fellow in the Human Factors Research Group at The University of Nottingham. Tess has expertise in the development and use of virtual environments for education. Dr Paul Herriotts is a Technical Specialist in Human Factors at Jaguar Land Rover, and is responsible for all vehicle ergonomics activities. He has worked in both industrial and academic environments, and is practiced in two-way knowledge transfer between universities and industry. Louise Malcolm is Subject Matter Expert in Human Factors at Jaguar Land Rover. Her background combines Psychology and Ergonomics.
Perceptions of an automotive load space in a virtual environment
Abstract
A study was conducted to investigate the accuracy of perceptions of a car load space in a Cave Automatic Virtual Environment (CAVE). A total of 46 participants rated load space width, height, depth, usability and overall capacity after viewing either a virtual Range Rover Evoque in the CAVE or the real car. Participants were also asked to estimate how many 100mm3 blocks could fit in the load space in width, depth or height. The only significant difference was in usability, which was rated higher in the CAVE. There was no systematic over- or under-estimation of distances in the virtual environment. The results suggest that virtual environments can be used for car load space design, particularly for estimates of size, but further work is required to be confident that subjective ratings of virtual properties are equivalent to those of real vehicles.
Keywords
Automotive; load space; virtual environment (VE); virtual reality (VR); perception; CAVE.
Introduction
The benefits of virtual reality (VR) are well-established in design applications, including the ability to identify issues early in the design process, a reduction in the costs associated with building physical prototypes, and the possibility of a greater number of iterations in a design cycle thus improving the quality of the design and its match to end-users’ needs (Lawson & Burnett, 2015). One possible use-case for VR is the design of automotive load spaces (referred to as trunk in the US or boot in the UK) as it is important to gauge customer reactions to the size and usability of a load space during the development of a new car. These reactions play an important part in car purchase behavior, as evidenced by the inclusion of ratings of load space in Consumer Reports and J.D. Power and
Associates, two of the largest consumer reviews of vehicles (Senoz et al., 2011). The use of customer ratings of load space also implies that satisfaction cannot be adequately measured by objective measures such as volume or dimensions alone. Thus, it is necessary for designers and representative customers to view and assess the load space as part of the design process, but it is also important that the space is perceived accurately.
While VR has the potential to support the design of load spaces, distance perception in VR has been the subject of interest and debate in the scientific literature for several decades (e.g. Lampton et al., 1995). Studies of distance perception can be broadly categorized as either egocentric (i.e. distances from one’s self) or exocentric (i.e. distances between two objects). Egocentric distances (as would be experienced when judging the distance from oneself to the far limit of the load space) are often underestimated in virtual environments, averaging 74% of those in the real world (Renner et al., 2013). Renner et al. (2013) attribute this to several factors, including the method used to measure the distance, the technical attributes of the VR, the composition of the virtual environment, presence and individual differences. There is also evidence of inaccuracies in exocentric distance judgement in virtual environments (Henry and Furness, 1993; Waller, 1999; Wartenberg and Wiborg, 2003; Lin et al., 2014) although this is affected by several factors, including display type, feedback, parallax, and orientation of targets in the virtual environment. As exocentric judgement is more closely linked to estimates of load space width, height and depth, the relevant findings from previous research are outlined below.
a module of the International Space Station. Participants were asked to indicate on a real measurement scale the perceived distances between two points in each of the environments. The authors report that the CAVE was more accurate than the desktop virtual environment, but observed a trend towards overestimation of distances in the CAVE, whereas errors occurred in both directions in the desktop virtual environment. Wartenberg and Wiborg (2003) conclude that further work is required to evaluate the most suitable virtual environment set ups for different tasks. Waller (1999) also reported a tendency for overestimation, although unlike Wartenberg and Wiborg (2003) this was found on a desktop virtual environment.
Despite this evidence for overestimation of exocentric distances in virtual environments, some authors have provided evidence of underestimation of distances. Lin et al. (2014) asked participants to judge the differences between the centers of two targets presented at different distances from a screen (parallax) on which targets were presented in either vertical or horizontal orientations. They found underestimation of distances across all conditions, which became greater with wider spaced objects. They found no effects of orientation, despite expecting larger estimates for vertical orientations in accordance with the horizontal-vertical illusion (Fick, 1851) in which vertical distances are perceived as greater than those which are horizontal. Henry and Furness (1993) also found evidence for
underestimations of distances, in this case perceptions of gallery spaces when using a Head Mounted Display or monoscopic monitor. They did however provide evidence for greater accuracy in vertical rather than horizontal space judgement in virtual environments, but attribute this to methodological issues, such as participants’ use of standing height as an indicator of vertical distance and knowledge of standard heights for rooms among participants.
We see from the above that the specifics of a virtual reality setup and task can affect the accuracy of the distance perception. There is already evidence that judging distances and spaces in VR CAVE environments can be difficult in automotive applications (Lawson et al., 2015a; Lawson et al., 2015b), but to the best of the authors’ knowledge, no previous work has looked at the accuracy of perceptions of a load space in a virtual environment. This is important for informing the design process, as outlined at the beginning of this section. To address this research need, we studied the accuracy of perceptions of load space in a CAVE virtual environment and compared them to those obtained from a comparable real car. In this way, we aimed to determine whether a CAVE can be used to represent the design intent to designers or representative car buyers during the vehicle development process.
Method
Participants
46 Jaguar Land Rover (JLR) employees (15 female, 31 male) were recruited to participate in the study. One participant’s data were excluded from analysis as extreme scores across all measures were identified. All participants worked in the automotive industry on either a temporary or permanent basis (mean 12.5; SD = 12.9, range 0 to 43 years in the automotive industry). All participants were screened for susceptibility to simulator sickness prior to participating in the VR condition, and at-risk groups (for example, those who suffer from migraines or those who are pregnant) were advised not to participate.
Design
It was considered important for the same model of car to be used in both conditions to enable a comparison of the results. However, to avoid order effects, such as memory of the answers given to width/height/depth estimates across conditions, a between-subjects design was used. There were two conditions: Physical (where participants examined the load space of a real, physical car) and Virtual (where the participants examined a virtual model of the same car in a 3D CAVE). Each participant was randomly allocated to one of these conditions.
Measures
The dependent variables were:
Subjective participant ratings of the following, on a scale from 0 (very poor) to 10 (very good) of: car load space width;
car load space height; car load space depth;
usability of car load space; and overall capacity of car load space.
Estimations of the number of reference blocks which could fit in the width, height and depth of the car load space.
Apparatus
The study was based on evaluating the load space of the 2014 model year Land Rover Evoque. At the reference point used for this study (approximately in the center of the load space), the load space measured 1050mm wide; 745mm deep and 480mm high. A suitcase 660x460x240mm was placed in the load space of the car to illustrate the space available. A cube-shaped block (100x100x100mm) was used for the block estimation task. All of the apparatus were replicated using virtual models in the CAVE. The virtual models used the same dimensions, colors and shapes as the physical objects, and textures were replicated as closely as possible. The suitcase and the cube were placed in the car by the experimenter in both conditions; participants were only required to look at the load space. Images from the trial are shown in Figure 1.
{Figure 1 about here}
The virtual environment was shown on a four-sided CAVE using Deltagen 3Dexcite. The CAVE is powered by 16 computers (4 per screen) each with dual core CPU (Intel Xeon ES-2690). Two Sony projectors (SRX-510) were used per screen. To give the virtual vehicle context, it was shown in a driveway scene. The real car was located in the Ergonomics Laboratory at JLR.
Procedure
Prior to beginning the study, participants were asked to confirm that they did not experience any of the conditions associated with increased risk of simulator sickness. The objectives, procedure and data handling policies were explained to participants and informed consent was obtained before
proceeding. Participants were advised of their right to end the study and to have their data removed from the analysis. A pre-task questionnaire was used to obtain information about participant demographics, background, experience of VR and familiarity with the load space of the car model being tested.
1000mm from the front display screen by a panel of five human factors experts during the experiment set up. Each participant was asked to examine the load space of the vehicle without touching it or moving forward from the marker. A suitcase was placed in the load space as a reference to give the participant a better understanding of the available space. The suitcase was then removed before the participant was asked to rate and comment on the dimensions, usability and overall capacity of the load space. A cube was then placed in the middle of the load space and the participant was asked to estimate how many blocks of that size would fit in the load space (1) in width, left to right, (2) in depth, front to back and (3) in height, top to bottom, where the top was indicated as the base of the parcel shelf.
In the virtual condition, participants were then asked to complete a simulator sickness questionnaire (Kennedy et al., 1993) in order to monitor potential symptoms.
The study received approval from The University of Nottingham Faculty of Engineering Ethics Committee.
Results
Subjective ratings
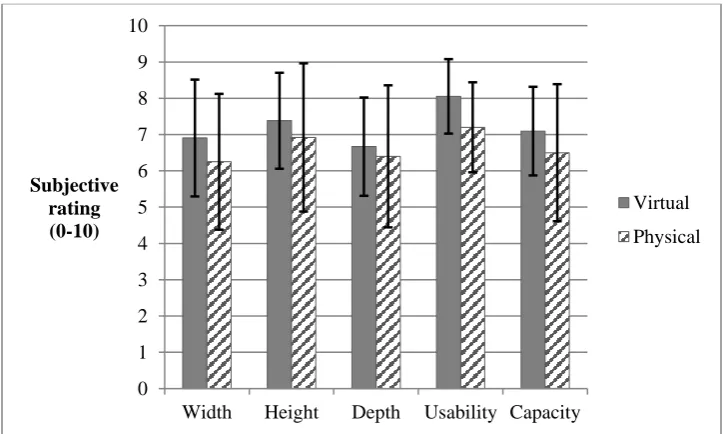
Table 1 shows the means and standard deviations of subjective participant ratings for each aspect of the car load space: width, height, depth, usability, and overall capacity1. Figure 2 shows the
comparative ratings of the two conditions. {Table 1 about here}
{Figure 2 about here}
T-tests were conducted to compare the ratings in the virtual and physical conditions. No significant differences were found for width (t = 1.249; df = 43), height (t = 0.891; df =43), depth (t = 0.508; df = 39), or overall capacity (t = 1.235; df = 43). There was, however, a significant difference in usability ratings between the two conditions (t = 2.333, df = 37, p < 0.05), with participants in the virtual condition rating higher (mean 8.05) than participants in the physical condition (mean 7.20).
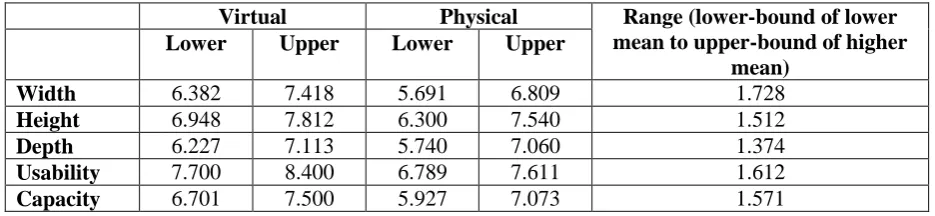
While there was no evidence of a significant difference for any rating other than usability, the results of the t-tests alone cannot be interpreted to conclude that the two conditions are statistically equivalent (Blackwelder, 1982). The results were therefore explored further using inferential confidence intervals (CIs), as proposed by Tryon (2001). Table 2 shows the calculated inferential confidence intervals. {Table 2 about here}
The inferential CIs for usability ratings do not overlap (Figure 3), corresponding with a statistical difference. For the other ratings, however, the range from the lowest CI to the highest CI is greater than 1 in each case. One point on a subjective rating scale would be considered a nontrivial difference in the application context, and therefore the results should be considered statistically indeterminate, rather than equivalent according to the procedure described by Tryon (2001).
1 There is debate over the use of parametric statistics with Likert-style rating scales (e.g. Jamieson, 2004).
{Figure 3 about here}
Block estimation task
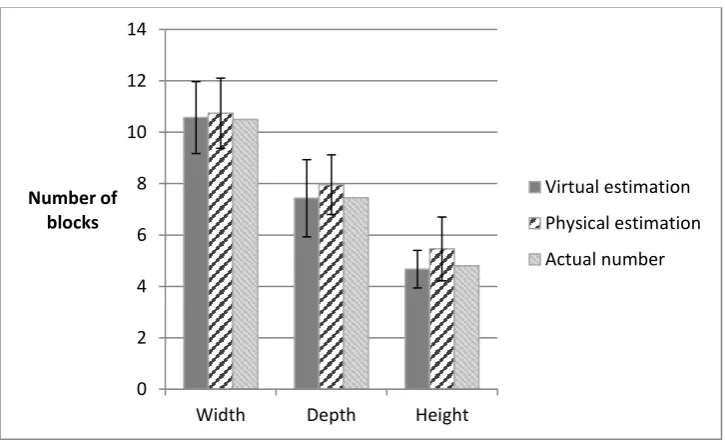
Table 3 shows the mean number of blocks that participants estimated could fit along each dimension of the car load space, along with the number of blocks that would actually fit in the load space for comparison. Figure 4 illustrates these data with standard deviations for each condition.
{Table 3 about here} {Figure 4 about here}
The absolute error was calculated by finding the difference between the actual number of blocks that could fit in the space and the estimated number of blocks for each participant. Descriptive statistics for this data are shown in Table 4. T-tests were conducted to compare differences between the physical and virtual conditions. No significant differences were found for width (t =-0.663; df = 43), depth (t = 0.797; df = 43), or height (t = -1.793; df = 43).
{Table 4 about here}
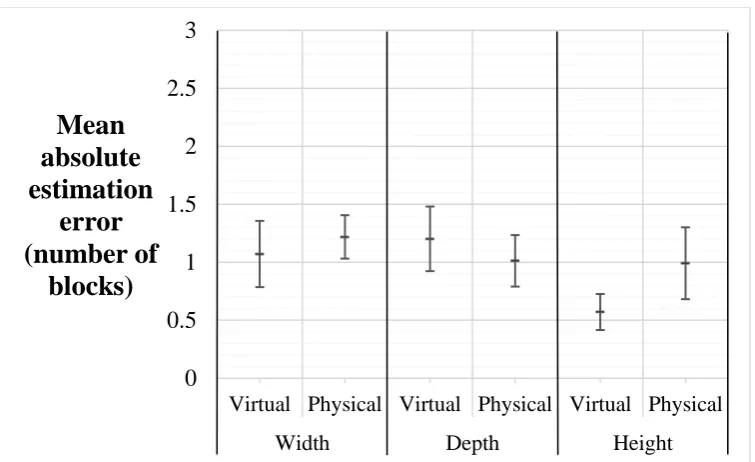
Inferential CIs were calculated for the absolute error made by participants in each condition (Table 5). For this measure it was determined that a difference in accuracy of half a block or more would be considered a nontrivial difference when investigating statistical equivalence.
{Table 5 about here}
Figure 5 shows the inferential confidence interval ranges. The accuracy of estimations for each dimension is statistically indeterminate; there is overlap in the inferential CIs (which confirms the absence of a statistical difference), but equivalence cannot be definitively concluded as the population means may be more than half a block apart.
{Figure 5}
The frequency charts in Figure 6, Figure 7 and Figure 8 show the absolute error by condition for width, depth and height estimations respectively.
{Figures 6,7,8 about here}
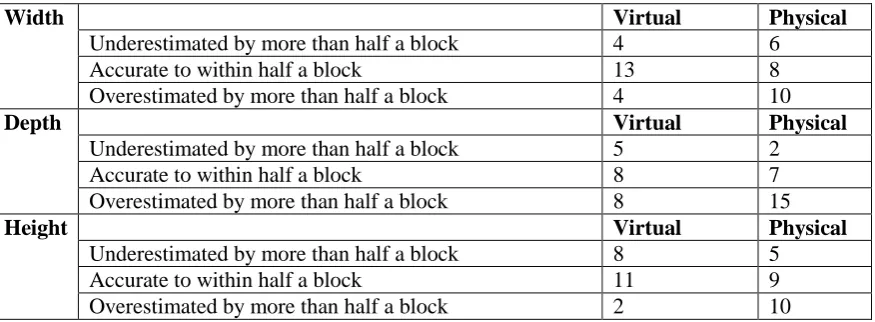
To investigate the presence of any systematic over- or under-estimation between virtual and real environments, we summed the total number of errors greater than half a block in both directions, for each of width, depth and height. The results are shown in Table 6.
{Table 6 about here}
Chi square results demonstrated that were no relationships between property type (physical or virtual) and estimation error (width: χ2 = 3.980, df = 2, p=0.137; depth: χ2 = 3.297, df = 2, p=0.192; height: χ2 = 4.121, df = 2, p=0.127).
Discussion
Wartenberg and Wiborg, 2003; Lin et al., 2014; Kenyon et al., 2007). Overall, our results showed that perception of space was not significantly different between the virtual (CAVE) and real vehicle for subjective ratings of distance and volume. We also looked at a block estimation task in recognition that subjective ratings would be affected by, for example, participants’ expectations, past experiences and current/past vehicles. In these block estimation tasks, we again found that ratings were not
significantly different between the virtual vehicle and the real vehicle, indicating the potential value of such a method for judging load space in a CAVE. Furthermore, similar to other authors (e.g.
Wartenberg and Wiborg, 2003), major inaccuracies in estimating dimensions were infrequent in our study, which provides greater confidence in the use of virtual environments for load space perception. In contrast to some of the previous research (Waller, 1999; Wartenberg and Wiborg, 2003; Lin et al. 2014), our study found no evidence for systematic over- or under-estimation in either virtual or real conditions. This lack of a consistent pattern (which is seen for egocentric distance perception, Renner et al. 2013) supports the notion that perception of distance and space in near-field VE applications is specific to the environment set up and task conditions.
Despite the potential usefulness of a CAVE for load space design, statistically significant differences were found for usability ratings between the real and the virtual conditions. Without further work it is impossible to determine the cause of this difference, although it is interesting that usability is the measure which required the most consideration of interactivity with the load space, which may be more difficult in the virtual environment. That is, the accuracy of ratings for usability may be adversely affected by participants’ inability to perceive interaction with the load space in the virtual environment condition.
Aside from the usability ratings, the subjective ratings of space were statistically indeterminate, i.e. they were not different but we did not have the evidence to conclude they were the same between conditions. This may have been because participant scores were highly variable, which in turn could be attributed to their subjectivity, with different participants using different criteria to make
judgements. This is evidenced by comments made by participants in justifying their scores; for example, one participant rated the height as 9 out of 10, stating that “my big case would fit in it, and that’s the biggest an airline would allow… [so it] seems big”, while another in the same condition rated the height as just 2 out of 10, reasoning that “I think my [Ford] Focus is bigger”. Despite the very subjective nature of these measures, they are important as they reflect customer responses when seeing a load space in a car dealer. As mentioned in the introduction, perceptions of the space, and not just the dimensions, play an important role in consumer purchase behavior, and measurement of perceptions is necessarily subjective. It may have been possible to control for this by using a within subjects design, but that would have impacted the block estimation task, as participants would be likely to remember their responses across conditions.
Overall, our results indicate that people’s judgements were not different between the virtual and physical vehicle, except when imagining interaction with it. This suggests that virtual reality has a place in the design of load spaces, and may reduce the number of physical prototypes required within the development cycle as more evaluations are conducted on virtual properties. Moreover, virtual reality may allow for a greater number of design iterations within the same (or even reduced) development time (Lawson and Burnett, 2015). Virtual environments may also allow for exploration of design solutions given the ease and speed of modification in digital solutions. However, testing on physical properties should remain part of the load space development process until we have complete confidence that the physical and virtual results are equivalent.
Conclusions
Previous research work has produced inconclusive or contradictory data on the accuracy of depth perception judgement in virtual environments. It appears that the accuracy is dependent upon the task and environment set up. This study reviewed the accuracy of perceptions of car load space in a virtual environment, to understand the use of such an approach in car design. We compared depth, width, height, usability and overall capacity ratings for virtual and corresponding real car load spaces, and found that only usability was significantly different. Analysis of the over and under estimations demonstrated no systematic errors with virtual environments. However, limitations on the sample size imposed by use of an industrial facility mean we cannot definitively conclude that the results from the virtual environment are statistically equivalent to those from the real environments. Therefore, we recommend the use of virtual environments for formative studies in car load space design, but also recommend retaining the use of physical properties as part of the final approvals process.
References
Blackwelder, W. C. (1982). “Proving the null hypothesis” in clinical trials. Controlled Clinical
Trials,3, 345-353.
Fick, A. (1851). De errore quodam optico asymmetrica bulbi effecto. Marburg: J. A. Kochin. Gardner, M. J., & Altman, D. G. (1986). Confidence intervals rather than P values: estimation rather than hypothesis testing. BMJ, 292(6522), 746-750.
Henry, D. and Furness, T. (1993) ‘Spatial perception in virtual environments: evaluating an architectural application’, Virtual Reality Annual International Symposium (1993), IEEE, Seattle, Washington, USA, pp.33–40.
Jamieson, S. (2004). Likert scales: how to (ab) use them. Medical education, 38(12), 1217-1218. Kennedy, R.S., Lane, N.E., Berbaum, K.S., & Lilienthal, M.G. (1993). Simulator Sickness
Questionnaire: An Enhanced Method for Quantifying Simulator Sickness. The International Journal
of Aviation Psychology, 3(3), 203-220.
Kenyon, R. V., Sandin, D., Smith, R. C., Pawlicki, R., & Defanti, T. (2007). Size-constancy in the CAVE. Presence, 16(2), 172-187.
Lampton, D.R., McDonald, D.P., Singer, M. and Bliss, J. (1995) ‘Distance estimation in virtual environments’, Proceedings of the 39th Annual Meeting of Human Factors and Ergonomics
Society, San Diego, California, USA, pp.1268–1272.
Lawson, G., Herriotts, P., Malcolm, L., Gabrecht, K., & Hermawati, S. (2015a). The use of virtual reality and physical tools in the development and validation of ease of entry and exit in passenger vehicles. Applied Ergonomics, 48, 240-251.
Lawson, G., Salanitri, D. and Waterfield, B. (2015b) ‘VR processes in the automotive industry’,
Human-Computer Interaction: Users and Contexts, Springer International Publishing, Cham,
Switzerland, pp.208–217.
Lin, C. J., Woldegiorgis, B. H., & Caesaron, D. (2014). Distance estimation of near‐field visual objects in stereoscopic displays. Journal of the Society for Information Display, 22(7), 370-379. Norman, G. (2010). Likert scales, levels of measurement and the “laws” of statistics. Advances in
health sciences education, 15(5), 625-632.
Renner, R.S., Velichkovsky, B.M., & Helmert, J.R. (2013). The perception of egocentric distances in virtual environments – a review. ACM Comput. Surv. 46(2), 23:1-23:40.
Senoz, O., Daughton, W., Gosavi, A., & Cudney, E. (2011). An evaluation of professional quality measurement systems for the automotive industry. International Journal of Engineering, Science and Technology, 3(7), 101-108.
Tryon, W.W. (2001). Evaluating statistical difference, equivalence, and indeterminacy using inferential confidence intervals: an integrated alternative method of conducting null hypothesis statistical tests. Psychological Methods, 6(4), 371-386.
Waller, D. (1999). Factors affecting the perception of interobject distances in virtual environments. Presence: Teleoperators and Virtual Environments, 8(6), 657–670.
Figure 1: Images of equipment set up. Top left: cube/real; top right: cube/virtual; bottom left: suitcase/real; bottom right: suitcase/virtual.
Figure 2: Mean rating and standard deviation for each aspect of the space. 0
1 2 3 4 5 6 7 8 9 10
Width Height Depth Usability Capacity
Subjective rating (0-10)
[image:10.595.71.434.493.710.2]Figure 3: Subjective ratings for each dimension with upper- and lower-bound inferential confidence intervals.
Figure 4: Chart of mean block estimation for each dimension with standard deviation, compared with the actual number of blocks.
0
1
2
3
4
5
6
7
8
9
10
Virtua
l
P
hysi
ca
l
Virtua
l
P
hysi
ca
l
Virtua
l
P
hysi
ca
l
Virtua
l
P
hysi
ca
l
Virtua
l
P
hysi
ca
l
Width
Height
Depth
Usability
Capacity
Subjective
rating
(0-10)
0 2 4 6 8 10 12 14
Width Depth Height Number of
blocks
Virtual estimation
Physical estimation
[image:11.595.72.435.469.689.2]Figure 5: Absolute estimation error for each condition with upper- and lower-bound inferential confidence intervals.
Figure 6: Absolute error in width estimations by condition.
0
0.5
1
1.5
2
2.5
3
Virtual Physical Virtual Physical Virtual Physical
Width Depth Height
Mean
absolute
estimation
error
(number of
blocks)
0 2 4 6 8 10 12 14
0
-0
.5
0
.5
1
1
-1
.5
1
.5
-2
2
-2
.5
2
.5
-3
3
-3
.5
3
.5
-4
4
-4
.5
4
.5
-5
Frequency
Absolute error (number of blocks) of width estimations
[image:12.595.70.434.399.591.2]Figure 7: Absolute error in depth estimations by condition.
Figure 8: Absolute error in height estimations by condition. 0 2 4 6 8 10 12 14 0 -0 .5 0 .5 -1 1 -1 .5 1 .5 -2 2 -2 .5 2 .5 -3 3 -3 .5 3 .5 -4 4 -4 .5 4 .5 -5 Frequency
Absolute error (number of blocks) of depth estimations
Virtual Physical 0 2 4 6 8 10 12 14 0 -0 .5 0 .5 -1 1 -1 .5 1 .5 -2 2 -2 .5 2 .5 -3 3 -3 .5 3 .5 -4 4 -4 .5 4 .5 -5 Frequency
Absolute error (number of blocks) of height estimations
[image:13.595.71.438.329.531.2]Table 1: Mean and standard deviation of subjective ratings of the car load space on a scale from 1-10.
Virtual Physical
Mean SD Mean SD
Width 6.90 1.609 6.25 1.87
Height 7.38 1.322 6.92 2.04
Depth 6.67 1.354 6.40 1.96
Usability 8.05 1.026 7.20 1.24
[image:14.595.64.532.237.345.2]Capacity 7.10 1.221 6.50 1.89
Table 2: Inferential Confidence Intervals for subjective ratings data.
Virtual Physical Range (lower-bound of lower
mean to upper-bound of higher mean)
Lower Upper Lower Upper
Width 6.382 7.418 5.691 6.809 1.728
Height 6.948 7.812 6.300 7.540 1.512
Depth 6.227 7.113 5.740 7.060 1.374
Usability 7.700 8.400 6.789 7.611 1.612
[image:14.595.67.414.393.472.2]Capacity 6.701 7.500 5.927 7.073 1.571
Table 3: Mean estimated number of blocks and actual number of blocks along each dimension. Actual number of
blocks
Mean estimation – Virtual condition
Mean estimation – Physical
condition
Width 10.50 10.57 10.74
Depth 7.45 7.43 7.96
Height 4.80 4.67 5.46
Table 4: Mean and standard deviation of absolute error (discrepancy between estimated and actual number of blocks) for each condition.
Virtual Condition Physical Condition Mean
discrepancy
SD Mean
discrepancy
SD
Width 1.07 0.870 1.22 0.614
Depth 1.20 0.860 1.01 0.739
Height 0.57 0.457 0.99 0.984
Table 5: Inferential Confidence Intervals for estimation error data.
Virtual Physical Range (lower-bound of lower
mean to upper-bound of higher mean)
Lower Upper Lower Upper
Width 0.785 1.357 1.032 1.406 0.620
Depth 0.924 1.481 0.791 1.234 0.690
Table 6: Over- and under-estimation and accurate estimates.
Width Virtual Physical
Underestimated by more than half a block 4 6
Accurate to within half a block 13 8
Overestimated by more than half a block 4 10
Depth Virtual Physical
Underestimated by more than half a block 5 2
Accurate to within half a block 8 7
Overestimated by more than half a block 8 15
Height Virtual Physical
Underestimated by more than half a block 8 5
Accurate to within half a block 11 9