1
Highly efficient intracellular transduction in three-dimensional gradients
for programming cell fate
Hoda M. Eltaher1, 2, Jing Yang1, Kevin M. Shakesheff*1 & James E. Dixon*1
1
Wolfson Centre for Stem Cells, Tissue Engineering, and Modelling (STEM), Centre of Biomolecular Sciences, School of Pharmacy; University of Nottingham, Nottingham, NG7 2RD, UK
2
Department of Pharmaceutics, Faculty of Pharmacy; Alexandria University, Alexandria, 21521, Egypt
*Correspondence should be addressed to Kevin M. Shakesheff or James E. Dixon [email protected]
Wolfson Centre for Stem Cells, Tissue Engineering, and Modelling (STEM) Centre for Biomolecular Sciences
University of Nottingham University Park
2 Abstract
Fundamental behaviour such as cell fate, growth and death are mediated through the control of key genetic transcriptional regulators. These regulators are activated or repressed by the integration of multiple signalling molecules in spatio-temporal gradients. Engineering these gradients is complex but considered key in controlling tissue formation in regenerative medicine approaches. Direct programming of cells using exogenously delivered transcription factors can by-pass growth factor complexity but there is still a requirement to deliver such activity spatio-temporally. We previously developed a technology termed GAG-binding enhanced transduction (GET) to efficiently deliver a variety of cargoes intracellularly using GAG-binding domains to promote cell targeting, and cell penetrating peptides (CPPs) to allow cell entry. Herein we demonstrate that GET can be used in a three dimensional (3D) hydrogel matrix to produce gradients of intracellular transduction of mammalian cells. Using a compartmentalized diffusion model with a source-gel-sink (So-G-Si) assembly, we created gradients of reporter proteins (mRFP1-tagged) and a transcription factor (TF, myogenic master regulator MyoD) and showed that GET can be used to deliver molecules into cells spatio-temporally by monitoring intracellular transduction and gene expression programming as a function of location and time. The ability to spatio-temporally control the intracellular delivery of functional proteins will allow the establishment of gradients of cell programming in hydrogels and approaches to direct cellular behaviour for many regenerative medicine applications.
1 1. Introduction
Authentic regeneration of adult tissue requires exquisite control of the biological microenvironment and the appropriate cellular plasticity in order to recapitulate the developmental processes from which the tissue was originally formed. Key cellular processes like migration, proliferation, adhesion and differentiation occur in response to chemical cues present within the microenvironment such as interaction with extracellular matrix (ECM) and stimulation with morphogens or growth factors [1, 2]. These macromolecules trigger intracellular signal transduction pathways, with complex cross-talk between the cascades and eventual programming of cell behaviour changes at the level of gene expression. Such networks provide important positional information that control cell behaviour in a concentration dependent manner inside the tissue [2-4]. In this context, recreating gradients of such molecules in 3D scaffolds has been used extensively to study such biological responses in vitro
and by exploiting bioengineering strategies, this knowledge may help permit the development of complex tissues for regenerative applications.
2
methods which employ microfluidics) as they may introduce extra cellular shear stress and asymmetric mass transport unlike simple diffusion systems [22, 23].
Within a tissue, 3D concentration gradients are thought to exist for every soluble component, such as those consumed or produced by the cells from basic nutrients to signalling molecules. Gradients form due to competition between diffusion of these molecules and convection by cell consumption or release [24]. Local signal concentration and duration affect the cellular response directly; meaning cells have alternate interpretation of signals in different zones of tissue depending on this dynamic [4]. The ultimate realization of signalling is the interpretation by the cell to activate key regulatory genes, which in turn, instruct cell behaviour. We and others have shown that by delivering specific transcriptional master regulators either genetically (via viruses [25]) or recombinantly (using purified proteins, [26]) powerful cell fate changes can be programmed, effectively by-passing this highly-complicated interaction of extracellular signalling.
3
(the composite peptide termed GET peptides). Functional quantities of many cargos including fluorescent proteins, transcription factors and enzymes were successfully delivered using GET with significant increase in functional delivery compared to conventional CPP-mediated delivery and using sub-micromolar doses.
Here, we demonstrate that the efficient cellular uptake of proteins using the GET technology may be employed in a 3D hydrogel system (Gelatin-Agarose; GA). Using a diffusion-based model (So-G-Si), we have created 3D cell–laden hydrogels with dynamic spatio-temporal gradients of GET proteins to study cell uptake and the potential of GET to be used to program cell behaviour in 3D.
2. Materials and methods
2.1. Hydrogel fabrication in compartmentalized diffusion chamber
4
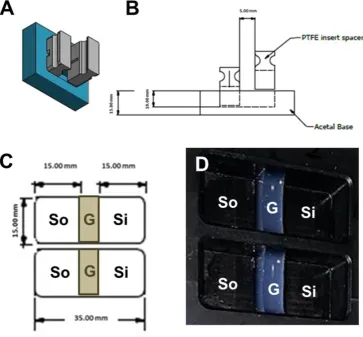
The oxygen etching was carried out for 15 minutes in a T-shaped borosilicate chamber closed with stainless steel endplates that were sealed with Viton O-rings at a power of 20 W, under a working pressure of 300 m Torr. Prior to hydrogel casting, the ARM and PTFE blocks were sterilized in industrialized methylated spirit (IMS; 70% v/v) for 30 minutes, washed twice with sterile PBS, air dried in microbiological safety cabinet and then exposed to UV light for 20 minutes. This resulted in scaffolds with the dimension of 15×5×6.6 mm (Length × Width × Height) (Figure S1D).
For cellular scaffolds, NIH 3T3 mouse fibroblasts cells were suspended in the prepared gels at 2x10⁶ /ml at 37ºC. Hydrogels were allowed to cast in moulds for 30 minutes at 4°C then the PTFE blocks were removed creating the sink and source compartments.
2.2. Diffusion studies and GET proteins
Source compartments were loaded with 50 µg/ml of test recombinant protein in 500 µL growth medium unless otherwise stated. Non-transducing monomeric red fluorescent protein (mRFP1; mR), CPP (eight arginine, 8R) -tagged mRFP1 (mR-8R), heparin binding domain; HBD (P21) –tagged mRFP1 (P21-mR), or the complete Glycosaminoglycan-binding enhanced transduction (GET is CPP and HBD) –tagged mRFP1 or MyoD protein (P21-mR-8R and P21-mR-MyoD-8R, respectively) were expressed and purified from E.coli using GST affinity purification as previously described by Dixon et al. [26]. Sink compartments were loaded with 500 µL growth medium. Diffusion experiments were carried out at 37°C under 5% CO2 in humidified incubator.
2.3. Diffusion gradient evaluation
5
further diffusion. These were then serially sectioned perpendicular to the direction of protein diffusion using Leica CM 1100 cryostat at -20ºC into 20 µm thick slices. Each slice was vortexed in warm in PBS (350µl) and the protein concentration within was then determined by fluorometric analysis (excitation: 584 nm; emission: 620 nm) using a TECAN infinite 200PRO multimode reader. Each time point diffusion study was carried out in triplicate, and analysis to detect protein concentration per slice was performed in triplicate for each hydrogel. Diffusion gradient profiles across the width of the hydrogel scaffolds were constructed by plotting protein concentrations per 20 µm width slice at different time points as a function of distance in the scaffold away from source.
Alternatively, cellular scaffolds at different time points were exposed to a selective washing protocol which removed all fluorescence that was not associated with or internal to cells (as determined by optimisation using acellular scaffold). Cells within hydrogel were fixed by 3.7% (w/v) para-formaldehyde (PFA; Sigma-Aldrich, UK) for 3 hours at 4 ºC, followed by 2 hours in sucrose 15% w/v (Sigma-Aldrich, UK) in PBS at 4ºC and finally overnight in sucrose 30% w/v at 4ºC. Scaffolds were then placed in OCT mounting media, frozen in liquid nitrogen cooled isopentane bath then stored at -80ºC. Scaffolds were subsequently sectioned parallel to the direction of protein diffusion using Leica CM 1100 cryostat at -20 ºC into 20 µm thick slices. Retrieved gel slices were then viewed under fluorescence image capturing using Nikon stereomicroscope SMZ 1500 for entire scaffold imaging.
2.4. Intracellular transduction analyses
6
enzymatic digestion following a protocol modified from Ran Yu et al. [37]. Briefly, hydrogel slices were digested by addition of 10 µL10X agarase reaction buffer (New England Biolabs, USA) to each slice. The mixture was heated at 50 ºC for 5 minutes and left to cool to 44ºC for 25 minutes. 2 µL β-agarase I enzyme (New England Biolabs, USA) were added to each sample and the mixtures were maintained for 1 hour at 44ºC. Hoechst 33342 at 2.5 µg/mL (Cell Signaling, USA) was added to the liquefied gel slices and stained for 30 minutes at room temperature. Samples were then analysed using a MoFloTM DP (DAKO) Flow Cytometer using the green (561 nm) and violet (405 nm) lasers to detect staining for red fluorescent proteins and Hoechst 33342 respectively (20,000 events per sample). Mean red fluorescence per cell was used to compare transduction activity with background from unlabelled cells being subtracted and values taken as ratios to the control monolayer of NIH mouse fibroblasts (1x10⁶ cells) exposed to an equivalent concentration of recombinant for 24 hours. Data shown was collected from three independent experiments.
2.5. Protein size and molecular weight
Protein size (hydrodynamic radius) of the variable test proteins was determined using the Zetasizer Nano ZS (Malvern instrument) applying the principle of dynamic light scattering. Measurements were done on protein solutions in HEPES buffer pH 7.2 at 37ºC. For determination of protein molecular weights, sodium dodecyl sulphate-polyacrylamide gel electrophoresis (SDS-PAGE) using Novex® 10% Tris-Glycine mini protein gel (Invitrogen) was applied following manufacturer’s instructions. Gels were stained with Coomassie blue (Invitrogen) and de-stained before imaging.
7
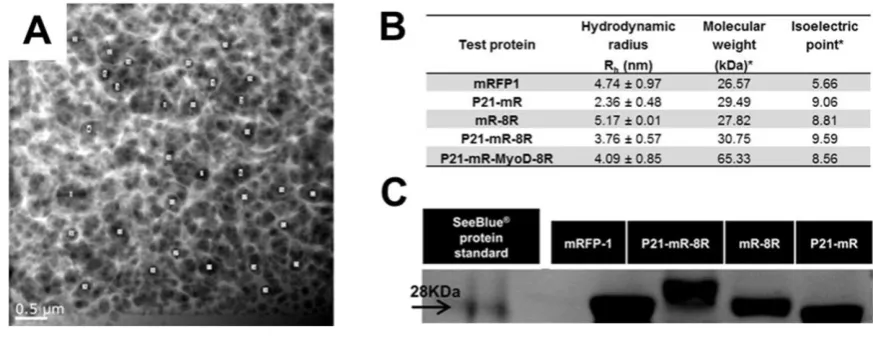
The mesh size of GA hydrogels were estimated using transmission electron microscopy. Sucrose-dehydrated hydrogel sample was sectioned down to 80 nm thick slices at -60 ºC and 0.9 mm/s cutting speed using a freshly prepared glass knife in the RMC Powertome with CR-X cryo-attachment. Sections were placed on holey carbon support films in copper grids (HC300-Cu, Electron Microscopy Sciences, UK), then transferred to the JEOL 2100F transmission electron microscope operating at an accelerating voltage of 200 kV. Imaging was performed using the High Angle Annular Dark Field STEM mode. Randomly selected pores in the transmission electron micrographs were used to determine the average pore size using ImageJ software.
2.7. Real time-qPCR
Cellular scaffolds (Human embryonic kidney cells; HEK 293, 2×10⁶ cells/mL), exposed to culture medium or GET-MyoD (P21-mR-MyoD-8R) (60 µg/mL) for 3 days, were serially sliced into five parallel sections each 1 mm in diameter and snap frozen at -80 ºC. RNA was extracted using a Qiagen RNeasy mini kit (Qiagen, UK) and quantified using a Nanodrop spectrophotometer (ND-100 Thermo Scientific). This was followed by reverse transcription into cDNA using SuperScript™ III Reverse Transcriptase enzyme (Invitrogen, UK) according to manufacturer’s instructions. Quantification of the gene expression was performed using rT-qPCR analysis (ΔΔCT) using Taqman assays for human Actin-β, MyoD1, Myogenin, Myf5
and Desmin (Applied Biosystems, UK) as detailed Dixon et al.[26].
2.8. Statistical analysis
8
considered significant if p<0.01. Spearman’s regression was used to calculate the
rank correlation of the gradients produced. Further information on these analyses can be found in supplemental methods.
3. Results
3.1. Engineering of a hydrogel diffusion method
We engineered a moulding system (acetal resin mould; ARM) in which we could cast a hydrogel (gel, G) sample between a source (So) and sink (Si) area (creating a compartmentalised chamber of So-G-Si) (Figure S1). This system, by the use of plasma oxygen etching prior to casting the hydrogel, reproducibly demonstrated no leakage (using Fluorescein) between source and sink (by-passing the construct) for a variety of hydrogels (collagen, alginate, agarose, fibrin) (Figure S2). This was further confirmed by conducting opposing diffusion studies of TRITC- and FITC-labelled bovine serum albumin (BSA) from different compartments neighbouring the hydrogel (Figure 1 and S2). Mirror image diffusion profiles of TRITC- and FITC-BSA were established confirming the potential of the compartmental diffusion model/quantification protocol in developing and evaluation of chemical gradients irrelevant of the fluorescent tag employed. We used cryosectioning to analyse hydrogels (which required freezing samples without sucrose embedding) to avoid dilution of the soluble fluorescent signals and disturbance of the diffusion profile. Our technique created large mesh sizes in the samples (Figure 1B-D; produced by ice crystals) but faithfully retained the diffusion profile (Figure 1E) [38].
9
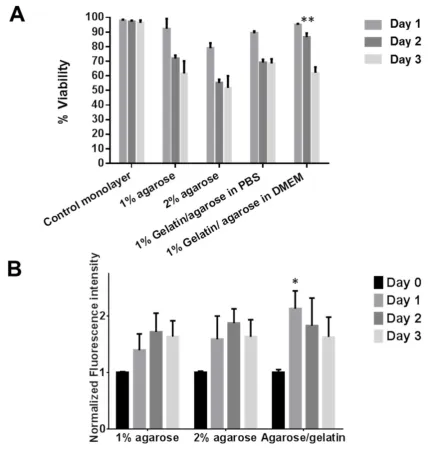
modification behaved similarly to agarose-only matrices and allowed the cells to retain viability over a 3-day experiment (Figure S3). We thought it important to assess the GA hydrogel porosity by assessing mesh size (with sucrose embedding). Transmission electron microscopy (TEM) demonstrated the GA hydrogel possesses pores with an average size of 0.198 ± 0.079 µm (Figure S4A). The pore size of frozen-hydrated GA samples was, furthermore, confirmed using focused ion beam scanning electron microscope (FIB-SEM) coupled with TEM [39]. This nanoporous hydrogel therefore dictates that encapsulated cells have restricted movement, allowing the gradients of proteins to be determined without changes confounding analyses over time such as cell migration.
To further define our system, we sectioned cell-laden GA hydrogels in all three dimensions and determined the number of cells in each section (compared to the expected numbers if uniformly distributed). We were able to confirm that cells were evenly distributed throughout the GA hydrogel (Figure S5) and therefore we had created homogenously cell-laden hydrogel system for diffusion analyses.
3.2. Using GET-tagged proteins to assess the effect of intracellular
transduction on protein gradients
10
initially assessed if differences in our test proteins’ hydrodynamic radii in 10 mM HEPES buffer (Dynamic Light Scattering analyses; DLS; Figure S4B and S6) and molecular weight (SDS gel electrophoresis; Figure S4C) were likely to affect diffusion. DLS assessment revealed similar sizes for all test proteins (mR, mR-8R, P21-mR and P21-mR-8R) ranging from 2.36 to 5.17 nm hydrodynamic radii (Figure S4B and S6). All proteins ran close to their theoretical molecular weights (all around ~28 kDa; SDS-PAGE assessment) calculated based on their amino acid sequences (Figure S4C) [40]. We therefore conclude that simple protein size was unlikely to be a major factor influencing diffusion behaviour.
11
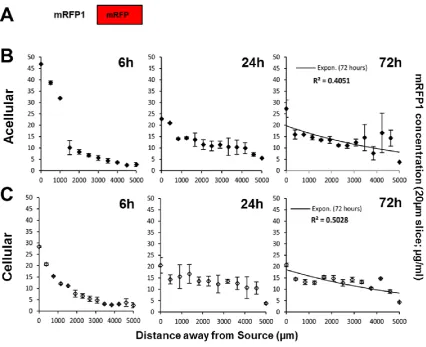
calculated indicating relatively poor correlation between variables, further demonstrating equilibrium. Importantly we show that our system can rapidly create a diffused gradient of mRFP1 protein within 24 hours and that this reaches equilibrium within the hydrogel by 72 hours.
3.2.1. Cells do not prevent equilibration of non-transducing proteins
We next assessed if diffusion within constructs was affected by the presence of mammalian cells (NIH 3T3 cells) aiming to determine the rate of gradient formation and equilibration. Testing different cell densities in scaffolds (0.1-2x10⁶ cells/ml) gave similar diffusion profiles to acellular scaffolds with comparable trends at respective time points (Figure 2C). The coefficient of determination (for exponential decay fitted data; Figure 1C, right graph, R2) and Spearman’s correlation rank coefficient (rs) for cellular scaffolds was comparable to acellular experiments with 72 hours post-initiation being that both achieved complete equilibrium (cellular and acellular being R2 = 0.503 and 0.405, and rs = -0.6374 and -0.5297, respectively; Table S1). These data demonstrate that early gradients (up to 24 hours) are dissipated and an equilibrium state is achieved regardless of presence or absence of cells within 72 hours. It is important that mRFP1 protein diffusion is statistically unaffected by the presence of cells in our system as we have previously shown it cannot efficiently interact with or transduce into cells [26].
3.2.2. GET-proteins transduce cells efficiently in 3D hydrogels
12
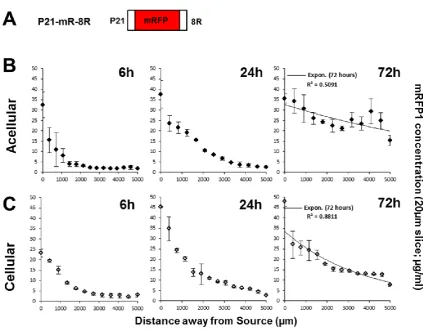
[26]. mRFP1 (non-transducing) and P21-mR-8R (transducing) diffusion was very similar through both acellular and cellular hydrogels over 6 and 24 hours (Figure 3B & 3C). However, unlike as demonstrated for mRFP1, the well-established gradient of P21-mR-8R is retained in the cellular scaffold at 72 hours. This gradient was a function of distance from source with further zones being lower in protein concentration compared to those neighbouring the source. Importantly this effect was not seen for acellular scaffold which equilibrated with the same efficiency as mRFP1 with or without cells. Analyses of the data from P21-mR-8R diffused cellular scaffolds (Figure 3C) showed they maintain a steep gradient at 72 hours (R2=0.8811 and rs=-1.0000) relative to equilibrium seen in acellular hydrogels (R2=0.5091 and rs=-0.6573) (Figure 3B and Table S1). Determination of the diffusion coefficients of both test proteins across GA hydrogels (Figure S8) was calculated using the model permeation method previously described in Cao and Shoichet [16] (using Equation 1). The diffusion coefficients of mRFP1 & P21-mR-8R were determined to be 7.15x10⁻⁷ & 7.53x10⁻⁷ cm2/s respectively.
3.3. GET-proteins transduce cells in a gradient
13
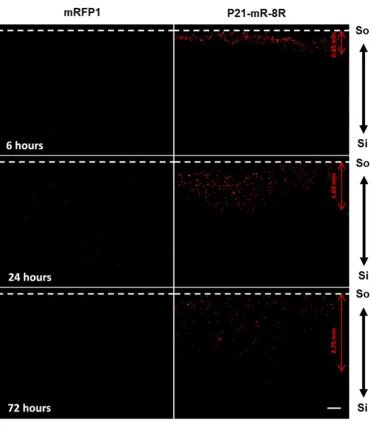
transduced cells which could be observed microscopically (Figure 4). The protocol was set up such that cells remained preserved and intact, while all signal from the gel component was completely removed (optimised on acellular hydrogels using mRFP1). Fluorescence microscopy was used to compare the effect of the transducing P21-mR-8R to the non-transducing mRFP1 in cellular hydrogels, which demonstrated that P21-mR-8R scaffolds possessed strongly red fluorescently-labelled cells compared to unfluorescently-labelled cells for mRFP1 diffused hydrogels (Figure 4). We assessed a time course of diffusion using these analyses and were able to demonstrate that width of the hydrogel bands through which the transduced cells could be observed (following P21-mR-8R diffusion) was increased as a function of time and closely mirrored the initial protein gradient established in hydrogels (Figure 3).
Equilibrium was observed across the width of cellular and acellular hydrogel scaffolds exposed to mRFP1 as demonstrated by low value of coefficient of determination of the exponential phase decay model. This statistic acts as an indication of free diffusion of the reporter protein without remarkable cellular uptake within 72 hours. A similar behaviour was observed for acellular scaffolds exposed to P21-mR-8R; however, the presence of cells maintained a steep gradient (exponential decay) demonstrated by higher goodness of fit r2= 0.881. This data emphasizes enhanced cellular uptake of P21-mR-8R shifts the state of equilibrium (demonstrated by evenness in concentrations of mRFP1 across the hydrogel width) to an exponential decay curve.
3.4. Intracellular transduction of GET proteins is directly proportional to
14
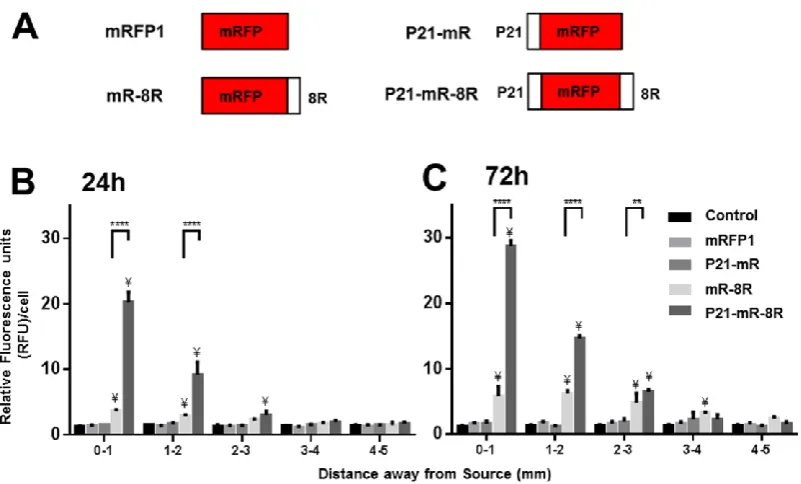
To confirm the intracellular transduction of P21-mR-8R, intact cells were retrieved from the hydrogel and their fluorescent intensities analysed by flow cytometry with the mean cell intensity assessed as function distance from the source. We optimized the recovery procedure to ensure cells remained intact (recovered from liquefied 1 mm thick hydrogel slices) and were counter-labelled with nuclear stain Hoechst 33342. It was found essential to counterstain cells to exclude non-digested hydrogel debris as events in the data analysis. Only cells that were positively stained for mRFP1 and Hoechst 33342 were used for the evaluation and we assessed the transduction of P21-mR-8R versus mRFP1, and singly tagged proteins P21-mR and mR-8R (Figure 5A).
Cells retrieved from hydrogels through which mRFP1 or control culture medium diffused showed equal fluorescence intensities all over the scaffold width at different time points (Figure 5B & 5C). Similarly, minimal cell fluorescence uptake/labelling were observed following diffusion of the cell binding P21-mR. As hypothesized, cells in scaffolds treated with P21-mR-8R, showed gradual decrease in fluorescence intensity as a function of distance at 24 and 72 hours (Figure 5B & 5C). These cells possess significantly higher fluorescence values compared to cells within control culture medium and mRFP1 treated samples at each slice position (Figure S9). Furthermore, the gradual intracellular transduction mediated by P21-mR-8R in samples was significantly higher than samples with CPP-tagged mRFP (mR-8R) for both 24 hours and 72 hours. Interestingly, both CPP- and GET-tagged proteins maintained a similar spatial trend, suggesting that the intracellular sequestering of the mRFP1 signal was responsible for maintenance of the gradient.
15
hours; Figure 6A and 6B, respectively) were assessed for background signal and cell-associated fluorescence. We defined cell-associated fluorescence as Hoechst 33342-positive foci (highlighting the presence of cells) which we used to visualize the nucleus of cells to exclude any red fluorescence not associated with cells. Cells in the liquefied hydrogel slices from control culture media diffused did not show any red fluorescence signal, which also demonstrated no background fluorescence from the hydrogel or the culture medium. Liquefied scaffold slices from mRFP1 treatments showed negligible red fluorescence associated with cells. However, they did show gradual decrease in the fluorescence intensity emerging from the hydrogel as a function of distance (24h, Figure 6A) and relatively less steep to equilibrated fluorescence intensity change over time (72 hours, Figure 6B).
16
Even though the mean fluorescence appeared similar for mRFP1 and P21-mR-8R proteins in these analyses, it was clear that the cell-association of the fluorescence distinguished their diffusion profiles. To express this, we analysed variation (standard deviation of pixel intensity) across the same images; as cell-associated fluorescence appeared as punctate signal in the cells, more cell association creates an increased signal variation in a sparsely populated scaffold. The fluorescence signal for the mRFP1 scaffold had low variance compared to significantly higher variation for P21-mR-8R images (Figure S10B). These data further confirm that though early in this diffusion model for cellular scaffolds that analyses that do not distinguish between cell-association yield essentially the same diffusion trend; however, it is clear that cell-transduction can change diffusible protein availability by sequestering the signal inside cells.
3.5. Induction of early myogenic differentiation using GET-MyoD and a 3D
concentration gradient
RT-17
qPCR. Initially we showed that HEK293T cells cultured in conventional monolayers respond dose-dependently to GET-MyoD and initiate endogenous myogenic gene expression in 72 hours (Figure 7B). Comparing monolayer- versus GA hydrogel-cultures directly exposed to GET-MyoD, we showed relatively inhibited myogenic induction in GA hydrogels but that GET-MyoD did indeed significantly induce myogenic gene expression in this microenvironment (Figure 7B and C). Importantly, without stimulating cells with GET-MyoD, there was no effect on background myogenic- or house-keeping gene expression (β-actin) when culturing cells in GA scaffolds. Using our 3D diffusion system, we found a pronounced increase of the endogenous expression of MYOD and other myogenic markers (MYOGENIN, DESMIN and MYF5) in GA slices retrieved from scaffolds exposed to GET-MyoD protein for 72 hours (Figure 7D). This was inversely proportional to the distance from the source and no induction was observed in scaffolds exposed to control culture medium. Interestingly, induction of myogenesis in GA gradients (at similar concentrations taken at specific points), was lower than the corresponding monolayer or uniformly-stimulated GA hydrogels (Figure 7C and 7D). Importantly, as our gradient system is dynamic (with a progressive increase in protein over time as a function of distance from the source), cells would not be exposed to the same duration and concentration of GET-MyoD in the gradient system. Here, we therefore show that transcription factors delivered by GET can be supplied in a gradient, elicit different gene expression programming efficiencies and that the duration and concentration of GET-MyoD stimulation is distinct from non-gradient systems.
4. Discussion
18
created assays to assess the diffusion of recombinant proteins both qualitatively and quantitatively using microscopy, fluorometry and cytometry. Using this system, we assessed the effect of cellular transduction on gradient establishment and retention over time. We employed GET-tagged proteins that represent a novel and efficient transduction approach and compared them to a conventional cell penetrating peptide (CPP)-tagged and control non-transducing proteins. GET-proteins efficiently transduce cells ‘locking in’ the diffusion profile of the protein by immobilising it intracellularly.
19
(Figure S7). Other systems that aimed to assess gradients within hydrogels in the presence of cells mostly employ hydrogels cast over a cell monolayer [16, 41]. We aimed that cellular components were evenly dispersed in the whole 3D matrix (Figure S5) rather than plating cells on the base of the mould with the hydrogel being cast above or cells seeded on top of the hydrogel construct [16, 42]. This was needed in the current study to demonstrate the effect of cells on the diffusion of proteins and to expose the cells to conditions mimicking the natural microenvironment that accommodates the cells.
20
neutral with low electroendosmosis value ≤0.05 and low sulphate content ≤0.10%. Gelatin type B is a denatured collagen with RGD-like sequences that support cell proliferation and attachment [44] and it is known to have a pI of 4.7-5.2 [45] suggesting that the overall charge of the hydrogel is slightly negative. These attributes would suggest that there is minimal electrostatic interaction between mRFP1 and the GA hydrogel.
The pore size of the GA system was calculated to be 0.198±0.079 µm and this matches with the reported average pore size of 0.1-0.3 µm for different concentrations and types of agarose (Figure S4A) [46]. This pore size cut off is far larger than the hydrodynamic radii of test proteins (Figure S5B) and therefore our system supports diffusion. Interestingly P21-mR-8R, which has a similar molecular weight to the other tests (Figure S4C) but a higher pI of 9.59 [40] is consistently slower diffusing than the other test proteins (Figure 3 and 5). It could be possible that positively charged P21-mR-8R has an electrostatic interaction with the negatively charged hydrogel resulting in relatively slower diffusion. However, the practical estimation of the diffusion coefficients of mRFP1 and P21-mR-8R was more or less similar 7.15x10⁻⁷ versus 7.53x10⁻⁷ cm2/s respectively (Figure S8, Equation 1) suggesting these differences are small and overall the test proteins possess similar diffusion behaviours in our system.
21
protocol) with fluorescent signal only detectable inside cells (confirmed by flow cytometry) and not in the hydrogel matrix.
Only background fluorescence was retrieved from scaffolds exposed to mRFP1 due to its poor cell interaction and transduction activity [26]. Minimal but detectable cellular fluorescence was observed for both CPP-only (mRFP-8R) and HBD-only (P21-mRFP) tests. However, the gradient was retained at significantly lower level for mRFP-8R (compared to that of P21-mR-8R); suggesting that cell transduction was a key factor in retaining the gradient over time (Figure 5). P21-mRFP does transduce cells at low levels but this activity was found insufficient to sequester the amounts of protein intracellularly to retain the gradient. It is likely that cells close to the source (and over time due to diffusion) quickly become saturated with test protein; if the protein is not effectively transduced inside of cells it will still be readily diffusible and the gradient rapidly equilibrates.
22
exposure in gradient being different than if homogeneously delivered in static cultures. Furthermore, this result could be attributed to the altered gene expression in later differentiation stage that might be induced by higher doses of GET-MyoD. This is plausible as threshold dose and duration of transcription factor activity will be different for activation of particular downstream genes. Importantly, MyoD is a myogenic regulatory factor that is highly expressed in early myogenesis and its activity declines in the later phases of differentiation [47] which is consistent with our observations. Importantly, we demonstrate significant induction of zonal myogenic differentiation after 72 hours in response to GET-MyoD gradient in absence of myogenic medium.
Our study complements other’s work aiming at engineering complex gradients in matrices [48]. However, the method employed for our study was unique as it generated a soluble transcription factor gradient which was simply achieved by molecular diffusion. This is in comparison to studies using non-covalent immobilization, such as Runx2 retroviruses (on poly(L-lysine)-coated collagen constructs as described in Phillips et al. [42]) which are far more complex and not based on simple diffusion kinetics. Furthermore, the introduction of highly efficient GET transduction system overcomes the limitations associated with efficiency and toxicity of viral vectors [27], and programs cells without genetic modification. Moreover, our system investigates the effect of gradient transcription factor delivery in a genuine 3D matrix with cells encapsulated within the material rather than seeded on top or underneath the scaffolds [16, 42].
23
of cell number, degradation of the hydrogel system combined with the secretion extracellular matrix would need to be studied to fully understand the factors contributing to concentration gradient manipulation. Finally, careful choice of a clinically relevant cell type and analyses with multiple differentiation markers corresponding to the continuous change of gene profiling with time together with immunohistochemistry will need to be employed to completely study cellular responses towards the generated GET-protein gradients.
5. Conclusions
The compartmental diffusion model presented here succeeded in the production of a 3D gradient of GET proteins which transduce into cells. The higher efficiency of transduction using the synergistic combination of GAG binding proteins together with cell penetrating peptides offers a promise of enhanced delivery of bioactive molecules. We show that the GET system’s enhanced transduction activity can be exploited to deliver functional concentrations of macromolecules including transcription factors inside cells, effectively using the cells themselves as sinks of the delivered molecule. With the ability to control the intracellular delivery of functional cargoes spatio-temporally, we believe that this approach will allow creation of gradients of multiple biologically active proteins to direct cellular behaviour. Ultimately understanding how to control the fate and programming of cells is key for creating successful regenerative medicine systems in three-dimensions.
6. Acknowledgments
24
acknowledge the expertise of Nichola Weston and Dr Michael Fay (Nottingham Nanotechnology and Nanoscience Centre; NNNC, University of Nottingham) for TEM expertise. We acknowledge the financial support from the Egyptian Ministry of Higher Education for PhD scholarship granted to H.M.M.A.E. The research leading to these results has received funding from the European Research Council under the European Community’s Seventh Framework Programme (FP7/2007-2013)/ERC grant agreement 227845. J.E.D and K.M.S acknowledge the support of the Medical Research Council, the Engineering and Physical Sciences Research Council, and the Biotechnology and Biological Sciences Research Council UK Regenerative Medicine Platform Hub “Acellular Approaches for Therapeutic Delivery” (MR/K026682/1).
7. Author Contributions. H.M.M.A.E, K.M.S and J.E.D conceived and initiated the project. H.M. M.A.E and J.E.D designed and performed experiments. J.E.D, J.Y and K.M.S supervised the project. H.M.M.A.E, K.M.S and J.E.D wrote the paper.
8. Competing Financial Interests. The authors declare no competing financial interests.
9. References
[1] Sant S, Hancock MJ, Donnelly JP, Iyer D, Khademhosseini A. Biomimetic Gradient Hydrogels for Tissue Engineering. The Canadian journal of chemical engineering 2010;88:899-911.
[2] Ashe HL, Briscoe J. The interpretation of morphogen gradients. Development 2006;133:385-94. [3] Nguyen EH, Schwartz MP, Murphy WL. Biomimetic approaches to control soluble concentration gradients in biomaterials. Macromolecular bioscience 2011;11:483-92.
[4] Wolpert L. One hundred years of positional information. Trends in genetics : TIG 1996;12:359-64. [5] Genzer J, Bhat RR. Surface-bound soft matter gradients. Langmuir : the ACS journal of surfaces and colloids 2008;24:2294-317.
25
[7] Cosson S, Lutolf MP. Hydrogel microfluidics for the patterning of pluripotent stem cells. Scientific reports 2014;4:4462.
[8] Shih MC, Tseng SH, Weng YS, Chu IM, Liu CH. A microfluidic device mimicking acinar concentration gradients across the liver acinus. Biomedical microdevices 2013;15:767-80.
[9] Wang X, Wenk E, Zhang X, Meinel L, Vunjak-Novakovic G, Kaplan DL. Growth factor gradients via microsphere delivery in biopolymer scaffolds for osteochondral tissue engineering. Journal of controlled release : official journal of the Controlled Release Society 2009;134:81-90.
[10] Guo X, Elliott CG, Li Z, Xu Y, Hamilton DW, Guan J. Creating 3D angiogenic growth factor gradients in fibrous constructs to guide fast angiogenesis. Biomacromolecules 2012;13:3262-71. [11] Suciati T, Howard D, Barry J, Everitt NM, Shakesheff KM, Rose FR. Zonal release of proteins within tissue engineering scaffolds. Journal of materials science Materials in medicine 2006;17:1049-56.
[12] Roam JL, Nguyen PK, Elbert DL. Controlled release and gradient formation of human glial-cell derived neurotrophic factor from heparinated poly(ethylene glycol) microsphere-based scaffolds. Biomaterials 2014;35:6473-81.
[13] Miller ED, Fisher GW, Weiss LE, Walker LM, Campbell PG. Dose-dependent cell growth in response to concentration modulated patterns of FGF-2 printed on fibrin. Biomaterials 2006;27:2213-21.
[14] Oh SH, Kim TH, Lee JH. Creating growth factor gradients in three dimensional porous matrix by centrifugation and surface immobilization. Biomaterials 2011;32:8254-60.
[15] Harris BP, Kutty JK, Fritz EW, Webb CK, Burg KJ, Metters AT. Photopatterned polymer brushes promoting cell adhesion gradients. Langmuir : the ACS journal of surfaces and colloids 2006;22:4467-71.
[16] Cao X, Shoichet MS. Defining the concentration gradient of nerve growth factor for guided neurite outgrowth. Neuroscience 2001;103:831-40.
[17] Knapp DM, Helou EF, Tranquillo RT. A fibrin or collagen gel assay for tissue cell chemotaxis: assessment of fibroblast chemotaxis to GRGDSP. Experimental cell research 1999;247:543-53. [18] Mahadik BP, Wheeler TD, Skertich LJ, Kenis PJ, Harley BA. Microfluidic generation of gradient hydrogels to modulate hematopoietic stem cell culture environment. Advanced healthcare materials 2014;3:449-58.
[19] Du F, Wang H, Zhao W, Li D, Kong D, Yang J, et al. Gradient nanofibrous chitosan/poly varepsilon-caprolactone scaffolds as extracellular microenvironments for vascular tissue engineering. Biomaterials 2012;33:762-70.
[20] Frank T, Tay S. Flow-switching allows independently programmable, extremely stable, high-throughput diffusion-based gradients. Lab on a chip 2013;13:1273-81.
[21] Odedra D, Chiu LL, Shoichet M, Radisic M. Endothelial cells guided by immobilized gradients of vascular endothelial growth factor on porous collagen scaffolds. Acta biomaterialia 2011;7:3027-35.
[22] Atencia J, Morrow J, Locascio LE. The microfluidic palette: a diffusive gradient generator with spatio-temporal control. Lab on a chip 2009;9:2707-14.
[23] Abhyankar VV, Lokuta MA, Huttenlocher A, Beebe DJ. Characterization of a membrane-based gradient generator for use in cell-signaling studies. Lab on a chip 2006;6:389-93.
[24] Griffith LG, Swartz MA. Capturing complex 3D tissue physiology in vitro. Nature reviews Molecular cell biology 2006;7:211-24.
[25] Dixon JE, Dick E, Rajamohan D, Shakesheff KM, Denning C. Directed differentiation of human embryonic stem cells to interrogate the cardiac gene regulatory network. Molecular therapy : the journal of the American Society of Gene Therapy 2011;19:1695-703.
[26] Dixon JE, Osman G, Morris GE, Markides H, Rotherham M, Bayoussef Z, et al. Highly efficient delivery of functional cargoes by the synergistic effect of GAG binding motifs and cell-penetrating peptides. Proceedings of the National Academy of Sciences of the United States of America 2016;113:E291-9.
[27] Copolovici DM, Langel K, Eriste E, Langel U. Cell-penetrating peptides: design, synthesis, and applications. ACS nano 2014;8:1972-94.
26
[29] Erazo-Oliveras A, Najjar K, Dayani L, Wang TY, Johnson GA, Pellois JP. Protein delivery into live cells by incubation with an endosomolytic agent. Nature methods 2014;11:861-7.
[30] Dolgilevich S, Zaidi N, Song J, Abe E, Moonga BS, Sun L. Transduction of TAT fusion proteins into osteoclasts and osteoblasts. Biochemical and biophysical research communications 2002;299:505-9.
[31] Park HJ, Shin J, Kim J, Cho SW. Nonviral delivery for reprogramming to pluripotency and differentiation. Archives of pharmacal research 2014;37:107-19.
[32] Wong FK, Haffner C, Huttner WB, Taverna E. Microinjection of membrane-impermeable molecules into single neural stem cells in brain tissue. Nature protocols 2014;9:1170-82.
[33] Joliot A, Prochiantz A. Transduction peptides: from technology to physiology. Nature cell biology 2004;6:189-96.
[34] Frankel AD, Pabo CO. Cellular uptake of the tat protein from human immunodeficiency virus. Cell 1988;55:1189-93.
[35] Green M, Loewenstein PM. Autonomous functional domains of chemically synthesized human immunodeficiency virus tat trans-activator protein. Cell 1988;55:1179-88.
[36] Walther F, Davydovskaya P, Zucher S, Kaiser M, Herberg H, Gigler AM, et al. Stability of the hydrophilic behavior of oxygen plasma activated SU-8. Journal of Micromechanics and Microengineering 2007;17:524-31.
[37] Yu R, Graf J, Smets BF. An improved cell recovery method for iron oxidizing bacterial (IOB) enrichments. Journal of microbiological methods 2008;72:235-40.
[38] Peters SR. A practical guide to frozen section technique. New York: Springer; 2010.
[39] Parmenter CD, Fay MW, Hartfield C, Eltaher HM. Making the practically impossible "Merely difficult"-Cryogenic FIB lift-out for "Damage free" soft matter imaging. Microscopy research and technique 2016.
[40] LP. K. Isoelectric Point Calculator. . 2007-2013.
[41] Foxman EF, Campbell JJ, Butcher EC. Multistep navigation and the combinatorial control of leukocyte chemotaxis. The Journal of cell biology 1997;139:1349-60.
[42] Phillips JE, Burns KL, Le Doux JM, Guldberg RE, Garcia AJ. Engineering graded tissue interfaces. Proceedings of the National Academy of Sciences of the United States of America 2008;105:12170-5.
[43] Lieleg O, Ribbeck K. Biological hydrogels as selective diffusion barriers. Trends in cell biology 2011;21:543-51.
[44] Bhat S, Tripathi A, Kumar A. Supermacroprous chitosan-agarose-gelatin cryogels: in vitro characterization and in vivo assessment for cartilage tissue engineering. Journal of the Royal Society, Interface / the Royal Society 2011;8:540-54.
[45] America GMIo. Standard Methods for the Sampling and Testing of Gelatins: Gelatins manufacturing Institute of America.
[46] Griess GA, Moreno ET, Easom RA, Serwer P. The sieving of spheres during agarose gel electrophoresis: quantitation and modeling. Biopolymers 1989;28:1475-84.
[47] Muroya S, Nakajima I, Oe M, Chikuni K. Effect of phase limited inhibition of MyoD expression on the terminal differentiation of bovine myoblasts: no alteration of Myf5 or myogenin expression. Development, growth & differentiation 2005;47:483-92.
[48] Seidi A, Ramalingam M, Elloumi-Hannachi I, Ostrovidov S, Khademhosseini A. Gradient biomaterials for soft-to-hard interface tissue engineering. Acta biomaterialia 2011;7:1441-51.
28
Figure 1. Testing of compartmentalized diffusion using the engineered
29
Figure 2. Non-transducing mRFP1 diffuses to equilibrium in acellular or
[image:31.595.88.515.77.424.2]30
Figure 3. Efficiently transducing P21-mR-8R maintains a gradient profile in
[image:32.595.87.511.111.442.2]31
Figure 4. Temporal assessment of gradients of transduction using
[image:33.595.79.453.77.516.2]32
Figure 5. Intracellular transduction gradient profiles following control,
non-transducing (mRFP1), cell binding (P21-mR), CPP-tagged (mR-8R) and
enhanced transducing GET (P21-mR-8R) protein diffusion through cellular
[image:34.595.92.493.78.320.2]34
Figure 6. Gradients of fluorescence intensity in cells as a function of distance
36
Figure 7. Relative myogenic gene expression as a function of distance away
from source using GET-MyoD gradients. A) Schematic of GET-MyoD recombinant proteins used in diffusion studies. B) Relative gene expression of P21-mR-MyoD-8R dose-treatments of HEK293T cells (200,000) over 72h cultured as a monolayer. C) GET-MyoD dosing of HEK293T cells (2x10⁶ /mL) over 72h cultured in GA hydrogel. D) GET-MyoD gradients in GA hydrogels. 60 µg/mL P21-mR-MyoD-8R diffused across cellular HEK293T (2x10⁶ /mL) GA scaffolds for 72h. Myogenic differentiation was evaluated based on the fold increase in MYOD, MYOGENIN, DESMIN and
37 Supplementary Materials
11. Supplementary Methods
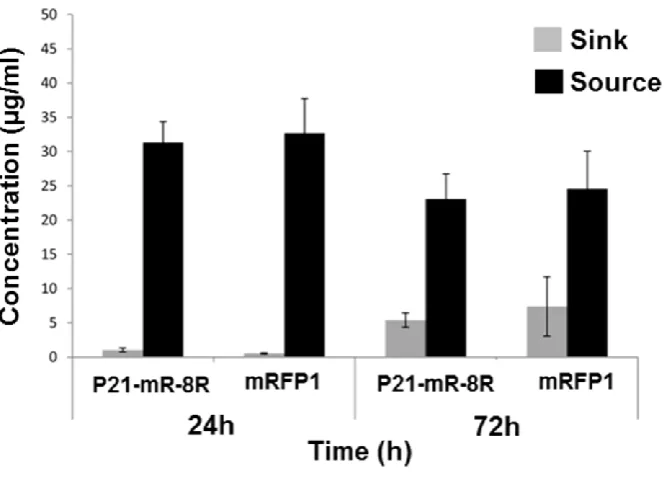
11.1. Temporal monitoring of source/sink protein concentrations
The source and sink compartments of the compartmentalized diffusion model described above were continuously monitored for protein concentrations. This was done to ensure the perfect seal of the middle hydrogel compartment to the base of the mould. No leakage was observed in the proposed model. This was proven by the relatively high proportion of source to sink protein concentrations at day one that started to decrease as more proteins diffused through the hydrogel out to the sink compartments on day three as shown in Figure S1.
11.2. Determination of proteins diffusion coefficients and equilibrium
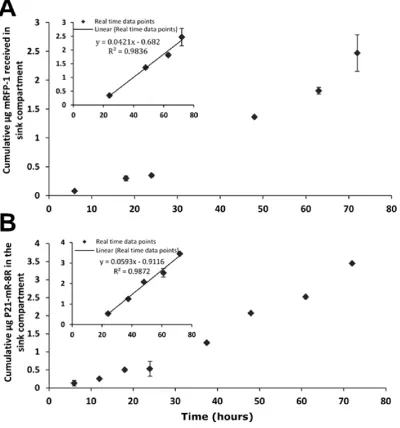
The diffusion coefficients of mRFP1 and P21-mR-8R across GA hydrogels were determined using the model permeation method. The method was extensively described in Cao and Shoichet [16]. Diffusion studies of mRFP1 and P21-mR-8R in the compartmentalized diffusion model were conducted in acellular hydrogel scaffolds. At different time points, aliquots of the sink compartments (triplicate for each time point) were analysed for the protein concentrations from which a cumulative mass of protein versus time curve was established (Error! Reference source not found.). The data points on the curve, after achievement of steady state concentrations (24 hours), were fitted using linear regression. The equation developed was then solved for the diffusion coefficients of the different proteins according to Error! Reference source not found. where mi is the mass of proteins received in the sink compartment; Pi is the permeability of protein in the hydrogel, Cdi
is the initial concentration of the source compartment, L is the thickness of the hydrogel membrane and Di is the diffusion coefficient of proteins in the hydrogel system. From which, the diffusion coefficients of mRFP1 and P21-mR-8R can be calculated to be 7.15x10⁻⁷ & 7.53x10⁻⁷ cm2/s respectively.
The membrane permeation model assumes that if:
38
(iii) the hydrogel scaffold is initially at zero concentration
The total amount of the diffusing solute that passed through the membrane varies with time according to the following relation:
𝒎𝒊= 𝑷𝒊𝑪𝒅𝒊/𝑳(𝒕 − 𝑳𝟐 𝟔𝑫𝒊)
where mi is the mass of proteins received in the sink compartment; Pi is the permeability of protein in the hydrogel, Cdi is the initial concentration of the source compartment, L is the thickness of the hydrogel membrane and Di is the diffusion coefficient of proteins in the hydrogel system. A plot of m versus time from this equation is a straight line (once steady state is established) with a time-axis intercept of L2/6Di, from which Di is calculated.
39
11.3. Expression and Purification of Recombinant Proteins
40 2. Supplementary Figure Legends
[image:42.595.90.454.172.509.2]41
15×5×6.6 mm (Length × Width × Height) dimensions cast in the middle of the
[image:43.595.110.494.144.628.2]chambers.
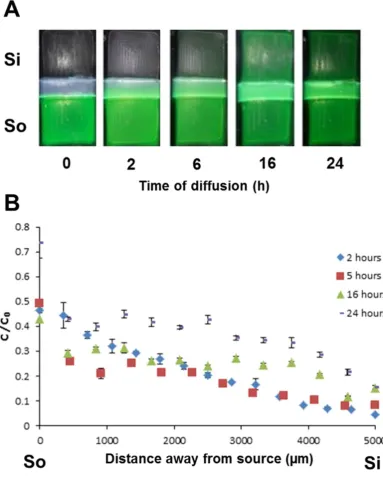
Figure S2. Faithful diffusion of Fluorescein using the ARM compartmentalized
42
[image:44.595.84.521.204.655.2](Length × Width × Height) dimensions with Fluorescein diffusing from the Source (So) compartment through the hydrogel scaffold at 0, 2, 6, 16 and 24 hours. B) The corresponding concentration profiles assessed as C/C0 as a function of distance away from the source (n=3).
43
up (% is w/v) and A. viability assessed over 3 days using Live/Dead cytotoxicity assay B. Metabolic activity assessed over 3 days using Presto® blue assay. Data was normalised to a monolayer control. (n=3, bars are standard deviation). ** p<0.01 for day 2, * p<0.05 for day 1.
Figure S4. Determination of the characteristic features of GA hydrogels and
[image:45.595.77.514.204.373.2]46
48
49
Figure S7. Monitoring of protein concentrations in the source and sink
[image:51.595.87.420.83.322.2]50
Figure S8. Calculation of the diffusion coefficient of mRFP1 and P21-mR-8R in
51
Figure S9. Flow cytometry showing gradients of fluorescence intensity in cells
52
Figure S10. Image analyses of pixel mean and standard deviation for mRFP1
[image:54.595.87.518.80.344.2]54
Figure S11. Efficiently transducing GET-MyoD maintains a gradient profile in
55
Figure S12. Calculation of the diffusion coefficient of GET-MyoD
[image:57.595.80.492.82.325.2]56
Table S1. Calculation of Spearman’s Rank correlation coefficient for acellular
and cellular GA hydrogels for mRFP1 or P21-mR-8R gradients at 72 hours.
Details of the calculation are described in supplemental methods.
Equation 1. Determination of the diffusion coefficient of protein
[image:58.595.77.524.83.206.2]