Accepted Manuscript
Risk Taking and Information Aggregation in Groups
Spiros Bougheas, Jeroen Nieboer, Martin Sefton
PII: S0167-4870(15)00099-9
DOI: http://dx.doi.org/10.1016/j.joep.2015.08.001
Reference: JOEP 1845
To appear in: Journal of Economic Psychology Received Date: 3 July 2014
Revised Date: 24 April 2015 Accepted Date: 5 August 2015
Please cite this article as: Bougheas, S., Nieboer, J., Sefton, M., Risk Taking and Information Aggregation in Groups,
Journal of Economic Psychology (2015), doi: http://dx.doi.org/10.1016/j.joep.2015.08.001
1
Risk Taking and Information Aggregation in Groups
by
Spiros Bougheas*, Jeroen Nieboer** and Martin Sefton***
April 22, 2015
We report a controlled laboratory experiment examining risk-taking and information aggregation in groups facing a common risk. The experiment allows us to examine how subjects respond to new information, in the form of both privately observed signals and signals reported from others. We find that a considerable number of subjects exhibit ‘reverse confirmation bias’: they place less weight on information from others that agrees with their private signal and more weight on conflicting information. We also find a striking degree of consensus when subjects make decisions on behalf of the group under a random dictatorship procedure. Reverse confirmation bias and the incidence of consensus are considerably reduced when group members can share signals but not communicate.
Keywords: Group behavior; Teams; Decision Making; Risk; Experiment
PsycINFO Classification codes: 2300, 3020
JEL Classification codes: C91, C92, D71, D80
Acknowledgements
We have received helpful comments from Chris Starmer, Matthias Sutter, Bianca Bonollo, Zhihua Zhang, participants at the 2010 CCC meeting at the University of Amsterdam and at the 2010 ESA World Economic meeting at the University of Copenhagen. We also thank the associate editor and two anonymous reviewers for detailed comments. The research was funded by the University of Nottingham and a British Academy Small Research Grant (award number SG-100815); we gratefully acknowledge this support. Jeroen Nieboer acknowledges funding from the ESRC (ES/H014691/1); Martin Sefton acknowledges the support of the ESRC-funded Network for Integrated Behavioural Science (ES/K002201/1).
*School of Economics, University of Nottingham, University Park, Nottingham, NG7 2RD, United Kingdom.
E-mail: [email protected]
** Corresponding author. Department of Social Policy, London School of Economics and Political Science,
Houghton Street, London, WC2A 2AE, United Kingdom. E-mail: [email protected]
***School of Economics, University of Nottingham, University Park, Nottingham, NG7 2RD, United Kingdom.
2
Risk Taking and Information Aggregation in Groups
1. Introduction
One of the key functions of deliberating groups is the bringing together of people who have independently obtained information on a common risk. When such groups effectively aggregate information from different members, this allows the members to respond better to the risk. But is this a faithful representation of how people share and process information in groups? How do people actually use information received from others? We present a controlled laboratory experiment that investigates this question with respect to decisions under risk over monetary earnings.
Previous economic experiments on group decision-making under risk show that when all members of a group have the same probabilistic information, group decisions often differ from what group members would have decided individually. We extend this literature by focusing on an experimental setting where each group member has private prior information about a common risk. In such a setting individual group members can benefit from updating these priors using information conveyed through group interaction. Previous research has shown that individuals often update priors in a way that is incompatible with Bayesian updating (see Camerer, 1995 for a review). Moreover, an extensive literature in social psychology documents important group effects in the way individuals process information obtained from group deliberation (e.g. Stoner, 1961; Moscovici and Zavalloni, 1969). An important distinction between our design and this literature is that we introduce heterogeneous information in a controlled fashion. In this controlled laboratory environment, we investigate how private information is aggregated to influence individual decisions and how an individual decides on behalf of a group.
3
the treatment. In our COMM treatment, subjects communicate with fellow group members through unrestricted free-form electronic chat; in our NO-COMM treatment, subjects interact only by reporting their private signals to fellow group members. Finally, in stage IV subjects make decisions based on the same information they had in stage III, but this time a subject’s decision is a purely individual decision, i.e. it is not observed by other subjects and it cannot affect their payoffs.
Controlling for the probabilistic information that subjects receive in various stages allows us to measure how strongly their preferred choice under risk responds to this information. We are particularly interested in whether subjects’ response depends on the source of information: a privately observed signal or information provided by a fellow group member. Comparing decisions in stages I and II allows us to observe how subjects react to privately observed signals, while comparing individual choices from stages II and IV allow us to examine how subjects respond to information received from others.
Finally, choices from stages III and IV allow us to compare choices on behalf of the group with choices on behalf of oneself. In stage III, when subjects decide on behalf of their group, we do not force them to reach a consensus with others. Instead, we use a random dictatorship procedure, which incentivizes subjects to reveal their own preferred level of risk-taking for the group. This procedure delivers easily interpretable “group choices” made by individual subjects and has the advantage of eliminating strategic considerations associated with other group decision-making processes.1
We find that subjects generally respond intuitively to information they receive privately. Subjects also readily share their signals with their group – there is no systematic evidence of strategic reporting. We cannot reject the hypothesis that many of our subjects act in line with rational Bayesian updating. Note that with Bayesian updating we refer here to the joint hypothesis of fully trusting signals reported by other players and using this information to update one’s priors. For subjects who receive two conflicting signals from fellow group members, we find that about half of subjects leaves their decision under risk unchanged. This is in line with taking the reports at face value and updating subjective beliefs using Bayes’ rule. However, the
1 Our random dictatorship procedure may also reduce the disproportionate influence of group members with
4
other half of the subjects who receive two conflicting signals change their decision. This may reflect a violation of rational Bayesian updating, or it may reflect a mistrust in the signal reports of others. Interestingly, when subjects can freely communicate (treatment COMM), we see a systematic bias towards changing one’s decision away from the direction predicted by their private signal. We refer to this behavior as ‘reverse confirmation bias’. Without free-form communication (treatment NO-COMM), changes in risk taking are equally likely to occur in either direction.
We also find treatment differences in the group decision-making stage. In the COMM treatment, the majority of the subjects make the same decision as fellow group members. This degree of consensus is remarkable given the absence of any monetary or reputational incentives for reaching consensus. In the final stage, approximately half of the subjects make the same choice that they made in the group-decision making stage. This pattern of decisions is consistent with the explanation of consensus at the group stage as driven by persuasive arguments by peer subjects. However, given that half of the subjects make different choices in these stages we cannot exclude that social preferences over risk play a role.
The remainder of the paper is organized as follows. In the following section we review related studies in psychology and economics. In section 3 we describe our experiment and in section 4 we present our results. We conclude in section 5.
2. Related Literature
2.1. Information Aggregation
Both economists and psychologists have investigated the question of how groups aggregate information. Theories of information aggregation go back at least as far as the famous jury theorem of Condorcet (1785). Recent theoretical contributions to the literature on committee voting by Austen-Smith and Banks (1996) and Feddersen and Pesendorfer (1998) show that incentives to vote strategically can lead to group members voting against their private information, thus hampering efficient information aggregation.2 Experiments in this paradigm confirm the occurrence of strategic voting (Guarnaschelli et al., 2000; Ali et al., 2008),
2 This result is reminiscent of the literature on herding and information cascades, in which the decision-maker may
5
although this is less of a concern when group members can communicate (Goeree and Yariv, 2011).
Experimental evidence from social psychology suggests that group interaction often leads to decisions that are extreme compared to the preferences of individual group members. Group interaction may produce choice shifts (Stoner, 1961) or group polarization (Moscovici and Zavalloni, 1969). The way in which groups aggregate information, specifically the persuasiveness of certain arguments, can play an important role in this process (Vinokur and Burstein, 1974). More recently, Glaeser and Sunstein (2009) and Sobel (2014) theoretically investigate the group polarization phenomenon in the framework of Bayesian rationality, demonstrating that both Bayesian and non-Bayesian rational behavior can explain extreme outcomes in groups. These approaches have the advantage that they quantify the strength (in probabilistic terms) of pieces of information, which allows for precise predictions of behavior. Our experiment also follows this approach.
Bayesian-rational models of group interaction like Sobel’s (2014) typically assume that groups efficiently aggregate probabilistic information held by their members, but, as argued by Glaeser and Sunstein (2009), this assumption may often not be warranted. Sure enough, experimental evidence suggests that groups are better than individuals at using probabilistic information when the group receives this information exogenously as a collective (see Blinder and Morgan, 2005; Charness et al., 2007).3 But, outside the literature on committee voting discussed earlier, decision-making based on endogenous information sharing in groups has received little attention. A key question is how people weight information depending on how they obtained it. McKelvey and Page (1990) present an experiment in which subjects receive private information in the first round of the experiment, followed by public information with which to update their beliefs in subsequent rounds. Although subjects do use the public information provided to adjust their beliefs, they are slow to update their beliefs away from their private information. Given that the experimental design ensures that both types of information have the same strength, private information is thus relatively overweighted.
3 Note that groups are ‘better’ than individuals in the sense that they obtain higher pay-offs in a task that rewards
6
One way of interpreting the results of McKelvey and Page is as a manifestation of confirmation bias, the “seeking or interpreting of evidence in ways that are partial to existing beliefs, expectations, or a hypothesis in hand” (Nickerson, 1998, p. 175). In McKelvey and Page’s experiment, existing beliefs may be shaped by the source of the information (e.g. private versus public) or by the order in which information is delivered (e.g. earlier versus later). First, evidence from psychology experiments on information sharing in groups suggests that commonly known information is more persuasive than private information in group discussions, but that private information is rated more highly if it is known to the decision maker prior to the discussion instead of learned from a fellow group member (Van Swol, 2007; Van Swol et al., 2003). A second factor is the order in which information is received. Most of the evidence from experiments on probabilistic information supports the existence of a primacy effect (in line with confirmation bias): probabilistic information received earlier has a bigger impact on beliefs than information received later (Hoch, 1984; Peterson and Ducharme, 1967; Pitz, 1969; although note the opposite recency effect reported in Hertwig et al., 2004). The effect of early information appears to be stronger when people make a decision after receiving the early information, instead of continuing to parse the information (Jonas et al., 2001). Finally, groups seem to place the same importance on early information as individuals do (Mancuso et al., 2014; Schulz-Hardt et al., 2001).
2.2. Decisions under Risk in Social Contexts
7
It should be noted that both sets of findings are consistent with groups making choices more in line with risk neutrality than individuals. Finally, three experimental studies that use a group voting mechanism and the Holt-Laury task report more mixed results. Masclet et al. (2009) find that groups, deciding by multiple-round unanimous vote, are more risk averse than individuals. Zhang and Casari (2012) use a communication stage followed by three rounds of unanimous voting; they report that group choices are more risk neutral than individuals’ choices. Harrison et al. (2013) use a simple majority vote and find no difference between groups and individuals.
The second strand of experimental literature on decision-making in social contexts suggests that people are often influenced by the choices of their peers. The direction of such peer effects seems to depend on the experimental context. Yechiam et al. (2008) report an experiment in which mutual real-time observation between two individuals whilst making choices under risk leads to higher risk taking. In a multi-period design with feedback on peer choices, Cooper and Rege (2011) find that subjects are significantly more likely to change their preferred level of risk taking if it deviates from the majority choice of peers. Lahno and Serra-Garcia (2012) also find evidence of peer effects on binary individual choices under risk. Finally, Bougheas et al. (2013) report significant convergence in the risk taking of individuals when they are allowed to freely communicate with each other about an individual decision under risk.
3. The Experiment
We begin by describing our experimental design and procedures in section 3.1, before discussing some key features of this design and the hypotheses it enables us to address in section 3.2.
3.1 Experimental Design and Procedures
8
At the start of a session, subjects were randomly assigned a seat in the laboratory. They then received instructions, which were also read out loud by an experimenter.4 Subjects were informed that there would be four stages and their earnings would be based on decisions in one of the four stages, to be picked at random. To make this random selection process completely transparent, the experimenter asked a volunteer subject to publicly perform a double-blind draw from a set of four playing cards (Ace, Two, Three and Four – shown to all subjects in advance of the draw) and put the selected card in a box in a publicly visible place. The card was retrieved and displayed to the subjects at the end of the session. Similarly, subjects were informed that earnings in a stage would depend on which of two states of the world is realized. Again, the experimenter asked a volunteer to perform a double-blind draw to select one of the states. Specifically, subjects were shown two sets of cards: set A (henceforth ‘the bad state’) consisted of two red Aces of Hearts and one Ace of Spades while set B (henceforth ‘the good state’) consisted of two Aces of Spades and one Ace of Hearts. The sets were placed in identical packs that were put into an empty bag for selection by the volunteer subject. At the end of the experiment subjects were shown the entire contents of the selected pack and so learned whether the state of the world was good or bad.
Subjects then received specific instructions for each stage in turn. Throughout the experiment subjects were not allowed to communicate with one another, except in Stage III as described below, and all choices were submitted in private via the software.
In each stage subjects make an investment choice about how much of a £10 endowment to invest. In the bad state the subject loses her investment and in the good state she gets a positive return. The returns are given in Table 1.5 We thus have a non-linear version of the investment task introduced in Potters and Gneezy (1997) with a discrete choice set of 11 options.
[ Table 1 here ]
4 The experimental software was programmed in z-Tree (Fischbacher, 2007). The experimental instructions are
reproduced in the appendix.
5 In the experiment we used a neutral frame that does not refer to investments, endowments, losses or gains, but
9
In stage I subjects choose from the options listed in Table 1, only knowing that the two states of the world are equally likely to have been selected. The amounts in the table are constructed so that the optimal investment is £5 for a risk-neutral subject, leaving room for such a subject to increase or decrease her investment as she receives information about the state of the world.
At the beginning of stage II each subject receives a private signal s ∈ {good, bad}, where Pr{good signal | good state} = Pr{bad signal | bad state} = 2/3. The signal was thus informative about the true state of the world. This signal was implemented by allowing each subject to draw a card (with replacement) from the selected set. A draw of a black (red) card corresponds to receiving a good (bad) signal. Subjects then make another choice from the options listed in Table 1.
Stage III starts with the random formation of groups of three subjects by the experimental software. Subjects are told about the groups and that they can anonymously interact with the two other group members, although the type of interaction depends on the experimental treatment. In treatment COMM, group members can communicate freely using an electronic chat box on their screen. During the chat subjects can, if they want, report their individual signals to others in the group. In treatment NO-COMM, subjects can only report a signal to others – there is no other way of communicating to others. Subjects are reminded of their private signal and are asked to report a signal to others. They are aware that the software will display their reported signal to the others in the group.
After the group interaction, each subject chooses again from the options listed in Table 1. These decisions are made on behalf of the group and are implemented by a ‘random dictatorship’ procedure: in each group one of the group members’ decisions is randomly chosen to be the one that is relevant for all three group members. At the end of this stage all group members are informed of the three choices and which one is implemented.
In stage IV each subject makes a final investment decision, again by choosing from the options in Table 1. Like the decisions in stages I and II, this is a purely individual decision: it is not observed by other subjects and it only affects the decision-maker.
10 3.2 Hypotheses
3.2.1. Individual Decisions
In stage I, subjects make individual investment choices where the state of the world is equally likely to be good or bad. Choices from this stage thus give us a measure of individual subjects’ willingness to take risk.
In stages II and III, subjects receive information about the true state of the world. In general, after receiving g good signals and b bad signals, rational Bayesian updating implies that the probability of the good state is given by
Pr{good state | b, g} = Pr{b, g | good state} × Pr{good state} / Pr{b, g} = 1/(1 + 2b – g).
Note that in our design this probability only depends on the difference between the number of bad and good signals. Note also that the use of this formula implies that all signals are taken at face value (i.e. subjects trust that others report their signals truthfully).
Thus, Bayesian updating in stage II implies that a subject receiving a good signal updates her subjective probability of the good state from 1/2 to 2/3, while a subject receiving a bad signal updates her subjective probability of the good state from 1/2 to 1/3. The behavioral prediction in line with Bayesian updating is that subjects who receive a good (bad) signal will keep constant or increase (decrease) their investment.
In stages III and IV, individuals may use information on private signals obtained from the group interaction in stage III. Assuming that group members truthfully report their private signal and this is common knowledge, Bayesian updating implies that the subjective probability that a subject attaches to the good state is given by
11
We use these probabilities to generate a set of predictions for investment in stage IV (the final individual decision) relative to stage II. As before, the prediction of decision-making consistent with Bayesian updating is that those subjects for whom the probability of the good state increases (decreases) will keep constant or increase (decrease) their investment from stage II to IV.
Note that the probabilities of the good state in groups with mixed signals are the same as the probabilities of the good state after a single signal (Pr{good state|g=0, b = 1}= Pr{good state| g=1, b = 2}=1/3, and Pr{good state|g=1, b = 0}= Pr{good state| g=2, b = 1}=2/3). For two out of three members of such groups, the subjective probability of the good state will not change between stages II and IV: the conflicting signals they receive from fellow group members effectively cancel each other out. If subjects were instead prone to confirmation bias, they interpret two conflicting signals in a different way. According to confirmation bias, a subject places more weight on new evidence that confirms her own. As a consequence, a subject with a good (bad) signal who receives conflicting good and bad signal reports from her fellow group members will not regard these as cancelling out, but instead will overweight the good (bad) signal report, increase (decrease) her subjective probability that the state is good and adjust her investment accordingly. Thus, while decision-making consistent with Bayesian updating does not predict any systematic change of behavior after receiving conflicting signals, confirmation bias does.6
3.2.2. Group Decisions
In stage III, one group member’s decision is randomly selected to be the one that is relevant for all three group members. Our use of this random dictatorship procedure implies that each group member has an incentive to truthfully reveal her preferred investment choice for the group. Note that this procedure does not force group members to compromise or reach
6 As noted earlier, our Bayesian updating predictions assume that subjects believe that others report their signals
12
consensus. Nor does it imply that a subject should make the same decision that she would if she were the only affected party.
However, there are two reasons why consensus might emerge in stage III of our COMM treatment. First, it may reflect that subjects have other-regarding concerns and prefer compromise rather than forcing their own preferences on others. Second, subjects may be persuaded by the discussion during the stage that a particular investment choice is actually preferable from an individual perspective.
In order to see how far stage III decisions depart from the decision that an individual would make if she were making that decision in isolation (i.e when her decision is not observed by others and does not affect others), we also have subjects make individual, isolated, decisions in stage IV. Notice that subjects have precisely the same information as in stage III, but their decision will only affect themselves. If a subject makes different decisions in stages III and IV this suggests that their stage III decisions reflect some form of social preferences over risk. Another possible effect of group deliberation is persuasion: subjects’ level of risk-taking in stage IV may be influenced by persuasive arguments from fellow group members in stage III, in which case subjects’ individual decisions in stage IV will be shaped by the decisions made in stage III. Such a result would be in line with the findings of Sutter (2009), who finds that deciding as part of a group leads subjects to increase their risk taking compared to individual decisions taken before group membership, without reverting to lower risk taking in individual decisions afterwards.
Notice that there are two differences between stages III and IV of our COMM treatment. One is that subjects make decisions for the group in stage III and for themselves in stage IV. The other is that they communicate freely with other group members in stage III. Our NO-COMM treatment controls for the effect of communication.
4. Results
4.1 Information and Individual Investments
13
COMM and NO-COMM treatments.7 Figure 1 shows the distribution of investment decisions in stage I (upper panel) and stage 2, conditional on the private signal received (two bottom panels). In stage I, about 20% of subjects make a choice consistent with risk-neutrality and invest £5, and a similar percentage make an extremely risk averse choice investing nothing to guarantee £10. There is considerable heterogeneity, and the majority of subjects display risk aversion. In stage II, subjects with good signals tend to invest more than subjects with bad signals, but again, for both signal types there is considerable heterogeneity.
[ Figure 1 here ]
If we look at how individuals react to their signals we see that the majority of subjects respond in an intuitive way. Figure 2 shows that subjects tend to increase their investment in response to a good signal or decrease it in response to a bad signal.8 However, some subjects do not respond as much as Bayesian rationality would suggest. Indeed, 63 of 180 subjects did not change their investment choice.
[ Figure 2 here ]
Further analysis of how subjects react to new information can be based on comparing stage II and stage IV decisions, since in stage IV subjects will have new information from the stage III group interaction. Assuming that efficient information aggregation takes place, e.g. if subjects report signals truthfully and believe the reports of others, this new information gives each subject three independent signals on the state of the world. Although our design does not enforce truthful reporting and allows subjects to misreport or withhold signals we find that the vast majority of the subjects truthfully report their signals.9
7 The experimental procedures and instructions are identical up to stage III, and subjects are not given instructions
for stage III until after they have completed stage II. However, a considerable time elapsed between conducting the treatments and so we tested for the legitimacy of pooling. Using two-tailed Mann-Whitney U tests we fail to find any significant treatment differences between the treatments in these stages: p = 0.5408 (stage I), p = 0.7068 (stage II conditional on a bad signal) and p = 0.2674 (stage II conditional on a good signal).
8 Only 12 of 180 subjects modified their behavior in the opposite way.
9 In the COMM treatment there is one group where a member claims that there is “no point discussing what
14
Figure 3 shows how subjects who received two new identical signals react to this new information. Here we present the data from the two treatments separately. The picture in both treatments is similar. Subjects receiving two new bad signals should decrease (or at least not increase) investments relative to stage II, based on a higher posterior probability of the bad state occurring. Only 3 of 27 (COMM) and 3 of 45 (NO- COMM) subjects reacted in a contrarian manner. Analogously, subjects receiving two new good signals should increase (or at least not decrease) investments. Only 3 of 20 (COMM) and 2 of 13 (NO-COMM) subjects reacted in a contrarian manner. Thus, although we cannot rule out that some subjects discount others’ signals to some extent, the majority of subjects react to new information in an intuitive way.
[ Figure 3 here ]
4.2 Bayesian Rationality versus Confirmation Bias
So far, we have only considered situations in which Bayesian rationality and confirmation bias cannot be separated as explanations of increasing or decreasing risk-taking across stages of our experiment. But when subjects receive conflicting signals from their fellow group members, the predictions differ. According to Bayesian updating, a subject receiving one good and one bad signal should not alter her level of investment. By contrast, confirmation bias stipulates that a signal received from a fellow group member is given more weight if it confirms the subject’s private signal. If those with a good (bad) private signal increase (decrease) their investment in stage IV relative to stage II, this means that subjects display confirmation bias.
Consistent with Bayesian rationality 14 of 34 (COMM) and 15 of 32 (NO-COMM) subjects make the same choice in stages II and IV. However, most subjects change their investments. Figure 4 compares investment decisions for those subjects receiving conflicting signals from their fellow group members, with the left (right) panels showing decisions of subjects with bad (good) private signals, and the top (bottom) panels showing data from the COMM (NO-COMM) treatments.
15
[ Figure 4 here ]
In the COMM treatment (top panels), when subjects are allowed to communicate in stage III, we see that those with a bad private signal tend to increase their investment, whereas in the right panel we see that those with a good private signal tend to decrease their investment. Of the 20 subjects who change investments 5 adjust in the direction predicted by confirmation bias and 15 adjust in the opposite direction. Thus more subjects exhibit reverse confirmation
bias than confirmation bias or Bayesian rationality. The bottom two panels refer to the
NO-COMM treatment and show a slightly different picture: 9 subjects adjust in the direction predicted by confirmation bias and 8 in the opposite direction. Thus removing the opportunity to communicate appears to reduce the incidence of reverse confirmation bias.
For a formal test of whether there is a systematic change in the direction predicted by confirmation bias we measure the change in investment as the stage IV decision minus the stage II decision for subjects with good signals, and the stage II decision minus the stage IV decision for subjects with bad signals. Bayesian updating implies that these changes should be zero, whereas confirmation bias implies positive changes. A two-tailed Mann-Whitney sign-rank test of the pooled data rejects the hypothesis that the median change is zero for the COMM treatment (n = 34, p = 0.0286), but not for the NO-COMM treatment (n = 32, p = 0.8497). Thus the deviations from Bayesian rationality are systematic in the COMM treatment, but evidently this is because there is a tendency for changes away from one’s own signal, i.e. reverse confirmation bias.10
4.3 Group Effects
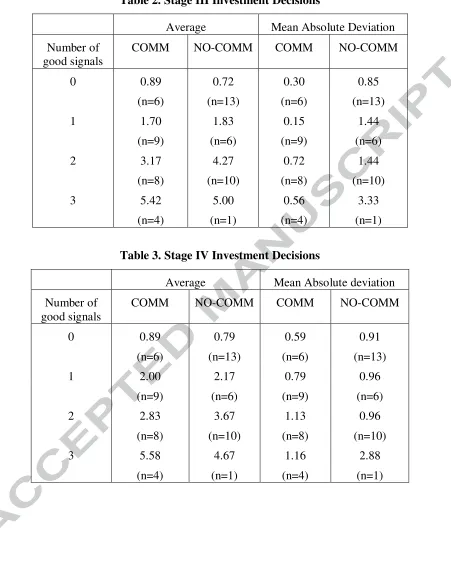
At the beginning of stage III subjects receive new information about the state of the world from their fellow group members. They then make an investment decision and one group member’s choice is randomly selected to implement the group decision. For each group we calculate the average investment decision and, as a measure of within-group variability in investment decisions, the mean absolute deviation from the average of the three investment
10 The test assumes the changes in investment decisions are independent across the subjects who received conflicting
16
decisions. Table 2 reports the averages of these measures across groups for each signal profile and treatment.
[Table 2 here]
While the average level of risk-taking increases monotonically with the number of good signals, there is no consistent treatment effect. Thus, communication does not have a systematic effect on levels of risk-taking. However, within-group variability is lower in the COMM treatment for any signal profile.11 The low within-group variability in the COMM treatment is due to a striking degree of consensus within groups. Indeed, in 14 out of 27 groups all three group members submitted an identical decision. By comparison, in the NO-COMM treatment consensus was observed in only 6 of 30 groups.
Communication may lead to consensus in group decision making via two alternative mechanisms. First, decisions may reflect social preferences over risk, whereby subjects make choices that they would not make in an individual decision-making context. For example, subjects may prefer to conform, driven by pressure from peers or a concern for the risk preferences of other group members. Second, decisions may be the result of persuasive arguments, whereby subjects are influenced by the group discussion and may reflect an agreement on what is the preferable option. By examining decisions in stage IV we can examine the influence of these two mechanisms. If consensus in stage III decisions only reflects social preferences over risk we would expect subjects’ decisions in stage III and stage IV to differ. If subjects were persuaded by fellow group members that a particular decision is preferable then we would expect subjects to choose similar levels of risk-taking in stages III and IV.
Before comparing stages, we first present investment decisions from stage IV in Table 3. Analogously to Table 2, we present average investments and the average within-group variability of investments across groups with a given signal profile.12 As with stage III, investment levels are not significantly different across treatments (two-tailed Mann-Whitney
11 For statistical treatment comparisons we use two-tailed Mann-Whitney U tests using the group as the unit of
observation. Note that some of these comparisons are based on very few observations. Nevertheless, we find no significant treatment differences in the level of investment for any signal profile (p>0.1 in all comparisons), while we do find significant differences in the within-group variability (p=0.0087 in the case of one good signal and p = 0.0598 in the case of two good signals).
12 To be clear, subjects are making individual decisions in stage IV without any group interaction, but we measure
17
U tests, p > 0.1 for all signal profiles). In contrast to stage III however, we find no treatment effect with regard to within-group variability (p > 0.1 for all signal profiles).
[Table 3 here]
For comparing Tables 2 and 3 we use Wilcoxon signed-rank tests taking the group change across stages III and IV as the unit of analysis, pooling across signal profiles. We find no significant differences in average investments (p = 0.6068 for COMM; p = 0.6036 for NO-COMM), or in within-group variability in the NO-COMM treatment (p = 0.4601). However there is a significant increase in within-group variability in the COMM treatment (p = 0.0002).
The significant increase in within-group variability from stage III to IV of the COMM treatment is accompanied by a reduction in the amount of “consensus”. We find only one of 27 groups made identical choices. Thus while in stage III many subjects chose to enter the same decision as that of fellow group members, once they reached stage IV they tended to “do their own thing”. This suggests that at least part of the consensus in stage III was due to social preferences over risk.
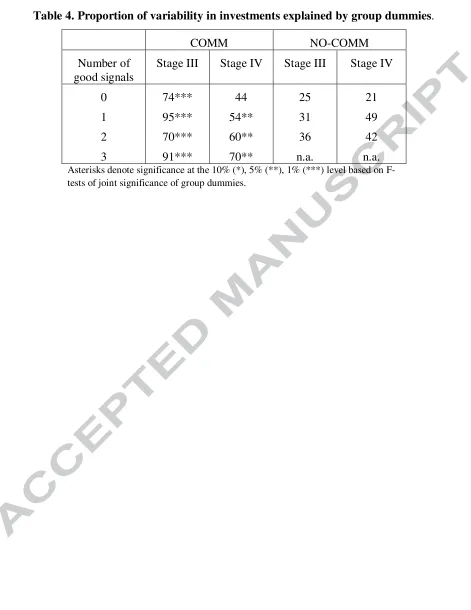
In order to examine whether there is any influence of the stage III group interaction on decisions we regressed investment decisions on group dummies for each signal profile. The R2 statistics from these regressions are presented in Table 4. Note that in the NO-COMM treatment the dummy variables are insignificant. In the COMM treatments the group dummies are highly significant in stage III, reflecting that the variability of individuals’ investment choices about group means is substantially lower than the variability about the overall mean. In stage IV the explanatory power of the group dummies is reduced, but not eliminated. Thus, even though the incidence of consensus is reduced subject choices within groups are highly correlated, offering support for the persuasive arguments mechanism. Group communication has a lasting impact on subject choices.
18 5. Conclusion
We report the results of an experiment designed to help understand how groups aggregate information that is relevant for decision-making in risky environments. In our experiment subjects receive information from two sources: from observing private signals and from other group members. In the latter case we vary group communication, allowing group members to either freely communicate or restricting them to simple direct reports of information.
Our analysis of the experimental results produces two main findings. First, while the behavior of many subjects is consistent with Bayesian rationality, a considerable number of subjects exhibited ‘reverse confirmation bias’. That is, they seem to place less weight on information from others that agrees with their private signal and more weight on conflicting information. We find that this tendency is particularly pronounced when subjects communicate freely. When subjects cannot communicate freely, the incidence of reverse confirmation bias reduces to the same level as confirmation bias. As far as we are aware this phenomenon has not been documented before. There are different ways of interpreting the change of investment away from one’s private signal after talking to others. One explanation is that the subject somehow places more weight on the signal different from her own after a group discussion. This could be driven by a probability heuristic acquired in the group discussion or by the verbal report of a signal contradicting one’s own coming across as more credible. An alternative explanation is that the subject has become convinced, in the course of the discussion with others, that she has overweighted her own signal in her stage II decision. Distinguishing between competing explanations is an interesting topic for further research.
Second, when subjects can communicate freely we observe a striking degree of consensus: in most groups all members make the same choice. The pattern of choices across different stages of the experiment suggests that the high degree of group consensus is partly due to persuasive arguments of other group members and partly due to social preferences over risk.
19
20 References
Anderson, L. R., and Holt, C. A. (1997). Information cascades in the laboratory. American Economic Review 87 847-862.
Austen-Smith, D. and J.S. Banks (1996). Information aggregation, rationality, and the Condorcet jury theorem. American Political Science Review 90, 34-45.
Ali, S. N., Goeree, J. K., Kartik, N. and T.R. Palfrey (2008). Information aggregation in standing and ad hoc committees. American Economic Review 98, 181-186.
Baker, R. J., Laury, S. K. and A.W. Williams (2008). Comparing small-group and individual behavior in lottery-choice experiments. Southern Economic Journal 75, 367-382. Banerjee, A. V. (1992). A simple model of herd behavior. Quarterly Journal of Economics,
797-817.
Bikhchandani, S., Hirshleifer, D., and Welch, I. (1992). A theory of fads, fashion, custom, and cultural change as informational cascades. Journal of Political Economy 100, 992-1026.
Blinder, A. S., and Morgan, J. (2005). Are two heads better than one? Monetary policy by committee. Journal of Money, Credit and Banking 37, 789-811.
Bougheas, S., Nieboer, J. and M. Sefton (2013). Risk taking in social settings: Group and peer effects. Journal of Economic Behavior and Organization 92, 273-283.
Camerer, C. (1995) Individual Decision Making, in Handbook of Experimental Economics, editors Kagel, J. and A. Roth, Princeton University Press Princeton 587- 703.
Charness, G., Karni, E., and Levin, D. (2007). Individual and group decision making under risk: An experimental study of Bayesian updating and violations of first-order stochastic dominance. Journal of Risk and Uncertainty 35, 129-148.
Condorcet, Marquis de (1785). Éssai sur l'Application de l'Analyse à la Probabilité des Décisions Rendues à la Pluralité des Voix, Paris, France.
Cooper, D. and M. Rege (2011). Misery loves company: social regret and social interaction effects in choices under risk and uncertainty. Games and Economic Behavior 73, 91-110.
21
groups. Journal of Economic Behavior and Organization 83, 24-30.
Feddersen, T. and W. Pesendorfer (1998). Convicting the innocent: The inferiority of unanimous jury verdicts under strategic voting. American Political Science Review 92, 23-35.
Fischbacher, U. (2007). z-Tree: Zurich toolbox for ready-made economic experiments. Experimental Economics 10, 171-178.
Glaeser, E. L. and C.R. Sunstein (2009). Extremism and social learning. Journal of Legal Analysis 1, 263-324.
Gneezy, U. and J. Potters (1997). An experiment on risk taking and evaluation periods, Quarterly Journal of Economics 112, 631-646.
Goeree, J. K. and L. Yariv (2011). An experimental study of collective deliberation. Econometrica 79, 893-921.
Greiner, B. (2004). An online recruitment system for economic experiments. In Kremer, K. and Macho, V. (Eds.), Forschung und Wissenschaftliches Rechnen 2003. GWDG Bericht 63, Göttingen : Gesellschaft für Wissenschaftlige Datenverarbeitung, 79-93. Guarnaschelli, S., McKelvey, R. D. and T.R. Palfrey (2000). An experimental study of jury
decision rules. American Political Science Review 94, 407-423.
Harrison, G. W., Lau, M. I., Rutström, E. E. and M. Tarazona-Gómez (2013). Preferences over social risk. Oxford Economic Papers 63, 25-46.
Hertwig, R., Barron, G., Weber, E. U. and I. Erev (2004). Decisions from experience and the effect of rare events in risky choice. Psychological Science 15, 534-539.
Hoch, S. J. (1984). Availability and interference in predictive judgment. Journal of Experimental Psychology: Learning, Memory, and Cognition 10, 649-662.
Holt, C. A. and S.K. Laury (2002). Risk aversion and incentive effects. American Economic Review 92, 1644-1655.
Jonas, E., Schulz-Hardt, S., Frey, D., and Thelen, N. (2001). Confirmation bias in sequential information search after preliminary decisions: An expansion of dissonance theoretical research on selective exposure to information. Journal of personality and social psychology 80, 557-571.
22
Laughlin, P. R. (1999). Collective induction: Twelve postulates. Organizational behavior and human decision processes 80, 50-69.
Laughlin, P. R., and Ellis, A. L. (1986). Demonstrability and social combination processes on mathematical intellective tasks. Journal of Experimental Social Psychology 22, 177-189. Mancuso, V. F., Finomore, V. S., Rahill, K. M., Blair, E. A., and Funke, G. J. (2014). Effects of Cognitive Biases on Distributed Team Decision Making. In Proceedings of the Human Factors and Ergonomics Society Annual Meeting 58, 405-409.
Masclet, D., Colombier, N., Denant-Boemont, L. and Y. Loheac (2009). Group and individual risk preferences: A lottery-choice experiment with self-employed and salaried workers. Journal of Economic Behavior and Organization 70, 470-484.
McKelvey, R. D. and T. Page (1990). Public and private information: An experimental study of information pooling. Econometrica 58, 1321-1339.
Moscovici, S., and M. Zavalloni (1969). The group as a polarizer of attitudes. Journal of Personality and Social Psychology 12, 125.
Nickerson, R. S. (1998). Confirmation bias: A ubiquitous phenomenon in many guises. Review of General Psychology 2, 175-220.
Nieboer, J. (2013). Risk taking in diverse groups: Gender matters. CeDEx discussion paper series, no. 2013-06, University of Nottingham, UK.
Pitz, G. F. (1969). An inertia effect (resistance to change) in the revision of opinion. Canadian Journal of Psychology 23, 24-33.
Peterson, C. R., and W.M. DuCharme (1967). A primacy effect in subjective probability revision. Journal of Experimental Psychology 73, 61.
Schulz-Hardt, S., Frey, D., Lüthgens, C., and Moscovici, S. (2000). Biased information search in group decision making. Journal of personality and social psychology 78, 655-669. Shupp, R. S. and A.W. Williams (2008). Risk preference differentials of small groups and
individuals. Economic Journal 118, 258-283.
Sobel, J. (2014). On the relationship between individual and group decisions. Theoretical Economics 9, 163-185.
23
Sutter, M. (2007). Are teams prone to myopic loss aversion? An experimental study on individual versus team investment behavior. Economics Letters 97, 128-132.
Sutter, M. (2009). Individual behavior and group membership: Comment. American Economic Review 99, 2247-2257.
Van Swol, L. M. (2007). Perceived importance of information: The effects of mentioning information, shared information bias, ownership bias, reiteration, and confirmation bias. Group processes & intergroup relations 10, 239-256.
Van Swol, L. M., Savadori, L., and Sniezek, J. A. (2003). Factors that may affect the difficulty of uncovering hidden profiles. Group Processes & Intergroup Relations 6, 285-304.
Vinokur, A. and E. Burstein (1974). Effects of partially shared persuasive arguments on group-induced shifts: A group-problem-solving approach. Journal of Personality and Social Psychology 29, 305-315.
Yechiam, E., M. Druyan, and E. Ert (2008). Observing others' behavior and risk taking in decisions from experience. Judgment and Decision Making 3, 493-500.
24 Appendix: Experimental instructions
N.B.: Introductory instructions and instructions for Stages I, II and IV are identical across treatments, whereas stage III instructions differ and are printed separately per treatment.
Introduction (both treatments)
Welcome to our experimental study of decision-making. The experiment will take about 45 minutes. The instructions for the experiment are simple, and if you follow them carefully, you can earn a considerable amount of money. The money you earn will be paid to you, privately and in cash, immediately after the experiment. You are not allowed to talk to other subjects during the experiment, and you are not allowed to look at any computer screen but your own; anyone who is found breaking these rules will be dismissed without payment.
The experiment consists of four stages. In each of the four stages, we will ask you to submit a decision. Your earnings will depend on your decision in only ONE of the four stages; the decisions in the other three stages will not affect your earnings. The experimenter will now randomly determine the stage that will count for your earnings. We have four playing cards: the ace, 2, 3 and 4 of spades - these represent the four stages of the experiment. [Experimenter shows cards to subjects.] We will shuffle them and one will be picked at random. The selected card will go back in the box and will remain here until the end of the experiment. [Randomly chosen subject blindly picks playing card in front of other subjects.] You will not know which one of the stages will count until the end. You should therefore consider your decision carefully in every stage, since, as far as you can tell, any stage could be the one that counts for your earnings. Please raise your hand if you have any questions during the experiment. An experimenter will then come to you and privately answer your question.
25
chosen subject blindly picks box with card set in front of other subjects.]
Stage I (both treatments)
You must choose one of the 11 options in the table shown below. Your earnings will depend on your choice and whether card set A or card set B has been selected. You make a choice by selecting a single option and pressing the ’Submit decision’ button.
You will have 5 minutes to make a decision. Keep in mind that, if this stage has been selected for pay-out, you will be paid according to the decision you are about to make. Please raise your hand if you have a question.
Stage II (both treatments)
Each person will now privately receive a clue about which card set has been selected. We will do this by letting you draw a card from the selected set, allowing you to see if its red or black, then putting it back in the set before the next person draws a card. Your clue is private in the sense that only you observe it. Other subjects cannot see the card you draw. Please note that we will ask you to input your clue on the computer screen immediately after your draw.
We will now go around and give each of you your private clue. Please keep your eyes in your own cubicle and wait until the experimenter comes to you, draw a card from the set, look at it, then input it on your screen. You are not allowed to observe other people’s clues.
You must choose one of the 11 options in the table shown below. Your earnings will depend on your choice and whether card set A or card set B has been selected. You make a choice by selecting a single option and pressing the ’Submit decision’ button.
You will have 5 minutes to make a decision. Keep in mind that, if this stage has been selected for pay-out, you will be paid according to the decision you are about to make. Please raise your hand if you have a question.
Stage III (treatment COMM)
26
Before you make any decision, you will get 5 minutes to communicate with your fellow group members through a chat box on your screen. You are free to discuss any aspect of the experiment that you wish, as long as you follow these rules:
• You must not reveal any personal information (for example, your name, contact details or seat in the room)
• You must not make any threats, insults or use otherwise offensive language If you violate these rules your payment will be forfeited.
After the chat you must choose one of the 11 options from the table below (which will be displayed on your screen during the chat). One of the three decisions in your group will be randomly selected and all group members will be paid according to this decision. This means that each member of your group will earn the same amount. At the end of this stage, you will be informed of each group member’s decision and which one of the three group members’ decisions has been selected.
You must choose one of the 11 options in the table shown below. The earnings of each member of your group will depend on which of the three group members’ choices will be selected and whether card set A or card set B has been selected. You make a choice by selecting a single option and pressing the ’Submit decision’ button. You will have 5 minutes to make a decision. Please raise your hand if you have a question.
One of the group members’ choices will be randomly selected and implemented for the entire group. Keep in mind that, if this stage has been selected for pay-out, you will be paid according to the selected decision.
Stage III (treatment NO-COMM)
In this stage you will be randomly matched with two other subjects to form a group of three. You can report your clue to your fellow group members (we will ask you to choose one of the alternatives on your screen). Before you make a decision in this stage, you will see the clues reported by yourself and the two other members of your group.
27
the 11 options from the table below (which will be displayed on your screen). One of the three decisions in your group will be randomly selected and all group members will be paid according to this decision. This means that each member of your group will earn the same amount. At the end of this stage, you will be informed of each group member’s decision and which one of the three group members’ decisions has been selected.
You must choose one of the 11 options in the table shown below (options are the same as in the previous stages). The earnings of each member of your group will depend on which of the three group members’ choices will be selected and whether card set A or card set B has been selected. You make a choice by selecting a single option and pressing the ’Submit decision’ button. You will have 5 minutes to make a decision. Please raise your hand if you have a question.
One of the group members’ choices will be randomly selected and implemented for the entire group. Keep in mind that, if this stage has been selected for pay-out, you will be paid according to the decision you are about to make.
Stage IV (both treatments)
In this part of the experiment, you must make another decision, this time individually. You must choose one of the 11 options in the table shown below. Your earnings will depend on your choice and whether card set A or card set B has been selected. You make a choice by selecting a single option and pressing the ’Submit decision’ button. You will have 5 minutes to make a decision.
[image:29.612.77.542.106.685.2]
28 Tables and figures
Table 1: Investment Choices and Earnings
Investment (£) Earnings (£)
good state bad state
0 10 10
1 12.80 9
2 15.40 8
3 17.80 7
4 19.60 6
5 20.80 5
6 21.60 4
7 22.40 3
8 22.80 2
9 23.20 1
[image:30.612.86.537.79.646.2]
29
Table 2. Stage III Investment Decisions
Average Mean Absolute Deviation
Number of good signals
COMM NO-COMM COMM NO-COMM
0 0.89 0.72 0.30 0.85
(n=6) (n=13) (n=6) (n=13)
1 1.70 1.83 0.15 1.44
(n=9) (n=6) (n=9) (n=6)
2 3.17 4.27 0.72 1.44
(n=8) (n=10) (n=8) (n=10)
3 5.42 5.00 0.56 3.33
[image:30.612.114.538.85.320.2](n=4) (n=1) (n=4) (n=1)
Table 3. Stage IV Investment Decisions
Average Mean Absolute deviation
Number of good signals
COMM NO-COMM COMM NO-COMM
0 0.89 0.79 0.59 0.91
(n=6) (n=13) (n=6) (n=13)
1 2.00 2.17 0.79 0.96
(n=9) (n=6) (n=9) (n=6)
2 2.83 3.67 1.13 0.96
(n=8) (n=10) (n=8) (n=10)
3 5.58 4.67 1.16 2.88
[image:31.612.72.543.84.694.2]
30
Table 4. Proportion of variability in investments explained by group dummies.
COMM NO-COMM
Number of good signals
Stage III Stage IV Stage III Stage IV
0 74*** 44 25 21
1 95*** 54** 31 49
2 70*** 60** 36 42
3 91*** 70** n.a. n.a.
[image:32.612.109.541.90.517.2]
31
Figure 1: Distributions of individual investments in stages I and II.
0
.1
.2
.3
.4
F
ra
c
ti
o
n
0 2 4 6 8 10
Stage I Investment
0
.1
.2
.3
.4
0 5 10 0 5 10
bad signal good signal
F
ra
c
ti
o
n
[image:33.612.96.535.123.694.2]
32
Figure 2: Stage I (pre-private signal) versus Stage II (post-private signal) investments.
0
5
1
0
0 5 10 0 5 10
bad signal good signal
S
ta
g
e
I
I
In
v
e
s
tm
e
n
t
[image:34.612.95.532.135.703.2]
33
Figure 3: Stage II (pre-information sharing) versus Stage IV (post-information
sharing) investments by subjects receiving two identical signals from others.
0
5
1
0
0
5
1
0
0 5 10 0 5 10
COMM, two new bad signals COMM, two new good signals
NO-COMM, two new bad signals NO-COMM, two new good signals
S
ta
g
e
I
V
I
n
v
e
s
tm
e
n
t
[image:35.612.90.538.135.657.2]
34
Figure 4: Stage II (pre-information sharing) versus Stage IV (post-information
sharing) investments by subjects receiving two conflicting signals from others.
0
5
1
0
0
5
1
0
0 5 10 0 5 10
COMM, own signal bad COMM, own signal good
NO-COMM, own signal bad NO-COMM, own signal good
S
ta
g
e
I
V
I
n
v
e
s
tm
e
n
t
Risk Taking and Information Aggregation in Groups
April 22, 2015
Highlights
• We report an experiment on risk taking and information aggregation in groups • Subjects show a high degree of trust in information reported by others
• Group interaction leads to ‘reverse confirmation bias’, but only with communication