Individual users’ perception of
signalised intersections
Master Thesis
B. van der Bijl
Colophon
Title: Individual users’ perception of signalised intersections
Date: December 2010
Author: B. van der Bijl
Status: Final
Graduation Committee: Prof. Dr. E.C. van Berkum University of Twente, Enschede Faculty of Engineering Technology Centre for Transport Studies
Dr. J. Bie
University of Twente, Enschede Faculty of Engineering Technology Centre for Transport Studies
J.D. Vreeswijk, MSc. Peek Traffic, Amersfoort
Pages: 57
Appendices: 7
© Copyright 2010 Peek Traffic B.V. Amersfoort, The Netherlands.
B. van der Bijl
ABSTRACT
Knowledge of the users‟ perception of signalised intersections is important to increase the acceptance of a system. A good traffic light controller not only optimizes its control to the objectives of the road authorities, but also takes the user acceptance into account. A low acceptance might result in red light or speed violations and route alterations.
The perceived waiting time (PWT) is an indicator for the users‟ perception. The PWT is a measurement of how long car drivers experience their waiting time at a traffic light. Besides the actual waiting time, other factors (e.g. the number of stops or green waves) influence the PWT. Knowing the PWT in the design process is necessary to increase the user acceptance of the final system. Therefore it is necessary to evaluate the PWT a priori of implementing a system. This evaluation can be performed using simulation studies.
The main objective of this study is to find a model that describes the PWT of car drivers. A literature review resulted in ten factors with various levels of influence on the waiting time perception at signalised intersections. The most important factors are the actual waiting time, the number of stops in the queue, the unused green time of conflicting traffic and green waves between adjacent intersections.
An online video survey among 159 respondents is conducted to retrieve the influence of each factor on the PWT. Respondents were shown a number of movies filmed from the drivers‟ perspective of a vehicle passing a signalised intersection in Den Bosch or Helmond, and after each movie the respondents were asked to estimate their waiting times. In total 44 movies were analyzed by the respondents, resulting in the following model for the perceived waiting time:
Where:
= Expected perceived waiting time
= Actual waiting time
= Number of stops in the queue
= Red wave, 1 if there is a red wave (else 0)
The figure 1 shows the outcomes of the model in all possible situations. The dots represent the main perceived waiting time measured in the survey. The model predicts the measured perceived waiting times good: the .
Respondents were also asked if their perceived waiting time is acceptable or not. Based on this question, the following model for the user acceptance (UA) is retrieved. According to this model, a PWT up to 66 seconds is acceptable.
UA =
B. van der Bijl
Figure 1: the various outcome of the perceived waiting time model.
Both models are validated with a real-world experiment. Both in Den Bosch and Helmond, two car drivers were asked for their PWT and UA while they were driving a route over a number of signalised intersections. Together the subjects analyzed 37 situations, resulting in a positive validation of both models. Although the models are retrieved from an online video survey, they are a good prediction of the real-world PWT and UA.
A second objective was to evaluate the perceived waiting time in the traffic simulator Vissim. Using the COM-Interface, an external application is used to retrieve vehicle data from Vissim, calculate the PWT and UA for each vehicle and visualize the PWT by colouring the vehicles in the simulation. Figure 2 illustrates the application and its output in Vissim. The more red a vehicle is, the higher its perceived waiting time is.
B. van der Bijl
The third objective of this study was to evaluate the differences in the users‟ perception of different traffic light control systems and configurations. In simulation the network controller Utopia is compared the solitaire controlled intersections, and different configurations of Utopia are compared with each other.
In the solitaire controlled scenario, the user acceptance is higher compared to the Utopia-scenario. Due to the network optimization of Utopia, left turning vehicles and vehicles on the side roads have to wait longer, resulting in more unacceptable perceived waiting times. Alternative configurations of Utopia also have some influence of the user acceptance. More coordination on the main road, for example, results in a higher acceptance of the main road and a lower acceptance on the side roads.
In conclusion, the perceived waiting time is a good indicator for the users‟ perception of signalised intersections. A lower average PWT results in a higher user acceptance of a traffic light control system. According the model, the following requirements can be set to increase the users‟ perception of a system:
Prevent short and long waiting times. Due to the quadratic nature of the model, both short and long waiting times are overestimated while average waiting times are perceived as they are.
Multiple stops in the queue result in lower perceived waiting times, which impacts the user acceptance of traffic lights.
B. van der Bijl
CONTENTS
Abstract ... iii
1 Research scope ... 4
1.1 Background ... 4
1.2 Objective ... 5
1.3 Research questions and model ... 5
2 Individual Users’ perception of traffic lights ... 6
2.1 Introduction ... 6
2.2 Existing indicators ... 6
2.2.1 The perceived Level-of-Service ... 6
2.2.2 The perceived waiting time ... 7
2.3 Selection of the indicator ... 7
2.3.1 Modelling of perceived waiting time ... 8
2.3.2 Evaluating the perceived waiting time ... 8
2.4 Summary ... 8
3 Factors influencing the PWT ... 9
3.1 Introduction ... 9
3.2 Description of the factors ... 9
3.2.1 Actual waiting time...10
3.2.2 Number of stops in the queue ...10
3.2.3 Unused green time conflicting traffic ...11
3.2.4 Green wave ...11
3.2.5 Protected left turns ...12
3.2.6 Traffic mix ...12
3.2.7 Interference from bicycles and pedestrians ...13
3.2.8 Fairness...13
3.2.9 Visibility of traffic signals ...14
3.2.10 Waiting time information systems ...14
3.3 The most dominant factors ...14
3.4 Summary ...15
4 Survey ... 16
4.1 Introduction ...16
4.2 Methods ...16
4.3 Prospective approach ...18
4.4 Online video survey ...19
4.5 Movies ...20
4.5.1 Description of the movies ...20
4.5.2 Structure of the movies ...21
4.6 Summary ...23
B. van der Bijl
5.1 Introduction ...24
5.2 Movie characteristics ...24
5.2.1 Actual waiting time...24
5.2.2 Number of stops in the queue ...26
5.2.3 Unused green time conflicting traffic ...26
5.2.4 Red wave ...27
5.3 Perceived waiting time - model ...28
5.4 User acceptance – model ...30
5.5 Validation ...31
5.6 Summary ...32
6 Vissim... 33
6.1 Introduction ...33
6.2 Vissim and the COM-Interface ...33
6.3 The perceived waiting time in Vissim ...34
6.4 Algorithm ...36
6.5 Summary ...38
7 Scenario analysis ... 39
7.1 Introduction ...39
7.2 TLC-systems ...39
7.2.1 Solitaire intersection control ...39
7.2.2 Utopia ...40
7.3 Cities ...42
7.3.1 Helmond...42
7.3.2 Den Bosch ...42
7.4 Scenario analysis ...44
7.4.1 Helmond...44
7.4.2 Den Bosch ...46
7.5 Summary ...48
8 Discussion ... 49
8.1 Introduction ...49
8.2 Research method ...49
8.3 Results ...50
8.4 Implications ...51
8.5 Conclusions ...52
9 Conclusions ... 53
B. van der Bijl
B. van der Bijl
1
RESEARCH SCOPE
1.1 Background
In the Netherlands, local road authorities are responsible for the operation of transport systems. According the Nota Mobiliteit (Ministerie van Verkeer en Waterstaat, 2004), the road authorities aim to decrease the overall travel times and to improve the reliability of these travel times.
When focusing on urban networks, one of the most powerful measurements of road authorities to manage traffic are traffic light controllers (TLC) at intersections. With different TLC-systems, the traffic can be controlled by other objectives. Examples of such objectives are short waiting times at intersections and a decrease of emissions. Depending on the situation and the preferences of the responsible road authority, the best TLC-system is implemented.
Local road authorities and private companies use several measures of performances (MOPs) to assess the operation of a TLC-system. Peek Traffic, for instance, uses the following MOPs to assess the operation of TLC-systems (Hermkes, 2007, 2009; Holwerda, 2009):
Travel time, delay time and number of stops on the main roads; Travel time, delay time and number of stops in the entire network; Cycle time per intersection.
Lee, Kim and Pietrucha (2007) state that most of the current MOPs have been created exclusively for evaluating the transport system without focusing on the user aspects. These MOPs can be used to assess a TLC-system from the local road authorities‟ point of view, like Peek Traffic does.
Knowing the users‟ perception of a TLC-system is important to improve the user acceptance of that system. A low acceptance may, for example, result in red light violation or speeding. Road users have other priorities then the local authorities, and therefore perceive certain measures differently. Knowledge of the users‟ perception a priori of implementing a TLC-system increases the user acceptance of the system.
B. van der Bijl
1.2 Objective
Knowing a priori of implementing a TLC-system the individual users‟ perception is necessary to adopt the system to the needs of the road users, and therefore increase user acceptance of the system. Therefore the main objective of this study is:
1.3 Research questions and model
In this study the next four questions are answered. These questions provide insight in the individual users‟ perception of signalised intersections and how these perceptions can be evaluated.
1. What is a good indicator of the individual users‟ perception of signalised intersections? 2. On what characteristics of a TLC-system depends this indicator?
3. How can the individual users‟ perception of several TLC-systems be evaluated a priori?
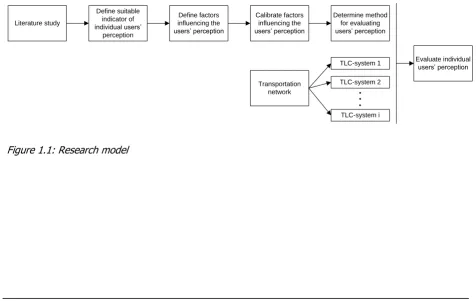
Figure 1.1 illustrates the research model related to the questions. This model describes the different steps needed to fulfil the objective and answer the questions. The study itself follows the structure of the model.
Literature study
Define suitable indicator of individual users’
perception
Define factors influencing the users’ perception
Calibrate factors influencing the users’ perception
Determine method for evaluating users’ perception
Transportation network
TLC-system 1
TLC-system 2
TLC-system i
Evaluate individual users’ perception
Figure 1.1: Research model Objective
[image:11.595.64.541.478.779.2]B. van der Bijl
2
INDIVIDUAL USERS’ PERCEPTION OF TRAFFIC LIGHTS
2.1 Introduction
As discussed in section 1.1, local road authorities are mainly interested in the MOPs of TLC-systems. Examples of such MOPs are a minimization of travel times or the number of stops. Some recent studies state that users‟ perception of the TLC-system is important as well: a low acceptance may result in red light negation or speeding.
In this chapter existing indicators of the users‟ perception of traffic lights are discussed. Based on this discussion, the perceived waiting time (PWT) is chosen as indicator in this study. Finally a description is provided how the PWT can be calibrated and a priori evaluated for TLC-systems.
2.2 Existing indicators
Two indicators of the users‟ perception of TLC-systems have been studied before: the perceived Level-of-Service (LOS) and the perceived waiting time. Both indicators are reviewed in this paragraph.
2.2.1 The perceived Level-of-Service
Fang, Elefteriadou, Pécheux and Pietrucha (2003), Lee et al. (2007), Pécheux (2000), Pécheux, Pietrucha and Jovanis (2000) and Zhang (2004) studied the perceived LOS of signalized intersections. This indicator of the users‟ perception results in an average score per intersection, which depends on the following characteristics:
Intersection characteristics are indicators of the lay-out of an intersection; Signal scheme characteristics are indicators of the traffic light control program;
Traffic characteristics are indicators of the traffic situation while a vehicle is waiting before an intersection;
Personal characteristics are indicators of the car drivers.
Stated preference surveys are performed to determine which characteristics are of importance for the perceived LOS. For the different studies, these characteristics are presented in Appendix A.
B. van der Bijl
2.2.2 The perceived waiting time
Wu et al. (2009) studied the PWT of car drivers at signalised intersections. The PWT is defined as how long car drivers perceive their waiting time at a traffic light, and depends on the actual waiting time and some personal characteristics of the car drivers:
The actual waiting time knows a quadratic relationship with the PWT;
The personal characteristics have a significant but limited influence on the PWT.
The model of Wu et al. is calibrated by presenting respondents a 3D-movie on a computer screen. This movie, recorded from the traffic simulator Aimsun (figure 2.1), shows a vehicle passing a number of intersections. After the movie, the respondents were asked how long they think they waited for each intersection.
Figure 2.1: Visualization of the movies used to calibrate the PWT (Wu et al., 2009)
The advantage of the PWT is that it evaluates the individual users‟ perception of signalised intersection. However, many characteristics, like the number of stops and coordination, of the situation are excluded. Also the realism of the movies is discussable, because they are not recorded from a real vehicle.
2.3 Selection of the indicator
In the previous section two existing indicators of the users‟ perception of TLC-systems are discussed. The perceived LOS evaluates many characteristics and results in an average perception per intersection, while the PWT depends only on the actual waiting time and some personal characteristics and results in an individual users‟ perception. The realism of both indicators is discussable, because they are either obtained from a stated preference survey (perceived LOS) or from a non-realistic movie (perceived waiting time).
B. van der Bijl
The perceived waiting time, as presented in this study, is a combination of both existing indicators. The individual approach of the PWT proposed by Wu et al. (2009) is combined with the factors included in the perceived LOS.
2.3.1 Modelling of perceived waiting time
Besides the actual waiting time, many factors may influence the perceived waiting time of individual car drivers. Therefore the relationships between those factors and the PWT are studied in this research. First a literature study is performed to select the most dominant factors influencing the PWT (see chapter 3), secondly a survey is conducted to model the PWT (chapters 4 and 5). The results of the survey are used to model the relation between the PWT and the factors discussed in chapter 3.
2.3.2 Evaluating the perceived waiting time
The main objective of this study is to define an indicator to evaluate a priori the users‟ perception of a system. The best method for a priori evaluation is a simulation study of the TLC-system. In a simulation environment the operation of the system is assessed, and it is possible to adjust the system before it is implemented on the streets.
Vissim is a simulation environment used by Peek Traffic. Using the COM-Interface it is possible to evaluate additional indicators, like the individual users‟ perception of the traffic lights. Therefore, the PWT has to be calibrated that it is capable of being used in combination with Vissim. This means that personal characteristics cannot be a part of the a priori evaluation as Vissim does not distinguish different personalities among road users. Therefore, the personal characteristics are given less attention in this study.
2.4 Summary
A priori evaluating the individual users‟ perception of TLC-systems is the main objective of this study. In literature, two indicators of the users‟ perception are described: the perceived Level-of-Service and the perceived waiting time.
The perceived LOS evaluates the average users‟ perception of a signalised intersection. Many characteristics of the situation are included in the model, but it is not possible to determine the individual users‟ perception. On the other hand, the PWT estimates the individual perception but it only includes some personal characteristics and the observed waiting time. Other factors are not included in this indicator.
In this study, the earlier mentioned PWT will be expanded with the factors of the perceived LOS. The new PWT is a combination of both existing indicators, resulting in an individual indication of the users‟ perception with respect to the characteristics of a situation on a signalised intersection.
B. van der Bijl
3
FACTORS INFLUENCING THE PWT
3.1 Introduction
The perceived waiting time (PWT) is an indication of the users‟ perception of signalised intersections. For each individual road user the PWT depends on the traffic situation occurred during the waiting time, and expresses how the user perceived his waiting time before the traffic light.
In this chapter, ten factors with various levels of influence on the PWT are discussed. These factors are retrieved from the studies about the perceived Level-of-Service (section 2.2.1). From these studies the most promising factors are selected and a literature study is conducted to provide more details of the factors.
3.2 Description of the factors
Based on the factors presented in Appendix A, ten factors are chosen for further research. These factors are expected to have the greatest influence on the PWT. In this paragraph the factors are described in detail and the expected influence on the PWT is determined. The information presented in this paragraph is based on the available literature.
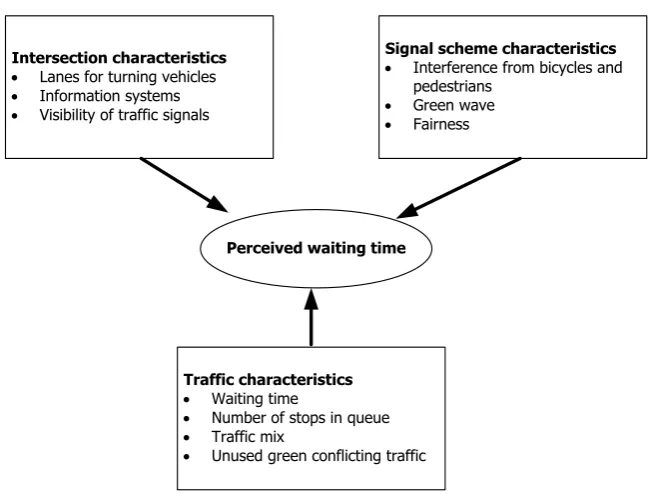
Figure 3.1 shows the ten factors which are discussed in this section. As described in section 2.2.1, these factors can be subdivided into four categories. Personal characteristics are not included in this study, because according to Wu et al. (2009) the influence on the PWT is minimal.
Intersection characteristics
Lanes for turning vehicles Information systems Visibility of traffic signals
Signal scheme characteristics
Interference from bicycles and pedestrians
Green wave Fairness
Traffic characteristics
Waiting time
Number of stops in queue Traffic mix
[image:15.595.134.465.472.719.2] Unused green conflicting traffic Perceived waiting time
B. van der Bijl
In this section, two surveys are often referred to. The ANWB (2008) asked readers of their monthly magazine (Kampioen) about their experiences and complaints of traffic lights. Respondents were asked to describe the signalised intersection they are most annoyed by. The presented results in this chapter apply only for these intersections.
In his dissertation, Zhang (2004) studied how respondents rate a signalised intersection. Respondents were asked for their perceived importance of several factors. They could rate each factor as not, a little, moderately, very and extremely important.
3.2.1 Actual waiting time
The actual waiting time is the time spend by a vehicle in the queue before the intersection. The influence of the actual waiting time on the PWT seems rather obvious. This is confirmed by Pécheux (2000) and Wu et al. (2009) who studied the relationship between the actual and perceived waiting time at signalised intersections. They both concluded that this relationship is influenced by several factors, but the actual waiting time is the most important one.
In their model to determine the PWT, Wu et al (2009) found a quadratic relationship between the actual and perceived waiting time. Unfortunately, the validity of this model can be discussed since they did not include other factors than some personal characteristics. However, the model demonstrates the importance of the actual waiting time in the relationship.
Also Lee et al. (2007) found that the waiting time at traffic lights is one of the two most important factors (together with the unused green time of conflicting traffic) in the perceived Level-of-Service (LOS) of signalised intersections. Chen, Li, Ma and Shao (2009) agree with this finding, they state that the users‟ LOS ratings depend strongly on the actual waiting time.
In the survey conducted by the ANWB (2008), 62% of the respondents complain about long waiting times at their chosen intersection. According to Zhang (2004), 65% of the subjects state that the actual waiting time is very or extremely important in their assessment of an intersection.
3.2.2 Number of stops in the queue
The number of stops is a commonly used Measure of Performance (MOP) to assess the operation of a TLC system, and describes the number of times a vehicle has to stop in the queue at an intersection. The number of stops is not only an indication of the fuel consumption of a vehicle (Kang, 2000), but also a measurement of the efficiency and complexity of the movements at an intersection (Chen et al., 2009)
Zhang (2004) found that 79% of the respondents participated in his dissertation rated the ability to go through an intersection within one cycle of light changes as very or extremely important. This indicates that drivers accept only one stop in the queue at an intersection. A second stop could therefore increase the PWT.
B. van der Bijl
crossing the intersection. In combination with the results from Zhang (2004), it is likely that there is a major influence of the number of stops in the queue on the PWT.
3.2.3 Unused green time conflicting traffic
Many complaints about signalised intersections consider the amount of unused green time for the conflicting traffic stream. Most car drivers consider it as annoying to wait for empty intersections. According to the ANWB (2008), 62% of the car drivers complain about the amount of unused green time for conflicting traffic.
Pécheux (200) and Zhang (2004) found that most drivers prefer vehicle actuated control above fixed-timed control. They reasoned that actuated controllers are more efficient, and therefore the amount of unused green time is reduced. Pécheux proved that the PWT at actuated controlled intersections is lower compared to that of fixed-timed controlled intersections.
Together with the actual delay, Lee et al. (2007) found that the unused green time of conflicting traffic is important in the perceived LOS of signalised intersections.
3.2.4 Green wave
Coordination is a mode of signal control where platoons of vehicles can drive through several signalised intersection in a row with a minimum of stops and delays (Liu, Chu and Recker, 2001). If signals are closely spaced together, coordination is necessary to avoid excessive delay and stops. In the Netherlands, CROW states that coordination is required if intersections are situated less than 150 meters from each other (Wilson, 2006). Other studies propose coordination between intersection to 500 meter (Hoogendoorn, 2007; Rouffeart et al., 2009).
Depending on the distance between intersections, coordination is more or less preferred. The effect of vehicle bunching weakens as the platoon moves downstream, since vehicles travel at various speeds (Rouphail, Tarko and Li, 2001). This platoon dispersion results in longer required green times for coordination, which decreases the capacity of a TLC-system.
Car drivers are most times unfamiliar with the existence of coordination. If there is coordination between two adjacent intersections, they experience this as a green wave. When there is no coordination between intersections, it is possible that a car driver can pass both intersections without stopping and experience a green wave.
Wu et al. (2009) concluded that drivers have an uncomfortable feeling if there is no coordination between intersections, and they have to stop at each intersection. According to the ANWB (2008), 52% of the respondents agree with this conclusion.
B. van der Bijl
3.2.5 Protected left turns
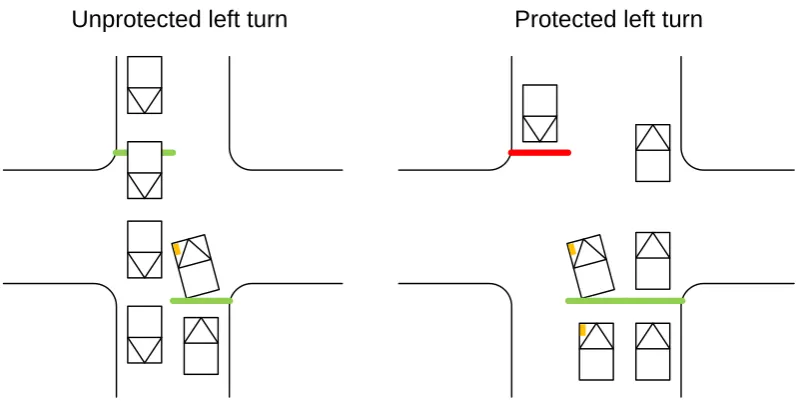
Protected left-turns are a combination of exclusive left-turn lanes and separate phase in the signal scheme for left-turns, without conflicts with other traffic.
[image:18.595.107.506.145.348.2]Unprotected left turn
Protected left turn
Figure 3.2: Protected and unprotected left turns
According to Zhang (2004), drivers making left turns prefer to use exclusive left-turn lanes so that they can wait safely without blocking other traffic. Around 82% of the respondent rated left-turn lanes in combination with left-turn protected signals as important. Also in the survey conducted by Pécheux (2000), respondents indicate that the presence of either a left-turn lane and/or a protected left-turn only phase influence the perceived waiting time at intersections.
75% of all car drivers consider the availability of exclusive left-turn lanes and protected left turn signals as very or extremely important (Zhang and Prevedouros, 2004). Almost all drivers feel much or extremely safer under a protected left-turn signal, and almost all driver prefer a protected left-turn.
As mentioned in the studies, exclusive left lanes and protected left turns are considered as save and are preferred by car driver. In all studies the availability of those aspects at signalised intersection is considered as important, and is included in the discussed models. Although most studies focus on the (perceived) Level-of-Service, it can be expected that the availability of protected left-turns has a significant influence on the PWT at signalised intersections.
3.2.6 Traffic mix
B. van der Bijl
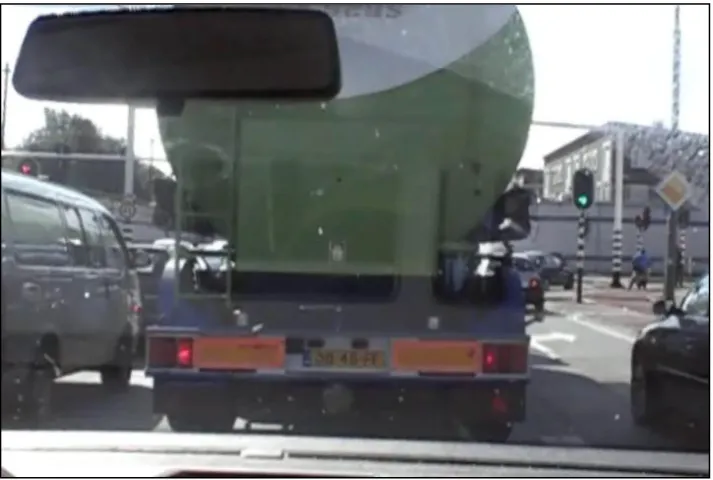
Figure 3.3: Waiting behind a heavy vehicle
According to Zhang (2004), 48% of the respondents indicate that fewer heavy vehicles waiting ahead of them as very or extreme important. However, almost 24% consider this as not or little important. Also in the survey conducted by the ANWB (2008), the mix with heavy vehicles is not mention as a complaint at the chosen intersections.
It is clear that the presence of heavy vehicles and busses increase the actual delay of vehicles behind them, but it is doubtable that the perception of this delay is significantly increased.
3.2.7 Interference from bicycles and pedestrians
Whenever the green phase of vehicles conflict with the green phase of bicycles or pedestrians, car drivers have to give right-of-way to the non-motorized traffic. This conflict of green phases result in an increased delay for vehicles: the capacity of the traffic light drops (Wilson, 2006).
According to Chen et al. (2009), drivers not only experience an increased delay but also perceive an unsafe feeling if they interfere with non-motorized traffic. This unsafe feeling affects the perceived LOS of signalised intersections.
The ANWB (2008) states that only 4% of the respondents listed interference with conflicting traffic (both other vehicles, bicycles and pedestrians) as a complaint at their chosen intersection.
It can be concluded that the effects from the interference with non-motorized traffic are notable for car-drivers: they experience an increased delay and it may be perceived as unsafe. But it is unlikely that the conflict of green phases has a significant influence on the perceived waiting time.
3.2.8 Fairness
B. van der Bijl
(2002) define fairness as the standard deviation in waiting times. A lower standard deviation results in an increased fairness among road users.
According to the ANWB (2008), 9% of the respondents mentioned PT-priority as a complaint at their chosen intersection. In other studies, fairness is not mentioned as a factor influencing the perceived waiting time of the perceived Level-of-Service.
3.2.9 Visibility of traffic signals
In many studies the signal visibility is mentioned as a factor in the perceived LOS of signalised intersections (e.g. Pécheux. 2000; Lee et al., 2007). Poorly visible signals lower the user assessment, because drivers cannot see the state of the signal and therefore do not know why they are waiting.
In the survey conducted by the ANWB (2008), only 3% of the respondents indicate the signal visibility as a problem at their chosen intersection. It is therefore unlikely that this factor has a significant influence on the PWT.
3.2.10 Waiting time information systems
Information systems, such as waiting time predictors, provide information about the time remaining until the next green phase. Van de Vrande (2009) studied the opinions of road users about recently installed waiting time predictors in Den Bosch. He found that the reaction time at the start of the green phase decreased, and therefore also the average delay of vehicles. In a conducted survey he found that almost all respondents perceived the waiting time predictor as pleasant, and experience it as an increase of the road safety.
Zhang and Levinson (2008) studied the effect of travel time information on route choice behaviour. They found that, in most cases, drivers are willing to pay for travel information, but that the task of understanding drivers‟ responses to information is challenging.
Based on the findings of Van de Vrande and Zhang and Levinson, it is likely that waiting time information systems have an influence on the perceived waiting time. However, it is unknown what the exact effects are.
3.3 The most dominant factors
In the previous section, ten factors which influence the PWT are discussed. Figure 3.4 shows the relationship between the factors and the PWT. Besides the relationship with the PWT, there are also some cross influences between the factors themselves.
In the figure, the thickness of the lines and the number of plusses/minuses indicate the strength between the factors. The actual waiting time, for example, is expected to have a greater influence on the PWT than fairness. A positive influence means that an increase in the factors results in a higher PWT, while a negative influence means that an increase of the factor results in a lower PWT.
B. van der Bijl Waiting time information systems Perceived waiting time Green wave Unused green conflicting traffic Number of stops in queue Actual waiting time Visibility of traffic signals Fairness Interference from bicycles and pedestrians Traffic mix Protected left turns
+
+
+
+
-++
++
++
++
-0-Figure 3.4: Relationships between the ten factors of section 3.2 and the PWT. The most dominant factors are coloured in this figure.
As indicated in the figure, the actual waiting time, the unused green time of conflicting traffic, the number of stops in the queue and green waves between intersections are expected to have the greatest influence on the PWT. Therefore, in this research most attention is given to those factors: in the survey and the analysis of it the focus will be on these factors. However, the influence of the other factors will also be evaluated.
3.4 Summary
[image:21.595.111.482.85.414.2]B. van der Bijl
4
SURVEY
4.1 Introduction
In chapter 3 ten factors which are expected to influence the PWT are discussed. Based on the available literature, four factors are assumed to have the greatest influence on the PWT. To test these assumptions and quantify the relations between the factors and the PWT, as indicated in chapter 2, a survey is needed.
In this chapter the conducted survey is described. First some different methods of survey are discussed. The online video survey is chosen as the best alternative because a high number of respondents can participate and it has a high degree of realism.
4.2 Methods
The objective of the survey is to collect data to quantify the relations between the factors and the PWT. Also the assumption that the actual waiting time, number of stops, unused green time and green waves are the most important factors influencing the PWT needs to be tested. To fulfil these objectives, car drivers have to be confronted with a situation and indicate what their perceived waiting time is. A number of studies reviewed what kind of survey is best to determine the user perception of a transportation network.
Wu et al. (2009) state that a real-world experiment to determine the PWT is not an option, because of variable conditions and the difficulty in having to stop a driver immediately to garner perceptions. Putting a surveyor in the car with the driver would be time consuming and less realistic. A virtual experience stated preference (SP) survey, putting drivers in the driver seat of a virtual car, has advantages in this regard, as the situation can be highly controlled. However, using a driving simulator is also time consuming and expensive. Therefore, the authors choose show a movie from the driver‟s perspective presented on a computer screen. This movie was recorded from a 3-D simulation generated by AIMSUN.
Pécheux et al. (2000) reviewed multiple methods to observe the perceived delay estimates of subjects. For on-the-road studies, two problems were indentified. First, having subjects drive around the streets in a vehicle (even a pre-determined route) would result in a lack of control over the experimental conditions. Secondly, considering the amount of time and resources necessary for such study, running each subject individually in the field would result in a small sample size.
Controlled test-track studies are also discussed. The validity of these studies was questioned, however, due to the lack on in-context driving conditions. Even though the subjects would actually behind the wheel of a vehicle, the test track environment would not afford a real roadway network, an intersection with real traffic signals, or actual cross-street traffic.
B. van der Bijl
though they were the driver. This method would allow for multiple subjects to be run simultaneously while allowing the researchers control over the experimental conditions.
With these considerations in mind, it was agreed that video laboratory studies were a good trade-off between costs, sample size, fidelity, and other issues – the subjects would view an in-context driving situation, all subjects would experience the same conditions, and available time and monetary resources could be used efficiently to gather an adequate sample size.
Leiser and Stern (1988) used an Urban Drive Simulator (UDS) to determine the perceived travel time of a trip through a transportation network. The UDS is a collection of interactive graphic programs which run on Apple Ile microcomputers. In all of them, the subjects controls an animated moving vehicle on a road network by mean of a rotary control knob (“paddle”). The subject may have to accomplish various tasks, and the computer records a collection of performance measures.
The subject‟s task was to “drive” a vehicle along a route indicated on the screen. Only the direction of travel was under control of the subject, while the speed was controlled by the computer. The route is never seen in its entirety. At every point in time, the screen shows a bird‟s-eye view of a small segment of the road, and the moving vehicle on it. The subject‟s task is to keep the vehicle on the road and, at the end of the route, to estimate how long it took him or her to travel it.
Based on the described literature, five methods of survey can be distinguished. These methods are compared with each other on three properties:
Costs: because the budget is limited in this study, the costs cannot be high; Number of respondents: more respondents results in more data of high quality;
Realism: because the users‟ perception of a signalised intersection expresses the feeling of the users, it is important that the method meets reality.
Table 4.1 shows the properties of the five methods. The video survey is the best alternative: the number of respondents is high while the costs are low. Videos are not very realistic, but are more realistic that a stated preference survey.
Table 4.1: Overview of different methods of survey
Method Costs Number of respondents Realism
Real-world experiment Medium Low Very high
Controlled test-track experiment High Low High
Driving simulator High Low High
Video survey Low High Medium
B. van der Bijl
4.3 Prospective approach
In her dissertation, Pécheux (2000) describes the differences between prospective and retrospective time estimation. Because of the importance of these differences, the following content is adopted from her dissertation.
Prospective time estimation occurs when respondents know in advance that they will be requested to estimate time, in other words an estimation of time in passing. In this case they tend to assess time through a so-called time processor. Attention is directed in real time to information that is related to the passage of time. A positive relation is expected between attention given to the passage of time and time estimates. The more attention that is given to time, the more time units are recorded, and the longer the subjective duration.
Retrospective time estimation occurs when respondents are instructed to assess the duration of an event after the event ended. Retrospective time estimates are based on memory-related processes and require the recovery of temporal information. In this case, individuals may rely on the number of items memorized.
Retrospective time estimation occurs when respondents are instructed to assess the duration of an event after the event ended. Retrospective time estimates are based on memory-related processes and require the recovery of temporal information. In this case, individuals may rely on the number of items memorized.
One phenomenon clearly illustrates the difference between prospective and retrospective time estimation, namely non-temporal-information processing (NTIP) load. Under the retrospective paradigm, duration estimates increase with increasing NTIP, whereas under the prospective paradigm, duration estimates decrease with increasing NTIP (Zakay et al. 1996).
Figure 4.1: Retrospective versus prospective estimation paradigms
B. van der Bijl
Zakay (1993) states that it is not always the experimenter‟s instructions, but what is the subjective paradigm perceived by the respondents. For example, under time stress or an occupation with the passage of time caused by the very nature of the task itself, the respondent‟s attention might be attracted to the passage of time. The existence of either these two related elements in a situation induces a situation comparable to the prospective paradigm. In the same sense, if a task performed during a prospective time estimate is too difficult, the respondent will not be able to pay attention to time passage, inducing a situation comparable to the retrospective paradigm (Fraisse, 1984).
Since motorists know in advance that they will have to stop and wait when a traffic signal is red and there is no other task involved while waiting at the signal, delay estimation at traffic signals will be assumed to be under the prospective estimation paradigm.
4.4 Online video survey
As described in section 4.2, the video survey is chosen as the best method to collect the PWT of car drivers. With an online survey it is possible to invite many people to participate in the survey. Therefore the survey is distributed via the online software of NetQ1. People are invited with a personal email to participate in the survey, which is included in the mail as a shortcut to the website. To increase the response, people are also asked to distribute the survey in their own network.
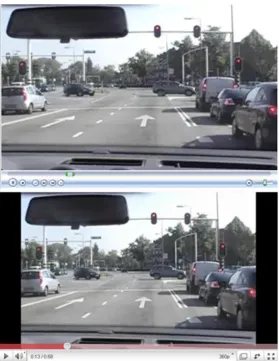
In the online survey, movies are imbedded in the website. Unfortunately, not all respondents were able to play the movies in their web browser. Therefore, respondents could also watch the same movies on YouTube. As figure 4.2 illustrates, both techniques have a time timeline showing the elapsed time. By the imbedded movie the timeline is only an indication of the passed and remaining time, while YouTube shows the actual elapsed and total time. However, there are no significant differences in perceived waiting time between both techniques (see Appendix B).
B. van der Bijl
Figure 4.2: Differences between the imbedded movie (top) and the movie played in YouTube (bottom)
4.5 Movies
In the online video survey respondents are shown a number of movies. In these movies, filmed from the drivers‟ perspective, a vehicle approaches and waits for a red traffic light. A combination of the factors discussed in chapter 3 occurs while waiting for the traffic light.
In the first part of this section the used movies are described. Secondly attention is given to the structure of the movies in the survey.
4.5.1 Description of the movies
B. van der Bijl
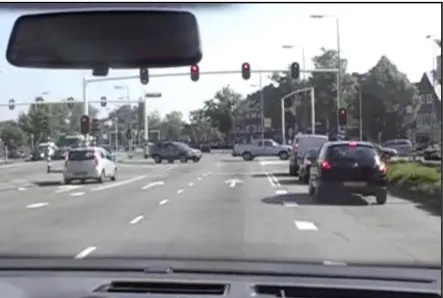
Figure 4.3: Screenshot from a movie showing the driver‟s perspective
4.5.2 Structure of the movies
The purpose of showing the movies to the respondents is to collect their perceived waiting times in situations differently influenced by the factors discussed in chapter 3. Although the movies in the survey are primarily selected on the four most dominant factors (section 3.3), there are many combinations possible. To make a good model for the PWT, it is therefore important that many movies are watched by the respondents.
B. van der Bijl
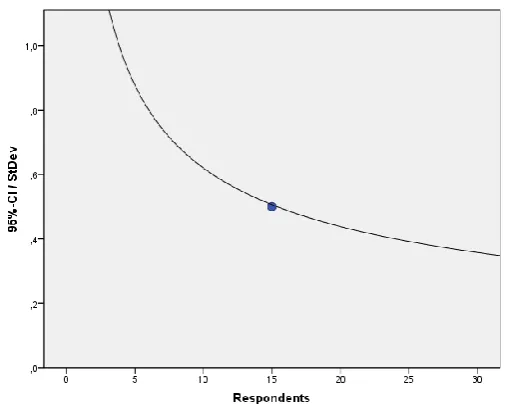
Figure 4.4: The ratio of the 95%-confidence interval (CI) and the standard deviation (StDev)
In the survey, every respondent watches 4 to 5 movies. These movies are randomly selected from 6 bins containing multiple movies (figure 4.5). During the period respondents can participate in the survey, the number of respondents and their answers are monitored. Whenever a movie is watched by 15 respondents and the confidence interval is acceptable, the movie is replaced with a new one. With this technique in total 44 movies were watched by the respondents.
Personal
[image:28.595.174.427.69.271.2]questions End survey
Figure 4.5: Overview of the design of the survey. First respondents are asked for their personal characteristics. Secondly 4 to 5 movies, randomly selected from 6 bins, are shown to the respondents. After each movie, some questions about the shown situation are asked.
To evaluate the relations between the factors discussed in chapter 3 and the PWT, after each movie the respondents are asked for their perceived waiting time. The following question is used for this purpose:
How long do you think you had to wait for this intersection?
B. van der Bijl
questions are related to the factors occurring in the movies. Examples of such questions are about the distance between two intersections or the annoyance of waiting behind a heavy vehicle.
One question is asked after almost all movies: Do you think this waiting time is acceptable? This question is used to analyse the user acceptance of car drivers. Unfortunately, this question is not asked after movies with a red wave between adjacent intersections.
4.6 Summary
B. van der Bijl
5
RESULTS SURVEY AND MODELLING
5.1 Introduction
From the 300 respondents who participated in online video survey (as described in chapter 4), 159 completed the survey. It is possible that many respondents could not watch the imbedded movies of the survey, and therefore did not complete the survey (see section 4.3). Together the respondents watched 44 movies, which results in 730 measurements of the users‟ perception of signalised intersections.
In this chapter the results of the survey are analyzed. First the impacts of the factors discussed in chapter 3 are determined. Based on these impacts, in section 5.3 a model for the perceived waiting time is presented. In section 5.4 a model is presented to determine if the perceived waiting time is acceptable of not. Finally, in section 5.5 the validation of both models is discussed.
5.2 Movie characteristics
In chapter 3, ten factors which influence the users‟ perception of signalised intersections were discussed. These factors are also expected to have an influence on the perceived waiting time of car drivers. The most dominant factors were the actual waiting time, the number of stops in the queue unused green time of conflicting traffic and green/red waves between intersection. The relations between these four factors and the perceived waiting time are described in this section. Also the other factors presented in chapter 3 are analyzed. However, as expected in figure 3.4, these factors do not have a significant influence on the PWT, and are therefore not described in this section.
5.2.1 Actual waiting time
The PWT is an indicator of the users‟ perception of signalised intersections; it explains how car drivers experience their waiting time before a traffic light. Therefore, it is obvious that there is a strong relationship between the actual and perceived waiting time.
B. van der Bijl
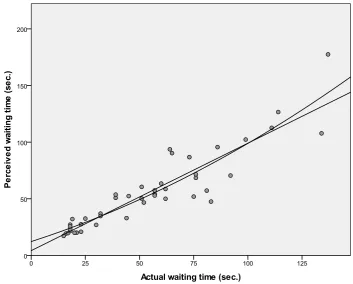
Figure 5.1: The mean actual and average perceived waiting time per movie with models: a linear model (R2=0,833) and a quadratic model (R2=0,842)
The quadratic relation between the actual and perceived waiting time is described with the following model:
(5.1)
Where:
= Predicted mean perceived waiting time per movie
= Actual waiting time = Coefficient
[image:31.595.114.468.70.354.2]With regression techniques the following values for the coefficients are determined.
Table 5.1: Coefficients model 5.1
Coefficient Value Significance
12.236 -
0.616 0.01
B. van der Bijl
5.2.2 Number of stops in the queue
The number of stops in the queue is assumed to be an important factor influencing the PWT. According the figure 3.4, more stops are expected to result in a higher PWT. In the literature car drivers state that is important to pass the intersection in one cycle and it is annoying when the green phases are too short to handle all the traffic (section 3.2.2).
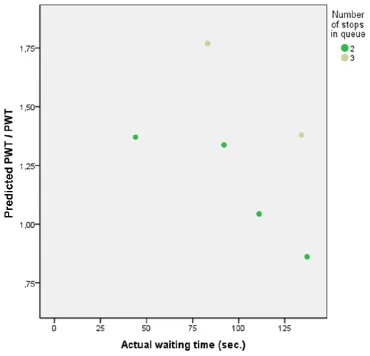
From the 44 movies in the survey, 6 movies show a situation where multiple stops in the queue are made. As figure 5.2 shows, the influence of multiple stops on the PWT depends on the actual waiting time. With a lower actual waiting time the expected PWT is higher than the measured PWT, while with a longer actual waiting time the expected PWT is lower.
[image:32.595.83.454.290.646.2]According to this analysis, the and -coefficient in model 5.1 have to be adjusted with the the number of stops. If more stops in the queue are made the expected PWT is lower, and a longer actual waiting time results in a larger reduction of the expected PWT.
Figure 5.2: the ratio of the predicted PWT (model 5.1) and the measured PWT in relation with the number of stops and the actual waiting time.
5.2.3 Unused green time conflicting traffic
B. van der Bijl
[image:33.595.87.521.148.501.2]Figure 5.3 shows the results of the survey regarding the unused green time. According the survey, there is no relation between the PWT and the unused green time. The ratio between the expected PWT (model 5.1) and the measured PWT is not influenced by the unused green time of conflicting traffic.
Figure 5.3: the ratio of the predicted PWT (model 5.1) and the measured PWT in relation with the unused green time of conflicting traffic.
5.2.4 Red wave
According to section 3.2.4 green waves between intersections have a positive influence on the users‟ perception. Therefore a red wave between intersections is expected to have a negative influence on the PWT. If a car driver has to stop at two adjacent intersections, the PWT on the second intersection is expected to be higher.
Figure 5.4 shows the outcomes of the survey regarding green and red waves. When there is a red wave and the actual waiting time is short, the measured PWT is higher than the expected PWT from model 5.1. On the other hand, when the actual waiting time is longer, the PWT is lower than the expected PWT.
B. van der Bijl
[image:34.595.84.502.107.451.2]intersections, at low actual waiting times the PTW is higher while at longer actual waiting times the PWT is reduced.
Figure 5.4: the ratio of the expected PWT (model 5.1) and the measured PWT in relation with the actual waiting time and the red/green waves
5.3 Perceived waiting time - model
In section 5.2 the influence of several factors on the PWT is discussed. Based on this discussion the following model 5.2 is retrieved. This model knows a quadratic relationship with the actual waiting time (section 5.2.1), which is similar to the model of Wu et al. (2009). The coefficients of the quadratic model are modified to implement the number of stops and the presence of a red wave (sections 5.2.2 and 5.2.4).
B. van der Bijl
(5.2)
Where:
= Expected perceived waiting time
= Actual waiting time
= Number of stops in the queue
= Red wave, 1 if there is a red wave else 0 = Coefficient
[image:35.595.202.393.308.443.2]Regression analysis is performed to calibrate model 5.2. The coefficients have the following values.
Table 5.2: Coefficients model 5.2
Coefficient Value Significance
13.859 -
17.254 0.11
0.661 0.00
-0.233 0.00
-0.432 0.03
0.006 0.00
The of this model is 0.907, and all variables are significant on the 0.1-level. This model describes the PWT of car drivers good, and can therefore be used as an indicator of the users‟ perception of signalized intersections. Figure 5.5 shows the outcomes of model 5.2 for different situations.
[image:35.595.113.486.535.750.2]B. van der Bijl
5.4 User acceptance – model
As mentioned in section 4.6, after most movies the question is asked if the respondents consider their waiting time in the movie as acceptable or not. This information is used to determine if the PWT according model 5.2 is acceptable or not.
The user acceptance of car drivers is a binary measurement, the waiting time is either acceptable or not. However the mean user acceptance per movie is not binary anymore. When acceptable is equal to 1, and not acceptable 0, the user acceptance of a movie could be 0.5 when half of the respondents consider the waiting time acceptable.
To meet the binary nature of the user acceptance, a Sigmoid-function (Menon, Mehrotra, Mohan and Ranka, 1996) is used to describe the acceptance:
UA =
(5.3)
Where:
= Estimated user acceptance
= Estimated perceived waiting time = Coefficient
[image:36.595.234.362.488.555.2]With the following values for the coefficients the is 0.85.
Table 5.3: Coefficients model 5.3
Coefficient Value
-3,650
0,055
B. van der Bijl
Figure 5.6: The outcomes of model 5.3 and the predicted PWT (model 5.2) per movie (1=acceptable, 0=not acceptable).
5.5 Validation
The models presented in sections 5.3 and 5.4 are based on the results of the online video survey. Both models predict the outcomes of the survey with high certainty, and are therefore considered as good models. However, it is important that the models predict the PWT and UA of real car drivers and not that of the respondents of the survey.
The local authorities of Helmond and Den Bosch were asked for an overview of complaints from car drivers in the Utopia-network in both cities. These complaints can be compared with the results of simulation-studies in both cities (see also chapter 7). If high perceived waiting times are measured in the simulations on the same spots as described in the complaints, the models can be assumed to be correct.
B. van der Bijl
An alternative way to validate the models is to perform a real-world experiment (see section 4.2). Car drivers are asked to drive a predetermined route while are surveyor is sitting in the vehicle. After each signalised intersection, the car drivers report his perceived waiting time and user acceptance to the surveyor. The surveyor measures the actual waiting time, number of stops and coordination for each intersection.
Car drivers in both Helmond and Den Bosch participated in the experiment. In total 37 situations were analyzed. These situations differ on the actual waiting time, number of stops in the queue and coordination between intersections. The results are included in Appendix E.
The fitness of the model for the perceived waiting time (see section 5.3) is calculated for the results of the experiment. This fitness is expressed as a of 0.870, which means that the model is a good representation for the real-world perceived waiting time. Also in 81% of the cases the outcome of the UA-model meets the user acceptance measured in the real-world experiments.
5.6 Summary
Based on the results of the survey described in chapter 4, the influence of the factors (chapter 3) on the perceived waiting time is analyzed. First a quadratic model between the actual and perceived waiting time is calibrated. This model is used to determine how other factors influence this quadratic relation between the actual and perceived waiting time. The number of stops in the queue and a red wave between intersections have a significant influence on the perceived waiting time.
B. van der Bijl
6
VISSIM
6.1 Introduction
In chapter 5 a model to estimate the perceived waiting time of car drivers at signalised intersections is determined based on the results of the conducted online video survey. The objective of this study is to determine a method to evaluate the PWT a priori of implementing a TLC-system. As described in section 2.3.2, this evaluation can be performed using the traffic-simulator Vissim.
This chapter describes the development of an application to evaluate the PWT in Vissim using the COM-Interface. First the basic operations of Vissim and its COM-Interface are described. Secondly the application itself is presented, and in section 6.4 the main algorithm of the application is described.
6.2 Vissim and the COM-Interface
Vissim is a stochastic microscopic simulation model capable of simulating traffic operations in urban areas with emphasis on public transport and multi-model transportation (Vélez, 2006). The main abilities of Vissim are:
Realistic representation of traffic flow of cars, truck, buses and light rail systems Implementation of a psycho-physical car-following model, an thus, provides a very
realistic driving behaviour
Assessment of traffic operations along many different types of road network parameters
[image:39.595.150.449.552.703.2]The simulation package of Vissim consists internally of two different parts (PTV, 2009). The traffic simulator is a microscopic traffic flow simulation model including the car following and lane change logic. The traffic light controller (TLC) is a signal control polling detector information from the traffic simulator on a discrete time step basis. It then determines the signal status for the following time step and returns this information to the traffic simulator (figure 6.1)
Figure 6.1: Communication between traffic simulator and signal state generator in Vissim
B. van der Bijl
[image:40.595.149.442.123.430.2](e.g. speed of a vehicle) and to adjust the properties (e.g. the signal group state). Making use of the COM-Interface it is for example possible to generate extra output to apply other control algorithms. Figure 6.2 illustrates the communication model of Vissim with the COM-Interface.
Figure 6.2: Communication model of Vissim with the COM-Interface
6.3 The perceived waiting time in Vissim
An external application is developed to measure the perceived waiting time (PWT) and user acceptance (UA) in Vissim. This Visual Basic application communicates with Vissim using the COM-Interface (see section 6.2).
[image:40.595.199.395.538.731.2]B. van der Bijl
For every vehicle in the simulation, the application calculates the PWT and UA using the algorithm described in section 6.4. As output from Vissim, the position and speed of the vehicles are used as input for this algorithm. The position is used to determine the intersection the vehicle is approaching, and the speed is used to calculate the waiting time and number of stops per intersection. The position and speed together are used to determine if there is a red or green wave between intersections.
The application knows three types of output.
At the end of the simulation an excel-file is generated with all measured data per vehicle per intersection. This file contains information like the number of stops, the waiting time, the user acceptance and the perceived waiting time, and can be used to make an ex-post evaluation of the simulation.
During the simulation it is possible to select a vehicle by entering its ID in the application. For that vehicle the application shows the current measurements, which are updated every time step (figure 6.4). This method is, for example, useful when you want to know the PWT of a vehicle in a particular situation.
B. van der Bijl
Figure 6.4: The application and Vissim. The blue vehicle is the selected vehicle; its properties are shown by the application. The other vehicles are coloured by their PWT (black vehicles are not a car).
6.4 Algorithm
An extern Visual Basic application is coded to calculate the PWT and UA during a simulation in Vissim. As explained in section 6.2 this application communicates with Vissim using the COM-Interface. Via the COM-interface the application is capable to read and change the properties of objects.
B. van der Bijl
START
Next vehicle
Vehicle type is car?
Read link and linkcoordinate
Determine XP and SG from DB
Read vehicle speed V
If Stops = 0
if Stops > 0
if V<5
if Standstill = 0
V<5
if Standstill = 1
V<5
if Standstill = 1
V>10
Stops = 1 WT=1
Standstill = 1 WT+1 Stops+1
Standstill = 1 WT+1
Standstill = 0
If Green wave expected
Stops > 0 AND Stops last XP > 0
? RW=0 Last vehicle else else Calculate PWT and UA Last vehicle? Next timestep RW = 1
[image:43.595.114.457.61.669.2]yes yes yes no no no yes no no yes
B. van der Bijl
The algorithm is executed every time step (1 second) for every vehicle that is a car. First the position (link and linkcoordinate) are retrieved from Vissim. From a database the application knows which intersection (XP) and signal group (SG) the vehicle is approaching.
According the Vissim (PTV, 2010), a vehicle stands still if each speed is below 5 km/h and a new stops is registered if its speed has been above 10 km/h, and drops again below 5 km/h. In the algorithm these definitions are used to measure the waiting time and number of stops at each intersection.
A second database is used to determine if coordination between the previous XP and SG, and the next XP and SG is expected. If coordination is expected, and at both intersections the vehicle made a stop, the parameter RW is 1. In all other cases this parameter is equal to 0.
Finally the perceived waiting time and its acceptance are calculated according the models in sections 5.3 and 5.4.
6.5 Summary
In this chapter the models for the perceived waiting time and user acceptance (chapter 5) are implemented in Vissim. An external application is developed in Visual Basic. This application is able to read vehicle properties (speed and position) from Vissim, and calculates per vehicle the PWT and UA.
B. van der Bijl
7
SCENARIO ANALYSIS
7.1 Introduction
In chapter 5 two models were introduced. The first model predicts the perceived waiting time of car drivers, and the second model calculates the probability if this perceived waiting time is acceptable or not. The application discussed in chapter 6 is used to evaluate the perceived waiting time for different TLC-systems and configurations.
First, two different TLC-systems are described: a solitaire intersection control and Utopia. Secondly the networks of Den Bosch and Helmond, in which these TLC-systems are operational, are described. Finally, the user acceptance of both systems and of different configurations of Utopia are compared with each other.
7.2 TLC-systems
7.2.1 Solitaire intersection control
A solitaire traffic light controller controls one intersection without cooperating with other intersections. There a two types of solitaire controllers: fixed-timed and vehicle actuated controllers. In the Netherlands mostly vehicle actuated controllers are used.
Vehicle actuated controllers respond to the current traffic situation. This allows the length of green phases to differ over time, and not all signal groups are required to get green each cycle. To respond to the traffic situation, it is important the controller knows the current traffic situation. For this purpose, generally induction loops in the road surface are used. These detection loops register if there is a vehicle present above the loop. There are two kind of loops: stopline and approach detectors (figure 7.1).
B. van der Bijl
Figure 7.1: Overview of a signalised intersection with detection loops
7.2.2 Utopia
The technical reference manual of Utopia (Mizar, 1998), describes the principles of Utopia. Because of the importance of understanding the principles behind Utopia, the next passage is extracted from the manual.
Utopia (Urban Traffic Optimisation by Integrated Automation) is a specific concept designed to improve urban travel conditions by the application of fully automated control principles. Utopia control strategies aim to reduce the total time lost by private vehicles during their trips within the controlled area,
The Utopia architecture is hierarchical and decentralised: optimal control strategies are determined at the higher level on the basis of area traffic prediction, while traffic light control is actuated at the lower level according to the actual traffic conditions encountered at the intersections. This type of architecture requires a communication network between intersections and the connection of some nodes of the network to the control centre.
B. van der Bijl
A strong interaction principle is implemented by taking into account the time lost at the downstream intersections by vehicles leaving the central zone;
A look-ahead principle is implemented by taking into account traffic forecasts defined on the whole optimization horizon (120 sec) for all the central intersection‟s incoming links.
At the intersection level a local control unit operates for each traffic light intersection and interacts with the neighbouring local control units and with the area level. The intersection controller determines the signal settings to be applied to the traffic lights. It operates by optimizing a suitable function adapted to the current intersection traffic situation. Optimization is performed on the time horizon of the next 120 seconds and is repeated every three seconds.
In order to guarantee the optimality and robustness of control at the network level, the functional optimized the controller has been designed to apply the strong interaction concept. This requires the functional to take into account the station of neighbouring intersections.
The functional is defined by the sum of different weighted costs elements calculated on the whole optimization horizon. The optimization function finds a value for:
Where:
- is the cost of the delay of vehicles on incoming links.
- is the cost of the delay of vehicles on outgoing links. This cost actuate the strong
interaction between intersections.
- is the cost of delay of public transportation.
- is the cost of vehicles exceeding the maximum queue length on incoming links. This
cost takes into account queues exceeding safety thresholds which are proportional to the maximum capacity on links.
- is the cost of vehicles exceeding the maximum queue length on outgoing links.
- is the cost for stopped vehicles on incoming links - is the cost for stopped vehicles on outgoing links
- is the cost for stopped public transport vehicles
B. van der Bijl
7.3 Cities
7.3.1 Helmond
[image:48.595.73.538.173.380.2]In Helmond, over 40 intersections are controlled by Utopia. One of the characteristics of this network is the strong coordination between intersections of the main roads. A small sub-network of five intersections is chosen in this study.
Figure 7.2: Overview of the Helmond network in Vissim
The Utopia-network in Helmond is configured to improve the flow on the main roads. Therefore, there is strong cooperation between the intersections of the main roads (intersection 101 to 103). This cooperation is expressed by the average number of 1.5-2.2 stops per vehicle on the main road between intersection 101 to 104 (van der Bijl, 2008). In addition, strong cooperation on the main road results in relatively high waiting times on the side roads.
Intersection 104 is accommodated with a train passage. When a train is in approaching the station, or haltering in the station, the train passage is closed. This results in long waiting times (up to 5 minutes) for signal groups crossing the train passage.
7.3.2 Den Bosch
The Utopia-system in Den Bosch is designed with high priorities for non-motorised traffic. Instead of optimizing control for motorized traffic, most attention is given to bicycles and pedestrians. With the last major upgrade in 2007, the average delay times for bicycles were reduced by 40-50%, and for pedestrians with 20-30% (De Jong, 2007).
B. van der Bijl
Figure 7.3: Overview of the Den Bosch network in Vissim
In the peak periods, the network is oversaturated (de Jong, 2007). Because the intersections are designed with short cycle times, the high saturated state result in long waiting time with multiple stops per intersection. However, in the off-peak hours the average delay is reduced by almost 70%, which means that both the waiting times as the number of stops in the queues are reduced.
B. van der Bijl
7.4 Scenario analysis
In this section the solitaire control and different configurations of Utopia are compared. For the different TLC-systems the user acceptance is evaluated. This indicates how the scenarios are perceived by car drivers.
7.4.1 Helmond
In Helmond the intersection can be controlled by solitaire controller and by Utopia. When the network is controlled by Utopia, the public transport vehicles (busses) are handled with conditional priority. Depending on their delay, more or less priority is given to the busses. In this section thr