With 1 text-figure Printed in Great Britatn
THE RELATIONSHIP BETWEEN BLOOD IONS AND
BLOOD-CELL DENSITY IN INSECTS
BY JOHN BRADY*
Zoological Laboratory, University of Cambridge
(Received 3 May 1967)
INTRODUCTION
The tissues of insects are bathed freely in haemolymph, and the relationship between the ionic composition of the blood and the tissues has proved a fruitful field of research. In particular, much work has been done on the mechanisms of nerve-impulse conduc-tion (see Narahashi, 1963) and osmoregulaconduc-tion (see Shaw & Stobbart, 1963) in relaconduc-tion to ion levels in the blood. Insect haemolymph is physiologically different from verte-brate blood in many respects, the most obvious being that it performs no respiratory function and contains no equivalent of the erythrocytes. A result of this is that whereas human blood contains about 5,000,000 cells/^l. and these occupy nearly 50% of the total blood volume, insect blood usually contains less than 100,000 cells//il. and in many species less than 10,000 cells/^l. (Tauber & Yeager, 1935, 1936). Presumably because of these comparatively low blood-cell densities most insect physiologists have treated whole-blood measurements of the concentration of ions in insect blood as if they were identical with the physiologically significant concentrations in the plasma.-f Some authors, indeed, have explicitly stated that this must be the case. For instance, van Asperen & van Esch (1956) say that only small differences could be expected between the whole haemolymph and plasma of their cockroaches because the blood appeared clear and only contained 67,000 cells//il.
Tobias (1948 a) appears to be the only author to have attempted a direct investiga-tion of this problem. The work of Ramsay (1955) on Carausius 'serum' is not strictly relevant since he prepared this by centrifuging blood previously heated to ioo° C. At this temperature it must be assumed that the cell membranes were broken down and that all soluble cell contents released. Tobias, on the other hand, measured sodium, potassium and magnesium in Periplaneta in both whole blood and in plasma prepared by spinning off the haemocytes in micro-centrifuge tubes. On a molar basis the plasma contained about 40 % less of each ion than did the whole blood, but he states that the differences were not statistically significant, and apparently pursued the matter no further. Van Asperen & van Esch (1956) considered that these results were 'quite inexplicable', a view reiterated by Pichon (1963). However, haemocytes can occupy up to 10% of the total blood volume of heat-fixed cockroaches (Wheeler, 1963), and tissue concentrations of potassium, at least, can be more than ten times that of the
• Present address: Houghton Poultry Research Station, Houghton, Huntingdon, England. f The term' plasma' is used throughout this paper in the sense of the mammalian physiologist, i.e. to indicate the fluid component of the blood. For simplicity the word is also retained to denote the fluid separating from the cellular fraction after centrifugation or coagulation since in insects this bears little relation to vertebrate serum.
blood (see Table 3), so there appears to be some basis for Tobias's results. Since the implications for the study of ion-gradient systems in insects would be considerable if Tobias's data were confirmed, the problem appeared worth re-investigating.
METHODS
Material
The adult male and female Periplaneta americana used in this study were taken from stock cultures of this species maintained at the Zoological Laboratory, Cambridge. They were kept in large tanks at about 25 ° C and reared on whole crushed oats, apple and water, ad libidum.
{a) Procedure Ion measurements
Blood samples for ion determinations were collected into micropipettes direct from small holes cut (with a clean chip of razor blade) in the articulation membranes at the posterior side of the coxa, the cockroach being held down on its back, with its legs flexed forward, in Plasticine. The pipettes were made from hand-drawn capillary and were about 5 /A. in capacity, their volume having been previously determined to the nearest 0-5 %. This calibration was performed by lining the inside of the pipette with a silicone film (removed afterwards) and weighing five replicated fillings of distilled water on a 10 mg. torsion balance.
When filled with blood the pipette was withdrawn from the cockroach, the clotted blood was wiped from its exterior surface at the distal end with clean paper tissue, and the contents were blown into 10 ml. of glass-distilled water in a polystyrene specimen tube. In order to remove, or at least to lyse, any cells adhering to the inside of the pipette it was filled and emptied ten times with the distilled water. The specimen tube was then closed with a polyethylene bung and its contents vigorously agitated for about 15 sec. on a mechanical shaker. Tubes awaiting analysis were stored overnight in a refrigerator, or for longer periods in a deep freeze.
Ion measurements were made on a Unicam SP 900 flame-photometer, whose response curves for potassium and sodium had been previously calibrated and found to be linear over the relevant ranges. Tubes were allowed to stand for at least 2 hr. before analysis, to equilibriate with room temperature, and to permit any precipitated protein to settle. Determinations were performed against standard solutions of 0-005 mM K+/1. and 0-05 mM Na+/1. made from deep-frozen stock of 10 mM/1. It was found that the potassium standards changed by as much as 20% over the course of a month, even if kept in polyethylene bottles in the refrigerator, but remained stable under this treatment for about a week. Accordingly, both standards were always made up not more than a day or two before use. The accuracy of the potassium measurements on the flame-photometer is estimated to be approximately ± 0-3 min/l., and of the sodium ±5-0 miw/l. (i.e. about 3% in each case).
(b) Check against contamination
potassium contamination was equivalent to: nil in seventy-eight tubes, less than 0-5 mM/1. in nine tubes, about 1-5 mM/1. in two tubes, and more than 8 mM/1. in three tubes (calculated as if for a blood sample, i.e. as the concentration in one pipetteful of solution).
Analysis of drops of distilled water allowed to stand for 15 sec. on the unpierced coxae of four cockroaches indicated that contamination from the cuticle was very slight, certainly less than 0-5 mM/1. for potassium. No contamination from dust, finger-prints, etc., was detected in blanks which had had no contact with the pipettes. The most likely source of the contamination therefore appears to be the saturated chromic acid in which the pipettes were cleaned. Other cleaning fluids were tried but none were found to be as effective as chromic acid. When this cleaning fluid was prepared from 'Analar' K2Cr207 only potassium contamination was detected in the blanks, whereas if 'technical* KjCr2O7 was used contamination appeared as both potassium and sodium. Advantage was therefore taken of this by preparing the chromic acid from 'technical' K2Cr207, so that any contamination from this source would be apparent in both ions.
The very low level of contamination observed in nine of the ninety-two blanks would certainly have passed unnoticed in the analysis of a blood sample, but this level (< 0-25 mH K+/1. in six of the nine) is quite insignificant in a whole-blood con-centration of about 8-10 mM/1. On the other hand, a level of contamination of 8 or more mM/1. could not go undetected in a blood sample, especially if, as in the three blanks, it was accompanied by sodium contamination of 20-50 mM/1. When grossly elevated potassium and sodium levels of this kind appeared in a blood analysis the sample was discarded—this occurred in less than 5 % of all cases. The problem lies solely in those specimens (two out of the ninety-two blanks) where contamination was neither so great as to be obvious, nor so small that it could be considered insignificant. A low level of such errors (apparently in about 2% of cases) must be accepted as inherent in the results.
(a) Live blood Haemocyte counts
Considerable difficulty was experienced in diluting living blood for haemocyte counts without letting the cells clump (cf. Wheeler, 1963). Time was found to be the most important factor in avoiding this difficulty, and the following procedure worked well in the great majority of cases. A micro-pipette (of about 5 /A.) was filled with 2 % EDTA (disodium ethylenediamine tetra-acetate) solution and the contents were ex-pelled gently as a nearly spherical drop onto a siliconed glass slide, kept on moist filter paper in a Petri dish. The still wet pipette was immediately placed against the coxal membrane of a cockroach, a chip of razor blade brought up with the other hand, and the coxa was pierced beside the end of the pipette. As soon as the blood filled the pipette, which it normally did almost instantaneously, the contents were expelled gently into the (equal volume) drop of EDTA solution without spluttering, and stirred vigorously by blowing a stream of air out of the pipette so that the drop rotated rapidly. If this procedure was completed in less than 10 sec. little or no clumping took place; it was normally done in about 5 sec., but could be done in less than 3 if the cockroach was full of blood.
Thoma pipette with a further volume of 2 % EDTA to a total dilution of 1140 and shaken by hand vigorously for 30 sec. The first few drops were discarded, the end of the pipette was wiped and then one chamber of a double haemocytometer was filled; a few further drops were expelled and then the second chamber was filled. Cell counts, using phase contrast, were made on a single 1 mm. square in batch A (see Fig. 1 and Table 1), and in ten 1 mm. squares (the four corner squares and the single centre square of each chamber) in batches B and C. If clumping occurred in the initial mixing with EDTA the specimen was discarded. This normally happened only with high haemocyte densities (i.e. > 50,000 cells//il.) so that a certain bias existed against the inclusion of data from such specimens. This has no relevance to the present study, however.
When paired samples were taken (for matched cell count and ion analysis) the drop of EDTA-diluted blood was left in the closed Petri dish while a second pipette was filled with blood for the ion determinations. This second sample was expelled into its tube of distilled water within about 1 o sec. of completing collection of the cell-count sample. The latter was then restirred before being taken up in the Thoma pipette.
(b) Fixed blood
Cockroaches were 'fixed* by immersing them in water at 60-65° C. for 30 sec. At higher temperatures some of the plasma proteins were apparently precipitated, but at 65 ° C. virtually no solid matter—other than cells—was detectable in the blood when examined under the microscope (using x 400 and phase-contrast). Blood cells from fixed animals did not clump in any way and could be drawn directly into the Thoma pipette for dilution with EDTA solution; ten 1 mm. squares were counted as above. When combined haemocyte counts and haematocrit measurements were made the blood for cell counting was collected half-way through the procedure of filling the haematocrit tube.
Haematocrit measurements
A column of between 4 and 12 cm. of heat-fixed blood was sucked into hand-drawn, siliconed capillary tubing. One end of the tube, away from the blood, was rapidly sealed with a small blow torch in such a way that the end of the tube was nearly flat internally. This tube was then mounted in a block of plastic foam and centrifuged at about 2300 g for 5 min. The proportion of pellet to the whole specimen was measured to ± 0-05 mm. (= ca. ± 2 % of the pellet) with a travelling microscope. Variations in bore of the capillary were suitably corrected from measurements of the cross-sectional area at the top, middle and bottom of the blood specimen; the tube was cut at these points with a diamond and the mean internal diameters measured on a microscope at a magnification of x 100 using an eyepiece graticule.
RESULTS
Regression analysis of matched cell counts and ion determinations
second for ion determination. In batch A fifteen animals were used and each sampled in duplicate once; in batch B four animals used and each sampled in duplicate 5 or 6 times; in batch C five animals used and each sampled 1 to 3 times. Repeat collections of pairs of matched samples on individual animals were separated by 3-6 days in batch B and 2 days in batch C. The influence of repeatedly sampling one animal is not of direct relevance in the present study which is only concerned with the relationship between blood ions and haemocyte density at any given time.
14
12
10
_ A
I i 1 i 1 i (
170 160
150
140
n n
) 20
A
-I -I
40
•
60 a
i i
20 40 6 0 8 0 0 20 4 0 6 0 8 0 0 Haemocyte count in iooo cells//il. of blood
[image:5.451.65.384.174.416.2]20 60
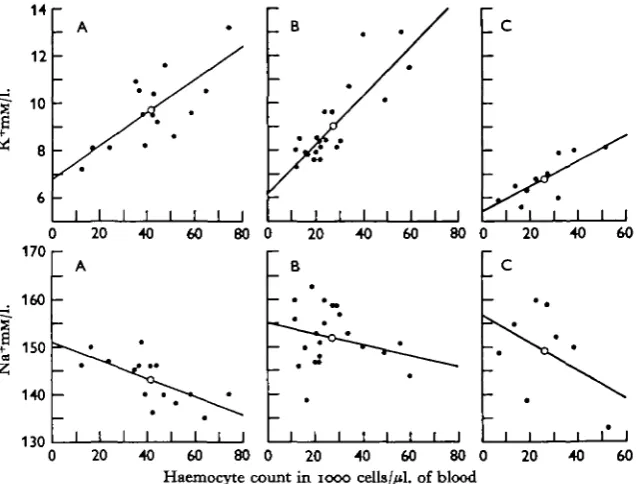
Fig. 1. Potassium and sodium concentrations in whole-blood analyses plotted against the haemocyte counts from matched samples. Three batches (A, B and C) of cockroaches were examined. Upper row of figures are for potassium, lower row for sodium. Ordinates = whole-blood ion concentrations in mM/l. Abscissae = haemocyte counts in iooo cells/jitl. of whole-blood; Dots = individual values, open circles = means for each batch with the regression line drawn to the Y-axis intercept (see Table i).
The ion concentrations plotted against the haemocyte counts are shown separately for each batch of animals in Fig. 1. Regression analysis of these data, on the principle of least squares, shows that in each batch there is a significant positive correlation between cell count and whole-blood potassium concentration (see Table 1). Similar analysis for sodium suggests a negative correlation with cell count, but this correlation is significant in batch A only (Table 1). The scatter could be due to a number of fac-tors, including variations in the ion levels of the plasma of different animals, and the cell densities not being identical in both samples of a matched pair. In batch A there is also a statistical error introduced by counting rather small numbers of cells, around 50-100, as opposed to around 500-1000 in batches B and C.
coefficient according to the reciprocal of its variance (Yates, i960). For potassium the result is a coefficient of +0-83 + 0-09, and for sodium a coefficient of —1-6910-52. It is not strictly correct to calculate fiducial limits for weighted means, but on the basis that N = 45 both of these coefficients differ significantly from zero (Table 1).
Table 1. Summary of regression analysis data from plotting whole-blood potassium and sodium concentrations against haemocyte count
Batch Ion no. K+ A B C Totals and means Na+ A B C Totals and means No. of animals IS 4 5 *• 15 4 5 M No. of matched samples IS 2 1 1 0 46 15 2 1 8 44 Y-axis intercept (±S.E.) (mM/1.) 6-8 ± 0 3 6-2±O-2 5'4±°-2 6 1 i5i-o±i-o i55-o±i"3 is6-8±3-3 1540 Regression coefficient (±s.B.) of the ion
concentration for 10,000 cells//il. (mM/1.)
+ o-7o±o-io + i-O4±o-i3 + o-s6±o-i9
+083 ±009
-1-87 ±063 —1-03 ± I-OI -2-75 ±2-44
-i-69±O53
9 5 % confidence limits
of regression coefficient
+ 0-29 to + I - I I + 0-76 to +1-32 + 0-13 to +0-99 + 0-64 tO +1-03
- 3 23 to - 0 5 1 — 3-14 to + 1 0 8 — 8-72 to +3-22
-3-73 to -0-65
Mean coefficients calculated from weighting batch coefficients by tv = I/S.B.*;S.E. of mean = (Yates, i960).
Mean Y-axis intercepts calculated from weighted mean coefficients and overall means of X and Y. Confidence limits of mean coefficients estimated on assumption that t = 2-0.
It is also theoretically possible to calculate the mean coefficients by computing the least squares of all forty-six determinations as a single set of data. Inspection of Fig. 1, however, suggests that the general level of potassium in batch C is lower than in A or B, and analysis shows that its Y-axis intercept is, indeed, probably significantly less than that of series B (P < 0-05), though A and B do not differ significantly. The reason for this difference is obscure, but it may derive from some undetected error in the flame photometer on the day when the analyses of batch C were performed, or possibly from unknown differences in the maintenance of the animals during the week or so between removal from the stock tank and collection of samples. Whatever the cause, any lumping of the potassium data would clearly be liable to bias unless some adjustment were made to take account of the differences in intercepts. If this is done by bringing batches A and C level with batch B according to the differences between the intercepts, the resultant coefficient is +0-72 + 0-11 which is not signi-ficantly different from the mean derived by weighting. Because this manipulation of the data is somewhat arbitrary, and because this paper is directed to finding the greatest likely contribution of the haemocytes to the whole-blood ion levels, the weighted mean of +0-83 is here preferred.
for sodium in batches B and C, however, have distributions which do not differ significantly from random (Fig. 1, Table 1) so that any estimation of a figure for the mean regression must be rather unreliable.
The correlations indicate that the greater the number of haemocytes per unit volume of blood, the greater the whole-blood potassium concentration and the less the sodium concentration. Two possible explanations arise. First, the general one that there is some factor which simultaneously promotes a high cell count and causes a high potas-sium and low sodium concentration in the plasma. Secondly, the specific one that the changes in whole-blood ion concentrations are caused by the contents of the haemo-cytes themselves. The latter explanation seems the simplest since it requires the postu-lation of no additional complex hypothetical ion control mechanisms. It is, moreover, inescapable if the haemocytes contain the same sort of ionic make-up as that which is found in other tissues, since these have considerably higher potassium and lower sodium than the blood (see Table 3). The question that therefore arises is whether the regression data indicate reasonable cellular concentrations of potassium and sodium in the haemocytes.
Attempts at direct determination of ions in pure haemocyte pellets or pure plasma were unsuccessful. Because of the extreme rapidity with which cockroach haemocytes release cytoplasmic threads and then clump it proved impossible to separate them from the plasma, when live. A variety of chelating agents, not containing potassium or sodium was tried, also heparin and low temperatures (ca + 2° C), but in no case was a measur-able pellet of intact cells produced. Potassium measurements on the plasma from such attempts were higher than expected, suggesting leakage from the naked cytoplasm issuing from the cells. Instead, the concentration of the ions in the haemocytes was estimated indirectly from the cell volume and the regression coefficients.
Estimation of haemocyte volume
Haemocyte volume had to be measured in heat-fixed blood because it was only possible to produce clean pellets when the cells were killed. Paired haematocrit measurements and cell counts (see Methods) were performed on sixteen animals. The mean volume of the individual haemocytes in each animal was calculated by dividing the haematocrit (i.e. the proportion of the blood occupied by the cells) by the number of cells per /A. observed in the cell count sample collected at the same time. The mean volume of a haemocyte is expressed in /i3, and the results summarized
in Table 2. No significant difference was detected between the sexes (P = 0-5); the mean haemocyte volume of the sixteen animals is 720 + 25 /i3 (95 % confidence limits: 667-773
haemocyte counts, and in any case would probably have been evened out in sixteen specimens.
Direct measurement of the dimensions of haemocytes under a microscope do not provide reliable data upon which to estimate the volume, because the cells are irregu-larly discoid and tend to settle down flat on a slide. However, an attempt at this was made, using an eyepiece graticule and a magnification of x 1250. In each of three cock-roaches the long and the short diameters, in the plane of the slide, were measured in 50 cells selected, as far as possible, at random. The volume was estimated using the formula v = \vabc, where a, b and c are the three semi-radii of the assumed ellipsoid. Observation of cells before they settled indicated that it is reasonable to assume that the shortest diameter (i.e. that normal to the plane of the slide when the cells settled) is between about a quarter and a third of the smaller measured diameter. The mean estimates thus derived from each of the three animals are 590-790 fi3, 550-740 /i3, and
470-630 /i3, respectively. Measurements on the first two animals were of living blood
mixed 50:50 with 2 % EDTA, and on the third of heat-fixed blood. Clearly these estimations are only approximate, but they do indicate that 720 fi3 is at least the right order of size.
Table 2. Summary of haemocyte -volume estimations
Mean volume of Mean no. of Mean haematocrit: individual No. of haemocytes//il. % of blood occupied haemocytes animals in iooo's by haemocytes in fi' Males 10 37 4 2 6 706 Females 6 34-5 2-6 744 Means±s.B. 16 3 6 3 ± 3 ' 3 a-6±o-a
Matsumoto & Sakurai (1956) have published similar measurements of the haemo-cytes of the silk worm (Bombyx mori). In the mid-4th and 5th instars the calculated volume of the 'phagocytes' and 'globulated leucocytes' was about 600-1000 /i3. These
authors apparently assumed that the two smallest diameters were equal, how-ever, so their results are almost certainly over-estimations, but their figures may be taken as being in fair agreement with the present author's. Since differential cell counts on the same species (Nittono, i960) indicate that these two cell types probably comprise more than 90 % of the total, the mean haemocyte volume of the silkworm would appear to be close to that estimated here for the cockroach.
that Wheeler's pellets were better compacted and hence that 720 /i8 is in fact a slight overestimation.
Concentration of ions in the haemocytes
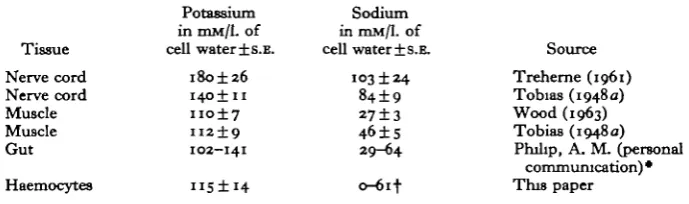
[image:9.451.66.411.231.333.2]If it is assumed that the contents of the haemocytes are solely responsible for the observed correlations, it is possible to estimate the cellular concentration of potassium from the figure for the mean volume of the haemocytes. If 10,000 haemocytes//il. contribute 083 mM K+/1., to the whole-blood concentration then, since the volume of 10,000 haemocytes is 0-0072/41., the concentration in the haemocytes is 0-83 -T- 0-0072 = 115 mM K+/1 of cell water. By comparison with other tissues this is a reasonable level for cellular potassium (see Table 3).
Table 3. The concentration of potassium and sodium in various tissues of Periplaneta
Tissue Nerve cord Nerve cord Muscle Muscle Gut
Haemocytes
Potassium in mM/L of cell water ±s.E.
180 ±26
I4O± 11
no±7 II2±9 102-141
H 5 ± i 4
Sodium in mM/1. of cell water±s.B.
103 ±24 84±9 27±3 46±S 29-64
o-6if
Source Treherne (1961) Tobias (1948 a) Wood (1963) Tobias (1948 a) Philip, A. M. (personal
communication) * This paper • Range of determinations in 3 different sections of the mid-gut of 1 animal, t upper 95 % confidence limit.
The calculation of sodium levels is less certain. If the haemocytes contained no sodium, 10,000 cells//il. would dilute the plasma sodium by 0-72%. The mean sodium concentration in the 44 samples was 148-6 mM/1. and the mean haemocyte count 32,100 cells//il., hence the theoretical maximum regression coefficient is —1-09. The mean observed coefficients were —1-69 or — 2-43 which are greater than this and could therefore imply that not only the whole-blood but the plasma itself is more dilute with respect to sodium when more haemocytes are present. If this is so it means either that plasma is at the same time unchanged with respect to potassium, or that the potassium in the haemocytes is considerably more concentrated than the indicated 115 mM/1. In the absence of any information on this point, and because of the statistical errors apparent in the sodium regression data (see above), it seems safer to assume that the haemocyte density is not correlated with the ion concentration in the plasma itself. The highest estimate of the sodium concentration, calculated from the upper 95 % confidence limit of the weighted mean regression ( — 0-65), then indicates a maximum probable concentration of 61 mM Na+/1. in the haemocytes. This compares with a range of about 30 to 60 mM/1. in muscle and gut cells (Table 3).
DISCUSSION
General implications
potassium is likely to give quite false indications of the amount of this ion physio-logically available. In cockroaches, for example, more than 50% of the whole-blood potassium appears to be sequestered in the haemocytes of some specimens (Brady, 1967). In species where similar whole-blood potassium levels occur, the haemocyte counts (Tauber & Yeager, 1935, 1936) would suggest that in some cases even greater proportions may be involved. By comparison, the effect of haemocytes on whole-blood sodium measurements is likely to be negligible. Even if they contain no sodium, a count of 70,000 cells//il. would only produce a dilution of 5 % in the pure serum, and since comparison with other tissues suggests that they probably contain at least 3omM/l. the maximum effect can scarcely exceed 2-3%. These results are not in conflict with those of Carrington & Tenney (1959) on ion binding in insect blood, since these authors only studied cell-free preparations.
Tobias's results (1948 a), based on separating cells from plasma, are thus only partially confirmed, and two points of confusion remain. First, it is not clear why the sodium level in his plasma should have been lowered by almost exactly the same amount as the potassium (37 and 36%, respectively). Secondly, it proved quite im-possible to prepare plasma from the Cambridge cockroaches by the method which he describes. Perhaps after all the differences were, as he suggests, only the result of random variability.
The effect of wounding
A possible danger which may arise in the course of experiments on cockroaches is caused by the effect of wounding. This was investigated briefly by taking series of samples over a short time-span from single animals. Potassium and sodium levels in whole-blood were measured at 2 hr. intervals in nine cockroaches. In every case the potassium concentration in the second sample was higher than in the first, the mean increase being 2-0 mM/1. (s.E. + 0-3) from a mean initial level of 8-7 ± 0-3 IDM K+/1. in the first samples. By contrast in eight of the nine animals the sodium concentration was lower in the second sample than initially (and in the ninth it had fallen by the third sample). The mean fall in sodium after 2 hr. was 5-8 ± 1-5 mM/1. on a mean whole-blood concentration in the first samples of 134-5 ± °'° m M Na+/1. The mean concentra-tion of neither ion changed significantly after the second sample, a plateau had apparently already been reached by this point, and was maintained virtually unchanged for the next four samples (8 hr.).
they were certainly both smaller and drier than the earlier animals which were no longer available. In any case this calculated rise of 1 -4 mM K+/1. compares with the figure of 1-3 mM/. for the lower 95 % confidence limit of the observed rise in the earlier animals. It therefore appears that potassium analyses made on whole-blood samples taken after the start of an experiment may be subject to even greater discrepancies, vis d vis the physiologically significant concentration in the plasma, than are samples taken at the beginning. Many other factors (e.g. age, nutrition, disease) promote changes in the numbers of circulating haemocytes (Jones, 1962). Such factors may thus materially affect the observed level of whole-blood potassium concentration, and it would seem wise to take account of this when comparing data or planning experiments.
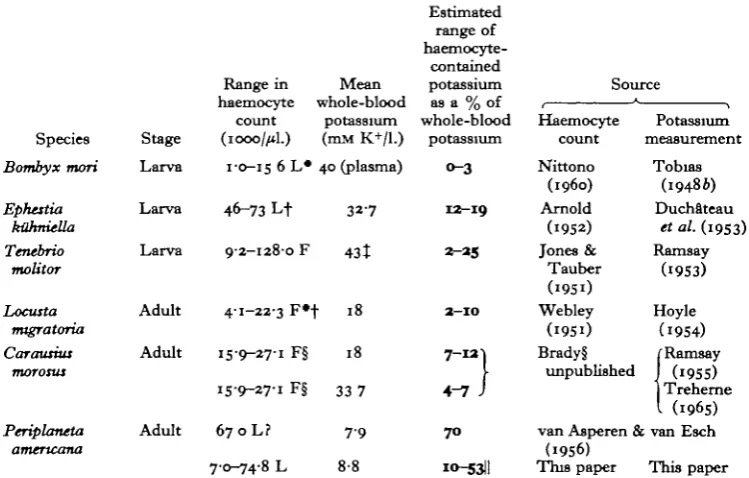
Table 4. Comparative data on haemocyte-contained and
whole-blood potassium in six species of insect
Species Bombyx mori Ephestia kGhniella Tenebrio motitor Locuita tmgratoria Carausius morosus Periplaneta amertcana Stage Larva Larva Larva Adult Adult Adult Range in haemocyte count (iooo//*l.)
1-0-15 6 L#
46-73 Lt
9-2-128-0 F
4-1-22-3 F»+
15-9-27-1 F§
15-9-27-1 F§
67 o L ? 70-74-8 L Mean potassium (mM K+/1.) 40 (plasma) 32-7 431 18 18 33 7 7 9 8-8 Estimated range of haemocyte-contained potassium as a % of whole-blood potassium o-3 13-19 3-35 3-10 7-131
J
7 0 io-53li Source Haemocyte count Nittono (i960) Arnold (1952) Jones & Tauber Webley (i9Si) Brady§ unpublishedvan Asperen &
(i9S6) This paper Potassium measurement Tobias (19486) Duchateau
et al. (1953)
Ramsay (i9S3) Hoyle (i9S4) /•Ramsay 1 (1955) 1 Treherne I (196S) ; van Esch This paper L = live blood; F = fixed blood. Many other sources for the potassium figures are available, most confirm the ones given here (see Florkin & Jeuniaux, 1964).
• Range at different ages, f Range of means. J Mean of two animals § There seem to be no published counts, this range based on five animals. || Individual data from each of forty-six observa-tions (see Table 1).
Comparison with other species
animals used for the haemocyte counts. At least for volume the data for Bombyx (see above) suggest that this assumption is reasonable.
Compared with the cockroach—which has much the lowest whole-blood potassium —the five other species appear to show relatively small proportions of haemocyte-contained potassium. Moreover, there is evidence that fixed blood contains more haemocytes than living blood (see Jones, 1962) so that except for Bombyx and Ephestia these figures may be artificially inflated. However, it must be emphasized that as these results are based on mean potassium concentrations (and in two cases on mean cell counts as well) the range of individual values is likely to be considerably greater than indicated.
CONCLUSION
Correlation does not prove causation, but the simplest explanation of the results is that the contents of the haemocytes are in fact responsible for the observed correla-tions. Though it must be borne in mind that the case is not proved until direct analysis of the haemocytes is successfully performed, the haematocrit data indicate that such a correlation would be inevitable if haemocytes contain similar cellular concentrations to those observed in other tissues. It therefore seems reasonable to suggest for future investigations that some preliminary research may be necessary in order to establish whether the haemocytes contribute significantly to whole-blood levels of the ion under study. Alternatively, in species where it is possible, the plasma should be separated from the cells before analysis. In the case of potassium in Periplaneta, use of un-modified whole-blood data in physiological calculations will probably give rise to appreciable errors in some instances. In herbivorous species where the plasma po-tassium concentration is very high, however, the situation is probably less serious.
SUMMARY
1. Pairs of blood samples were taken from individual Periplaneta americana, the first sample being used for a live-blood haemocyte count and the second (collected
10 sec. later) for potassium and sodium determinations.
2. Analysis of these matched data on cell count and whole-blood ion concentration reveals a positive correlation between the haemocyte density and the potassium con-centration, the mean regression coefficient being +0-83 HIM K+/1. of blood for 10,000
3. Similar analysis of the sodium data gives a negative correlation, with a mean regression coefficient of — 1-69 mM N+/1. for 10,000 cells//il.
4. Haematocrit estimations on heat-fixed blood, whose haemocyte density was simultaneously determined, indicate a mean haemocyte volume of 720 /iz.
5. If the correlations relate entirely to the contents of the haemocytes, comparison with the haemocyte volume would indicate that the cell sap contains 115 mM/1. of potassium and probably less than about 60 mM/1. of sodium; these levels are very similar to those reported for other tissues of the cockroach.
7. Wounding is found to raise the haetnocyte density by up to 4 times; at the same time the whole-blood potassium concentration rises and the sodium falls.
8. A table is given comparing haemocyte counts and potassium levels in the blood of six closely studied insect species, the information having been compiled from different sources in the literature.
This research was supported by the Air Force Office of Scientific Research under grant AF EOAR 65-19 through the European Office of Aerospace Research (OAR), United States Air Force. My thanks are also due to Dr Janet Harker under whose supervision the work was performed, and to Dr J. E. Treherne for much helpful advice and discussion. I am particularly grateful to Dr K. E. Machin for invaluable guid-ance in statistical procedures; the interpretation of the results is, however, entirely my own responsibility.
REFERENCES
ARNOLD, J. W. (1952). The haemocytes of the Mediterranean flour moth, Ephatia kOhmella Zell. (Lepidoptera: Pyrahdidae). Can. J. Zool. 30, 352-64.
VAN ASPEREN, K. & VAN ESCH, I. (1956). The chemical composition of the haemolymph in Pertplaneta americana with special reference to the mineral constituents. Archs nterl, Zool. xi, 342-60. BRADY, J. (1967). Haemocytes and the measurement of potassium in insect blood. Nature, Land. 315,
96-97.
CARRINGTON, C. B. & TENNEY, S. M. (1959). Chemical constituents of haemolymph and tissue in Telea polyphemus Cram, with particular reference to the question of ion binding. J. Insect Pkystol. 3, 402-13. DUCHATEAU, G., FLORKIN, M. & LECLERCQ, J. (1953). Concentrations des bases fixes et types de
com-position de la base totale de l'hemolymphe des insectes. Archs int. Physiol. 6i, 518—49.
FLORKIN, M. & JEUNIAUX, CH. (1964). Hemolymph: composition. In The Physiology of Insecta, 3, 109-152 (ed. M. Rockstein)
HOYLE, G. (1954). Changes in the blood potassium concentration of the African migratory locust (Locusta mtgratoria migratorioides R. & F.) during food deprivation, and the effect on neuromuscular activity. J. Exp. Biol. 31, 260-70.
JONES, J. C. (1962). Current concepts concerning insect hemocytes. Am. Zool. a, 209-46.
JONES, J. C. & TAUBER, O. E. (195 I). Normal total hemocyte counts of Tenebrio mohtor. Ann. ent. Soc. Am. 44,
539-43-MATSUMOTO, T. & SAKURAI, M. (1956). On the volume of the haemocyte in starved silkworm, Bombyx mori L. [in Japanese, English summary]. J. sertc. Sci., Tokyo, 35, 418—22.
NARAHASHI, T. (1963). The properties of insect axons. Advances m Insect Physiology I, 175-256 (eds. J. W. L. Beament, J. E. Treherne and V. B. Wigglesworth), London: Academic Press.
NITTONO, Y. (i960). Studies on the blood cells in the silkworm, Bombyx mori L. [in Japanese, English Bummary] Bull, seric. Exp. Stn, Japan 16, 171-266.
PICHON, Y. (1963). La teneur en ions Na+, K+ et Ca++ de l'hemolymphe de Pertplaneta americana L.; ses variations. Bull. Soc. sci. Bretagne 38, 147—58.
RAMSAY, J. A. (1953). Active transport of potassium by the malpighian tubules of insects. J. Exp. Biol. 30, 358-69.
RAMSAY, J. A. (1955). The excretion of sodium, potassium and water by the malpighian tubules of the stick insect, Dixtppus morosus (Orthoptera, Phasmidae). J. Exp. Biol. 3a, 200-16.
SHAW, J. & STOBBART, R. H. (1963). Osmotic and ionic regulation in insects. Advances in Insect Physio-logy 1, 315—99. (eds. J. W. L. Beament, J. E. Treherne and V. B. Wigglesworth). London: Academic Press.
TAUBBR, O. E. & YEAGER, J. F. (1935). On total hemolymph (blood) cell counts of insects. I. Orthoptera, Odonata, Hemiptera, and Homoptera. Arm. ent. Soc. Am, 38, 229-40.
TAUBER, O. E. & YEAGER, J. F. (1936). On the total hemolymph (blood) cell countB of insects. II. Neuroptera, Coleoptera, Lepidoptera and Hymenoptera. Ann. ent. Soc. Am. 29, 112—18.
TOBIAS, J. M. (1948a). Potassium, sodium and water interchange in irritable tissues and haemolymph of an omnivorous insect, Periplaneta americana. J. cell. comp. Physiol. 31, 125-42.
TREHERNE, J. E. (1961). Sodium and potassium fluxes in the abdominal nerve cord of the cockroach, Periplaneta americana L. J. Exp. Btol. 38, 315-22.
TREHKRNE, J. E. (1965). The distribution and exchange of inorganic ions in the central nervous system, of the stick insect Carausius morotus. J. Exp. Biol. 42, 7-27.
WEBLEY, D. P. (1951). Blood-cell counts in the African migratory locust (Locusta nugratoria migra-torioides Reiche & Fairmaire). Proc. R. ent. Soc. Land. (A) 36, 25-37.
WHEELER, R. E. (1963). Studies on the total haemocyte count and haemoh/mph volume in Periplaneta amencana (L.) with special reference to the last moulting cycle. J. Insect Phytiol. 9, 223-35. WOOD, D. W.((i9O3). The sodium and potassium composition of some insect skeletal muscle fibres
in relation to their membrane potentials. Comp. Biochem. Phytiol. 9, 151-9.
YATES, F. (1960). Sampltng Methods for Censuses and Surveys, 3rd edition. London: Charles Griffith