versus Conventional Spin-Echo Sequences for MR Quantification of
Multiple Sclerosis Lesions
S. Bastianello, A. Bozzao, A. Paolillo, E. Giugni, C. Gasperini, T. Koudriavtseva, E. Millefiorini, M. A. Horsfield, C. Colonnese, D. Toni, M. Fiorelli, C. Pozzilli, and L. Bozzao
PURPOSE: To compare fast spin-echo (FSE) and fast fluid-attenuated inversion recovery (FLAIR) sequences with conventional spin-echo (CSE) MR imaging in the quantification of the number and volume of multiple sclerosis lesions. METHODS: In 30 patients with relapsing-remitting multiple sclerosis, we calculated the total number and volume of lesions detected with each of the three sequences using a semiautomated program. RESULTS: On CSE sequences, we calculated a total of 2583 lesions with a global volume of 836.3 cm3. With FSE sequences, we observed a 16% relative reduction in the number of lesions detected and a 25% relative reduction in global volume as compared with CSE. With fast FLAIR sequences, we detected a significantly lower number and volume of infratentorial lesions, whereas at the cortical/subcortical level the lesions were both more numerous and bulkier than on CSE sequences. Finally, we observed a higher lesion/white matter contrast, a significant reduction in time required for the quantification of lesion load, and a very low interobserver variability in favor of fast FLAIR sequences. CONCLUSION: Despite its limitations in the detection of infratentorial lesions, the fast FLAIR sequence in conjunction with a semiautomated quantification program provides a reliable means to evaluate the total lesion burden in patients with MS.
Index terms: Magnetic resonance, technique; Sclerosis, multiple
AJNR Am J Neuroradiol18:699 –704, April 1997
Multiple sclerosis (MS) plaques are easily de-tected with the use of magnetic resonance (MR) imaging. Conventional spin-echo (CSE) tech-niques are widely accepted as being sensitive for the evaluation and quantification of MS le-sions in the brain (1). Fast spin-echo (FSE) sequences are now in widespread use as an alterative to CSE, as they have the advantage of a considerable reduction in imaging time (2).
However, the shorter acquisition time leads to some subtle differences in image contrast as compared with CSE images (3, 4).
Recently, the fluid-attenuated inversion re-covery (FLAIR) technique was introduced, which combines a long inversion time and a long echo time to provide heavily T2-weighted images in which the signal from the cerebrospi-nal fluid (CSF) is suppressed (5, 6). The main limitation of this technique is a long acquisition time. However, by combining this sequence with fast imaging techniques, the long acquisi-tion time is reduced and images may be ob-tained in less than half the time (7)(J. A. den Boer, P. Salverda, T. R. Peters, et al, “Multislice Turbo-FLAIR in Brain Studies of Multiple Scle-rosis,” In:Book of Abstracts: Society of Magnetic Resonance in Medicine 1993, Berkeley, Calif: Society of Magnetic Resonance in Medicine; 1993:328). Assuming CSE to be the standard of reference for the evaluation of MS lesions, we used a semiautomated intensity thresholding Received August 12, 1996; accepted after revision November 15.
Supported by a grant from the Italian Association for Multiple Sclerosis, AISM/95.
From the Neuroradiological Section (S.B., A.B., A.P., E.G., C.C., L.B.) and the I Neurologic Section (C.G., T.K., E.M., D.T, M.F., C.P.), Department of Neurosciences, University of Rome “La Sapienza” Roma (Italy); the Department of Medical Physics, University of Leicester (United Kingdom) (M.A.H.); and IRCCS Neuromed Pozzilli, Isernia, Italy (L.B.).
Address reprint requests to Stefano Bastianello, MD, Neuroradiological Section, Department of Neurosciences, University of Rome “La Sapienza,” Viale dell’Universita` 30, 00185 Roma, Italy.
AJNR 18:699–704, Apr 1997 0195-6108/97/1804 –0699 ©American Society of Neuroradiology
technique to calculate and compare the number and volume of multiple sclerosis lesions de-tected with FSE and fast FLAIR sequences against those seen with the CSE sequence.
Materials and Methods
Our study cohort consisted of 30 patients with definite relapsing-remitting MS: 19 patients were women and 11 were men, with a mean age of 32.56 8.2 years, mean disease duration of 5.462.7 years, and mean Extended Disability Status Scale (EDSS) (8) score of 2.761.2.
For each patient, all MR examinations were performed se-quentially on the same day within a period of approximately a half hour; patients were not removed from the scanner between studies. All studies were done with a 1.5-T superconductive unit. On a sagittal localizer, 28 interleaved transverse 5-mm-thick sections were positioned with the most central section parallel to a line that joined the most inferoanterior and infero-posterior parts of the corpus callosum. The same section loca-tions were used for all sequences.
The following sequences were performed in each pa-tient: 1) CSE: proton density– and T2-weighted (2000/ 30,90/1 [repetition time/echo time/excitations]) images with a field of view (FOV) of 2503200, a matrix of 2563 205, and an acquisition time of 11 minutes; 2) FSE: proton density– and T2-weighted (2500/23,120/2) images with an FOV of 2503200, a matrix of 2563205, an echo train length of 10, and an acquisition time of 4 minutes; and 3) fast FLAIR: T2-weighted (6559/150/4) images with an inversion time of 2000, an FOV of 2503200, a matrix of 2563205, an echo train length of 19, and an acquisition time of 10 minutes.
The number and volume of MS lesions were calculated on CSE, FSE, and fast FLAIR sequences using a semiau-tomated lesion-detection program (Dispimage, provided by D. Plummer, London, United Kingdom) running on a free-standing computer workstation (Sun Sparc 10, Sun Microsystems, Mountain View, Calif).
Measurements were obtained by using a mouse-con-trolled cursor to click on the perimeter of the lesions on the computer display. The program first examines the image in a region close to where the mouse was clicked to find the strongest local intensity gradient, which it considers to be the edge of the lesion. Then, the program outlines the lesion by following a contour of isointensity from this initial edge point, thus defining the lesion as a region in which the signal intensity is locally above the signal intensity at the initial edge position. This sometimes gives poor results because other structures, such as abutting gray matter, adjacent to the lesion may be equally bright, leading to a contour that moves away from the lesion’s perimeter. When this happens, the lesions are manually outlined by an operator, who moves the cursor to define the lesion’s boundary. Each outline is stored on computer disk before proceeding with automatic determination of the lesion vol-ume, which is computed simply as the area of the lesion multiplied by the section thickness.
For each patient, number and volume of lesions were measured directly from the computer display indepen-dently by two observers. The different sequences were analyzed randomly and at different times. A direct com-parison between the three sequences in the same patient was therefore not possible during all measurements.
In addition, the number and volume of lesions were calculated at different anatomic locations as follows: in-fratentorial; white matter (when located at the level of the supratentorial white matter, with no distinction between periventricular and deep white matter); and cortical/sub-cortical (when located at the level of the supratentorial white matter at the interface between gray and white mat-ter).
The mean time needed to obtain numerical and volu-metric data from each sequence was noted and the inter-rater variability between the two observers was calculated. In a randomly selected sample of MR images, an anal-ysis of the signal intensities of lesions and of the different structures for each sequence was also performed. To avoid partial-volume effect bias, signal intensities were calcu-lated only in those lesions greater than 1 cm in diameter; thus, a total of 40 lesions were studied. The first analysis was the contrast-to-noise ratio (C/N), which is the alge-braic difference between the signal intensity of the lesion and the background intensity of normal-appearing white matter divided by noise, according to the following for-mula: C/N5(SIlesion2SINAWM)/noise, where SI indicates
signal intensity and NAWM indicates normal-appearing white matter. Subsequently, and for the same regions of interest, we measured the contrast ratio (C/R), according to the following formula: C/R 5 (SIlesion 2 SINAWM)/
SINAWM.
Quantitative data analysis was performed using Stu-dent’sttest for paired data. The times needed to evaluate numerical and volumetric data were also analyzed by Stu-dent’sttest for paired data. The interrater agreement be-tween the two observers was calculated according to the method described by Filippi et al (9). The difference in lesion C/N and C/R between the three sequences was investigated using Student’sttest for paired data.
Results
Measurement of MS lesions on CSE se-quences revealed a total of 2583 lesions and a volume of 836.3 cm3. These values were taken as the standard of reference and compared with data obtained from the FSE and fast FLAIR sequences. The FSE sequences showed a total of 2159 lesions with a total volume of 626.1 cm3, representing a significant reduction in the number (16%;P,.005) and volume (25%;P,
vol-ume), although these differences were not sta-tistically significant (Table 1).
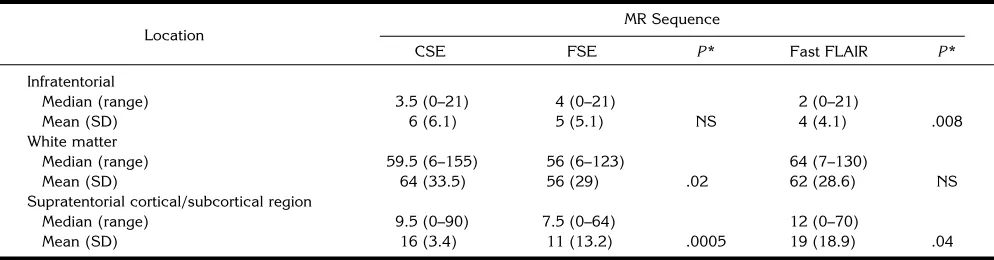
The medians and means for the number and volume of lesions in the three anatomic sites considered are shown in Tables 2 and 3, respec-tively. In infratentorial lesions, a nonsignificant difference in the number and volume of lesions was seen with FSE, whereas a significant de-crease in number and volume was observed on the fast FLAIR sequences (P , .008 and P ,
.02, respectively). For lesions located in the white matter, a significant decrease in the num-ber and volume of lesions was present on FSE sequences, whereas no significant change was noted on the fast FLAIR images. The number and volume of cortical/subcortical lesions were significantly higher on fast FLAIR sequences (P , .04 and P , .03, respectively), but there was a significant reduction in number and vol-ume (P , .0005 and P , .0002, respectively) when using FSE.
The mean interrater agreement for measure-ments of the number of lesions was 96% (range, 93% to 98.5%) for CSE, 92% (range, 88% to 95%) for FSE, and 98% (range, 98% to 100%) for fast FLAIR. For lesion volume, the agree-ment was 95% (range, 91% to 98%) for CSE,
91% (range, 87% to 94%) for FSE, and 99% (range, 98% to 100%) for fast FLAIR.
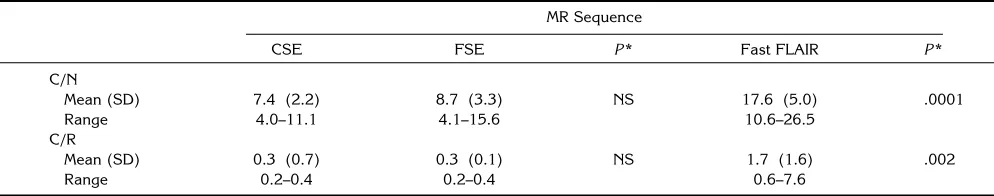
Lesion/white matter C/N and C/R are shown in Table 4. Both these ratios are significantly higher for the fast FLAIR images than for the CSE and FSE sequences, while there were no significant differences between CSE and FSE.
The mean time needed to complete quantifi-cation of a single MR imaging examination us-ing the semiautomated procedure was 51 min-utes (SD, 12.6) for CSE images, 52 minmin-utes (SD, 13.8) for FSE images, and 34 minutes (SD, 9.2) for fast FLAIR sequences. These data show a significant reduction in time when fast FLAIR is used (P , .05), while there were no significant differences between CSE and FSE.
Discussion
[image:3.587.50.551.97.197.2]CSE sequences are considered the standard of reference in the evaluation of the natural evo-lution of MS and in long-term therapeutic trials (1, 10). Serial MR images may be evaluated by counting the number of hyperintense areas, al-though, increasingly, quantification of lesion volume provides a more meaningful measure. The use of semiautomated techniques helps to
TABLE 1: Number and volume of lesions in patients with relapsing-remitting MS
MR Sequence
CSE FSE P* Fast FLAIR P*
No. of lesions
Median (range) 70 (9–224) 66.5 (8–183) 82 (8–183)
Mean (SD) 86 (52.9) 72 (42.4) .005 86 (46.2) NS
Volume of lesions, cm3
Median (range) 21 (1.4–81.6) 15 (1.1–68.8) 20 (1.2–77.9)
Mean (SD) 28 (22.3) 21 (17.8) .0001 26.5 (21.1) NS
Note.—CSE indicates conventional spin-echo; FSE, fast spin-echo; FLAIR, fluid-attenuated inversion recovery; and NS, not significant. *ttest: FSE versus CSE, and fast FLAIR versus CSE.
TABLE 2: Number of lesions at different anatomic locations
Location
MR Sequence
CSE FSE P* Fast FLAIR P*
Infratentorial
Median (range) 3.5 (0–21) 4 (0–21) 2 (0–21)
Mean (SD) 6 (6.1) 5 (5.1) NS 4 (4.1) .008
White matter
Median (range) 59.5 (6–155) 56 (6–123) 64 (7–130)
Mean (SD) 64 (33.5) 56 (29) .02 62 (28.6) NS
Supratentorial cortical/subcortical region
Median (range) 9.5 (0–90) 7.5 (0–64) 12 (0–70)
Mean (SD) 16 (3.4) 11 (13.2) .0005 19 (18.9) .04
[image:3.587.50.547.241.371.2]improve the objectivity of these methods (11– 15).
The fast FLAIR MR imaging technique is an inversion-recovery sequence designed to null or partly reduce the CSF signal (5, 6, 16, 17)(den Boer et al, “Multislice...”), and it is particularly useful in detecting subtle changes at the periph-ery of the cerebral hemispheres, at the gray-white matter interfaces, and in the periventricu-lar regions (18). Several investigators have reported a favorable impact of fast FLAIR in the assessment and evaluation of MS lesions, espe-cially when semiautomatic quantification is used (15). The main advantage of fast FLAIR is related to easier identification of MS lesions with its consequently higher intraobserver and inter-observer reproducibility (15).
In contrast to recent findings (15, 18), our study showed a slight reduction in the number and volume of lesions when the fast FLAIR se-quence was used. In fact, the decrease of 0.5% in the number of lesions in our data derives from poorer sensitivity of fast FLAIR in the infraten-torial locations, which was not balanced by the higher sensitivity in cortical/subcortical areas. The greater lesion volume detected by CSE (5%) may be a result of the semiautomatic
method used to quantify the lesion volume. The manual refinement of lesion outlines was done more often for the CSE images than for the fast FLAIR images, because of the better contrast and lesion edge definition in the latter. This may have resulted in an observer-related measure-ment bias on the CSE images. The lower eval-uation time and improved reproducibility for the fast FLAIR images are also by-products of the better lesion contrast.
The significant increase in the number and volume of lesions located at the cortical/sub-cortical interface observed on the fast FLAIR sequences may prove useful when comparing clinical and MR imaging findings. The inclusion of cortical/subcortical lesions may produce a better correlation between clinical disability (EDSS) and total lesion volume than has been found to date. A functional disconnection be-tween components of the cortical/subcortical neural network and/or demyelination affecting white matter tracts could be responsible for clin-ical impairment (19, 20), as observed for cog-nitive dysfunction when compared with total le-sion load on MR images (21, 22). Moreover, the deafferentation of structures below is not nec-essarily accompanied by abnormal signal
inten-TABLE 3: Volume, cm3, of total lesion burden at different anatomic locations
Location
MR Sequence
CSE FSE P* Fast FLAIR P*
Infratentorial
Median (range) 0.7 (0–4.0) 0.6 (0–3.3) 0.4 (0–3.3)
Mean (SD) 0.96 (0.2) 0.87 (0.9) NS 0.66 (0.8) .02
White matter
Median (range) 18.4 (1.2–71.5) 12.6 (0.9–62.2) 17.0 (1.0–74.4)
Mean (SD) 24.9 (20.5) 18.6 (16.6) .0001 23.9 (18.8) NS
Supratentorial cortical/subcortical region
Median (range) 1.0 (0–9.1) 0.8 (0–5.9) 1.6 (0–13.2)
Mean (SD) 2.0 (2.2) 1.4 (1.6) .0002 3.0 (3.3) .03
[image:4.587.53.546.97.228.2]Note.—CSE indicates conventional spin-echo; FSE, fast spin-echo; FLAIR, fluid-attenuated inversion recovery; and NS, not significant. *ttest: FSE versus CSE, and fast FLAIR versus CSE.
TABLE 4: Signal intensity: mean values of C/N and C/R ratios
MR Sequence
CSE FSE P* Fast FLAIR P*
C/N
Mean (SD) 7.4 (2.2) 8.7 (3.3) NS 17.6 (5.0) .0001
Range 4.0–11.1 4.1–15.6 10.6–26.5
C/R
Mean (SD) 0.3 (0.7) 0.3 (0.1) NS 1.7 (1.6) .002
Range 0.2–0.4 0.2–0.4 0.6–7.6
[image:4.587.50.547.272.370.2]sity on MR images, and may thus simulate nor-mal brain parenchyma. In view of these facts, the evaluation of cortical/subcortical lesions, which are well delineated and quantified with fast FLAIR sequences, could be considered more representative of the clinical status and probably more closely related to clinical disabil-ity. Future studies comparing clinical status and MR imaging findings using fast FLAIR se-quences are needed to confirm this hypothesis. The results obtained at the level of the poste-rior fossa were somewhat different. The fast FLAIR sequence detected 54 fewer lesions than the CSE sequence (P ,.008), which is similar to data reported by Filippi et al (15). Although the reason for these results is not clear, one possible explanation might be the relatively long echo time used in this sequence, which could be responsible for a loss of contrast in lesions where T2 is lower (15). Another possible explanation is that infratentorial lesions may have different T2 characteristics. These data represent a limitation when imaging lesions of the posterior fossa with fast FLAIR sequences and, hence, a bias in the comparison of clinical and MR imaging data. Consequently, CSE se-quences should be used when infratentorial le-sions are suspected.
Recent reports suggest that the FSE se-quence could replace CSE in the MR imaging evaluation of MS (4) (T. A. Yousry, M. Filippi, C. Becker, M. A. Horsfield, R. Voltz, M. F. Reiser, “Comparison of SE, FSE, Fast FLAIR and TGSE in Evaluating Multiple Sclerosis,” In: Proceed-ings of the 34th Annual Meeting of the Ameri-can Society of Neuroradiology, Oak Brook, Ill: American Society of Neuroradiology; 1996:68 – 69). Our data showed that FSE sequences are less sensitive in quantifying the number and volume of demyelinating lesions, particularly for supratentorial white matter lesions that are periventricular. The lower number and volume of lesions detected by FSE as compared with CSE suggest that FSE is less sensitive for mea-suring MS lesions. However, the repetition time we used (2500) is slightly higher than that used for the CSE sequence, which resulted in a higher CSF intensity on the FSE images. This may have resulted in the particular difficulty we had in identifying periventricular lesions with this sequences. The longer repetition time was necessary because of the long echo train we used. The use of a shorter echo train would have resulted in us being able to obtain a repetition
time of 2000, but with the loss of some advan-tage in shorter imaging time. Moreover, on FSE sequences, the C/N and C/R ratios of MS le-sions were lower than those on the CSE se-quence, and the lesions were less sharp. There was no significant difference in the time re-quired to estimate lesion load for FSE and CSE, and a fair agreement between observers was found.
In conclusion, our data suggest that, limita-tions regarding lesions infratentorially located notwithstanding, the advantage of fast FLAIR in conjunction with a semiautomated quantifica-tion program is that it provides a reliable means to evaluate the total lesion burden of patients with MS. The real benefit of the routine use of fast FLAIR sequences was related to a better definition of supratentorial cortical/subcortical lesions. Furthermore, the almost complete in-terobserver agreement, the higher C/N of the lesions, and the limited time required for semi-automated quantification of the fast FLAIR se-quence support its routine use in clinical and MR imaging examinations in patients with MS.
Acknowledgments
We are grateful for the assistance of Massimo Filippi and Baker Lewis in the preparation of the manuscript. We also thank the MR imaging technologists, Alessandro Dell’Anna, Paolo Montanari, and Mario Rossi, who assisted in the study and performed the imaging examinations of the patients.
References
1. Miller DH, Albert PS, Barkhof F, et al. Guidelines for the use of magnetic resonance techniques in monitoring the treatment of multiple sclerosis.Ann Neurol1996;39:6 –16
2. Hennig J, Friedburg H. Clinical applications and methodological developments of the RARE technique.Magn Reson Imaging1988; 6:391–395
3. Constable RT, Anderson AW, Zhong J, Gore JC. Factors influenc-ing contrast in fast spin-echo imaginfluenc-ing. Magn Reson Imaging
1992;10:497–511
4. Thorpe JW, Halpin SF, MacManus DG, Barker GJ, Kendall BE, Miller DH. A comparison between fast and conventional spin-echo in the detection of multiple sclerosis lesions. Neuroradiology
1994;36:388 –392
5. Hajnal JV, Bryant DJ, Kasuboski L, et al. Use of fluid attenuated inversion recovery (FLAIR) pulse sequence in MRI of the brain.
J Comput Assist Tomogr1992;16:841– 844
6. De Coene B, Hajnal JV, Gatehouse P, et al. MR of the brain using fluid-attenuated inversion recovery (FLAIR) pulse sequence.
AJNR Am J Neuroradiol1992;13:1555–1564
7. Hashemi RJ, Bradley WG, Chen DY, et al. Suspected multiple sclerosis: MR imaging with a thin-section fast FLAIR pulse se-quences.Radiology1995;196:505–510
expanded disability status scale (EDSS).Neurology 1983; 33: 1444 –1452
9. Filippi M, Horsfield MA, Bressi S, et al. Intra- and inter-observer agreement of brain MRI lesion volume measurements in multiple sclerosis: a comparison of techniques. Brain1995; 118:1593– 1600
10. Khoury SJ, Guttman CRG, Orav EJ, et al. Longitudinal MRI in multiple sclerosis: correlation between disability and lesion bur-den.Neurology1994;44:2120 –2124
11. Wicks DAG, Tofts PS, Miller DH, et al. Volume measurements of multiple sclerosis with magnetic resonance images: a preliminary study.Neuroradiology1992;34:475– 479
12. Pannizzo F, Stallmeyer MJB, Friedman J, et al. Quantitative MRI studies for assessment of MS. Magn Reson Med1992;24: 90 –99
13. Wicks DAG, Tofts PS, Miller DH, et al. Volume measurements of multiple sclerosis lesions with magnetic resonance images: a preliminary study.Neuroradiology1992;34:475– 479
14. Jackson EF, Narayana PA, Wolinsky JS, Doyle TJ. Accuracy and reproducibility in volumetric analysis of multiple sclerosis lesions.
J Comput Assist Tomogr1993;17:200 –205
15. Filippi M, Yousry T, Baratti C, et al. Quantitative assessment of MRI lesion load in multiple sclerosis: a comparison of conven-tional spin-echo with fast-fluid attenuated inversion recovery.
Brain1996;2:1349 –1355
16. De Coene B, Hajnal JV, Pennock JM, Bydder GM. MRI of the brain stem using fluid-attenuated inversion recovery (FLAIR) sequence.
Neuroradiology1993;35:327–331
17. Baratti C, Barkof F, Hoogenraad F, Valk J. Fluid attenuated in-version recovery (FLAIR) sequences in multiple sclerosis: con-trast parameters in a steady state and comparison with spin-echo sequences.Magn Reson Imaging1995;13:513–521
18. Boggild MD, Williams R, Haq N, Hawkins CP. Cortical plaques visualized by fluid-attenuated inversion recovery imaging in mul-tiple sclerosis.Neuroradiology1996;38(Suppl 1):10 –13 19. Millefiorini E, Padovani A, Pozzilli C, et al. Depression in the early
phase of MS: influence of functional disability, cognitive impair-ment and brain abnormalities.Acta Neurol Scand1992;86:354 – 358
20. Sabatini U, Pozzilli C, Pantano P, et al. Involvement of the limbic system in multiple sclerosis patients with depressive disorders.
Biol Psychiatry1996;39:970 –975
21. Pozzilli C, Gasperini C, Anzini A, Grasso MG, Ristori G, Fieschi C. Anatomical and functional correlates of cognitive deficit in multi-ple sclerosis.J Neurol Sci1993;115 (Suppl):55–58