Figure 1 Partial 2D gel images showing human brain proteins from a control (A) and a patient with Alzheimer’s disease (B). The proteins were separated on pH 3}10 nonlinear strips, followed by 9}16%SDS gels, stained with colloidal Coomassie blue. The spots representing glial fibrillary acidic protein (GFAP) in (B), a known marker of neuronal loss, are indicated.
Two-dimensional Electrophoresis
M. Fountoulakis, F. Hoffman-La Roche Ltd., Pharmaceutical Research-Gene Technology, Basel, Switzerland
Copyright^ 2000 Academic Press
Introduction
Two-dimensional (2D) polyacrylamide gel electro-phoresis is a classical technique for the separation of proteins. It Rrst appeared in the mid-1970s but for a long time it only found limited applications. Re-cently it has enjoyed an impressive renaissance. The major reasons for this are the introduction of the immobilized pH gradient (IPG) strips and the devel-opment of analytical methods capable of identifying proteins present in very low quantities. 2D elec-trophoresis represents the core methodology of the new, technology-driven science proteomics. Pro-teomics Rnds a wide application, in both clinical diagnosis and in pharmaceutical research, for the detection of novel drug targets. Figure 1 demon-strates the application of 2D electrophoresis for the detection of variable protein levels between diseased and healthy brain tissue. In a sample from the parietal lobe of the brain of a patient with Alzheimer’s dis-ease, a strong spot representing glialRbrillary acidic protein (GFAP), a marker for neuronal loss, is
pres-ent, whereas in the control sample, the corresponding spot is very weak.
The aim of proteomics is the high throughput anal-ysis of the proteome (protein complement expressed by a genome) of various organisms or tissues. It con-sists of two steps: (1) the separation of protein mix-tures by 2D electrophoresis, and (2) the identiRcation of the separated proteins by analytical techniques, such as mass spectrometry and amino acid composi-tion analysis. The process is facilitated by the use of highly sophisticated software for advanced image analysis and the high reproducibility of images in intra- and inter-laboratory studies. The 2D elec-trophoresis itself involves: (1) separation of the pro-teins on the basis of differences in their net charge, called isoelectric focusing (IEF), and (2) separation of the focused proteins on the basis of differences in their molecular masses.Table 1 gives a summary of the most signiRcant chronological events in the devel-opment of 2D electrophoresis. The state-of-the-art technology will be discussed without entering into extensive technical details that can be found in the literature provided.
First-Dimensional Separation (IEF)
Table 1 Important advances in 2D electrophoresis technology
1970 Introduction of sodium dodecyl sulfate in 1D gel electrophoresis to efficiently separate complex protein mixtures (Laemmli UK,Nature 227: 680)
1975 Separation of protein mixtures by 2D gel electrophoresis using tube gels and pH gradients formed with carrier ampholytes (O’Farrell PH,Journal of Biological Chemistry 250: 4007)
1980}1990 Pioneering work to improve pH gradient stability; synthesis of Immobilines and preparation of IPG strips (Bjellqvist B, Journal of Biochemistry Biophysics Methods 6: 317); electrotransfer of proteins from gels to PVDF membranes 1990}today IPG strips became commercially available; introduction of sigmoidal strips, efficient separation of basic proteins,
improvement of gel staining and protein solubilization techniques (Bjellqvist, Dunn, Goerg, Hochstrasser, Rabilloud, Righetti and others); development of high throughput protein analytical techniques (MALDI-MS, amino acid analysis); development of software for protein identification and image comparison; establishment of databases accessible via the WorldWideWeb; sequencing of the complete genome of microorganisms; preparation of 2D protein maps for organs, cell lines, organisms; new termsProteome, Proteomics were introduced
protein charge depends on the pH value of the solu-tion. IEF is an equilibrium process, during which, under the inSuence of a high voltageReld the proteins move along a pH gradient, according to their net charge, to a position, where they have no net charge and consequently stop moving. This pH value is called the isoelectric point (pI). The resolving power of IEF is deRned by the equation of Svensson:
pI"[D[d(pH)/dx]:E[!du/d(pH)]]1/2
where pI"resolution capacity (pI difference re-quired to resolve neighbouring spots), D"diffusion coefRcient of the protein, E"Reld strength (V cm\1), d(pH)/dxpH gradient, du/d(pH) mobility slope at pI. According to this equation, the resolution capacity is inSuenced by the pore size of the gel, which affects the diffusion of the protein, the slope of the pH gradient and the voltage value.
An efRcient and reproducible protein separation during IEF requires a stable pH gradient. There are two pH gradient systems in use. In the Rrst one, the pH gradient is created by an excess of carrier pholytes during the IEF run. Ampholytes are am-photeric compounds of low molecular mass with closely related pI values. Upon application of an electric Reld, the ampholyte molecules move and align themselves between the electrodes, forming a pH gradient, which increases from anode to cath-ode. This type of IEF is usually performed in tube acrylamide gels.
In the second pH gradient system, the pH gradient is immobilized and has been formed prior to IEF run. IPGs are formed by acrylamide derivatives, called immobilines, which are weak acids and bases with a buffering capacity. Immobilines are copolymerized in a polyacrylamide gel, such that a pH gradient is formed between basic and acidic molecules. When an electricReld is applied, the pH gradient does not move. Only the charged molecules of the protein sample move and are focused according to their pIs into
narrow bands. This type of IEF is usually performed in strips of acrylamide gelRxed on a plastic sheet.
Carrier Ampholytes
The pH gradient formed by the carrier ampholytes during IEF can be affected by the amount of total protein loaded. Proteins when applied in large quant-ities, having themselves a buffering capacity, can af-fect the focusing position along the pH gradient and consequently the reproducibility. Therefore, factors such as protein quantity, temperature, voltage and chemicals can strongly affect performance. Only small quantities of protein (of the order of 0.1 mg) should be applied for IEF with the carrier ampholytes approach. The difRculties in controlling the various factors which affect reproducibility together with the difRculties of preparing and transferring the tube gels to the second dimensional separation, contribute to the reasons why carrier ampholyte-based IEF re-mained a scientiRc speciality of only a few laborator-ies. Nevertheless, these laboratories are able to con-trol the conditions affecting reproducibility, so that IEF with carrier ampholytes is still used. This ap-proach allows a very reliable protein quantiRcation of complex mixtures. Because only a small amount of protein can be applied, 2D gels made following the carrier ampholyte approach are more suitable for analytical purposes. IEF based on carrier ampholytes can efRciently separate proteins with pIs within the pH range of 3}8. Proteins with higher pIs separate poorly due to cathodic drift during isofocusing. The cathodic drift is the result of a high electroosmotic
Sow, caused by the charged groups on the glass walls of the gel tubes.
IPG Strips
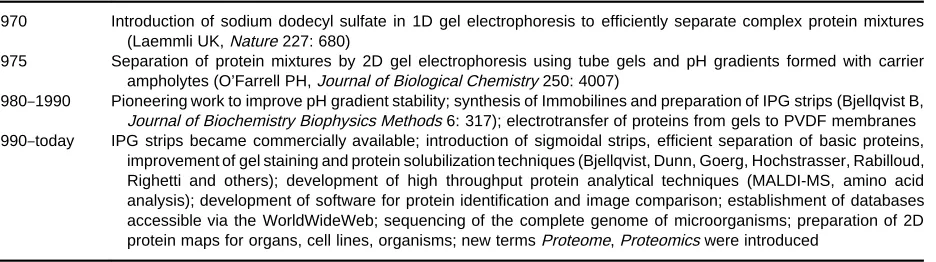
Figure 2 Partial 2D gel images showing the high fidelity in the reproducibility of separation of bacterial (A, B) and mammalian (C, D) proteins. The proteins were separated as stated in the legend to Figure 1. (A, B). Separation of proteins ofHaemophilus influenzae were 1.5 and 3.0 mg, respectively. (C, D) Separation of rat brain proteins, 1.5 and 2.0 mg, respectively.
reproducibility. The increase in reproducibility has allowed a high throughput analysis of proteomes and the application of larger sample quantities, a require-ment for protein spot analysis. Figure 2 provides examples of the reproducibility of separation of bac-terial and mammalian proteins, following IEF on pH 3}10 nonlinear IPG strips. Although minor differ-ences can be detected, the reproducibility concerning both the position and the intensity of the protein spots can be considered as satisfactory.
As mentioned earlier, immobilines are polymerized in a gradient, in a polyacrylamide gel, and the gel is then dried on a plastic sheet. Before the IEF run, the dry strips are rehydrated in a speciRc rehydration solution, containing a reducing agent, ampholites and high concentrations of urea and a zwitterionic or
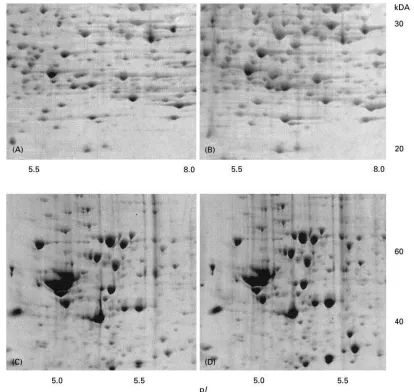
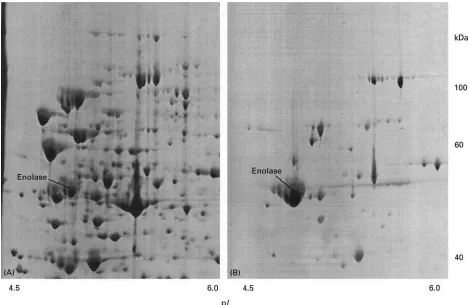
Figure 3 Partial 2D gel images showing examples of proteins represented by multiple spots. (A, B)-enolase from human brain. The protein is represented by one spot when IEF was performed on pH 3}10 nonlinear IPG strips (A), and by five spots when IEF was performed on pH 4}7 strips (B). (C) Dihydropyrimidinase-related protein 2 from human brain shows a high heterogeneity, represented by five spots, localized into two regions on the gel. (D)1-antitrypsin from human cerebrospinal fluid is represented by many spots, most likely denoting different glycoforms of the protein.
The use of narrow pH range strips (i.e. of 1 pH unit) provides a higher resolution and allows the detection of protein isoforms; this is an additional advantage of IEF using IPG strips. Strips of more narrow pH ranges are not currently commercially available and have to be prepared by the user. IPG strips can be made in any biochemical laboratory using a gradient marker and Immobilines of various pK values which can be purchased. Recipes for the preparation of IPG strips can be found in handbooks, for example in Electrophoresis in Practice (see Fur-ther Reading). On the narrow pH range the spots appear stretched compared to the wide range strips. Figure 3 shows an example of a protein which ap-pears as one spot following IEF after focusing on a pH 3-10 strip and asRve spots after IEF on a pH 4}7 strip. IEF on strips of an even narrower pH range would result in the detection of additional spots re-sulting from further isoforms of the protein. Follow-ing IEF, the IPG strips can be either immediately used for the second dimensional separation or stored frozen at !203C for long periods (for example, in petri dishes sealed with paraRlm). Strips stored for 4 months have been used at !203C without any
effect on the spot resolution. Longer storage times of up to 1 year have been reported.
Sample Preparation
Careful sample preparation is a prerequisite of a suc-cessful analysis. Most proteins are soluble and are easily recovered in the sample preparation solution, which includes urea, CHAPS, a reductant and, op-tionally, protease inhibitors. Recovery of the proteins that are insoluble in this solution is often a problem. A centrifugation step is necessary for removal of nondissolved material. The addition of thiourea and of a noncharged reducing agent, such as tributyl phosphine, to the sample buffer increases protein solubility during IEF. It would appear that hydropho-bic interactions between proteins and the acrylamide gel of the IPG strips are responsible for protein losses during IEF. Nucleic acids present in the sample can also seriously affect spot resolution. Enzymatic diges-tion with an endonuclease prior to sample applicadiges-tion is usually recommended.
Sample Application
The protein application mode can affect the amount of protein entering the IPG strip during IEF. There are several ways of applying the sample. In the system supplied by Amersham Pharmacia Biotechnology (Multiphor II), the sample is usually loaded into ap-plication cups (also supplied by Amersham Pharma-cia Biotechnology). Up to 150L can be applied in one cup. The cups areRxed in special ‘cup accommo-dating bridges’ which are placed near the basic or acidic end of the strip. It seems that sample applica-tion at the basic end of the strip is more advantageous compared to the application at the acidic end. We have, however, found that simultaneous sample ap-plication at both the basic and the acidic ends of the strip can result in the detection of more and stronger protein spots compared to sample application at only one end. It also allows the simultaneous application of sample volumes larger than 150L. From a tech-nical point of view, sample application using the cups is the most difRcult operation to perform. The cups should touch the polyacrylamide gel on the strip, otherwise the sample will leak; they should also not damage the gel at the contact point, otherwise the proteins will not enter the strip.
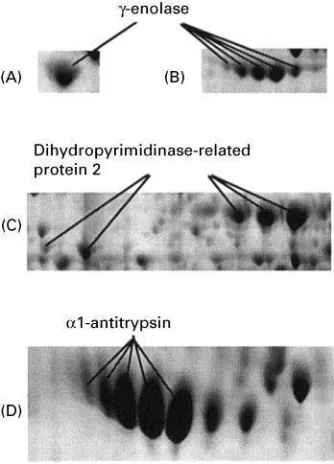
Figure 4 Partial 2D gel images showing an improved spot res-olution by using different acrylamide concentrations. Separation of rat brain proteins on a 9}16%SDS gel (A) and on a 7.5}16% SDS gel (B). Separation of low molecular mass soluble proteins fromH. influenzae on 9I16% SDS gel (C) and on a 10% SDS Tricine gel (D). (B, D) The gel parts comprising the corresponding proteins shown in A and B, respectively, are longer on account of the different acrylamide concentrations.
into cups. Amersham Pharmacia Biotechnology has recently introduced a new IEF apparatus (IPGphor) in which sample application and IEF can be per-formed. The strips are placed in special ceramic strip holders and rehydrated for the desired time in a solution containing the protein sample. Each strip holder holds a single IPG strip throughout rehydration and IEF. IEF starts automatically after rehydration according to the conditions pro-grammed. Whether the performance of IEF will be improved with the use of this instrument is not clear at present.
The quantity of protein to be applied on the strip naturally depends on the goal of the analysis. If the identiRcation of protein spots is intended, the amount loaded should be in the order of 1 mg or higher, depending on the number of proteins in the mixture. A 1D gel analysis of the sample prior to 2D elec-trophoresis may provide helpful information as to deRning the right protein quantity. If large amounts of protein are applied, a percentage of the proteins may not enter the strip. Presently, this constitutes a drawback of the IPG strip approach. Because cer-tain proteins in the sample (mainly major compo-nents) only partially enter the strip, this can result in an unreliable quantiRcation of a particular protein in a given mixture. While the application of 15 mg or more of protein sample has been reported, we consider that 2}4 mg is the limit for a productive separation, using the strips that are presently avail-able.
IEF using IPG strips can separate basic proteins efRciently with pIs up to about 12. The introduction of low concentrations of isopropanol in the rehydra-tion buffer improves focusing of basic proteins. Hy-drophobic proteins probably precipitate at the point of application and efRcient separation has not yet been reported. Hydrophobic proteins can be analysed in a different 2D electrophoresis system, which uses the interaction of the proteins with a cationic deter-gent in theRrst dimension rather than pI. The second dimension is, as described below, dependent on the molecular mass. The separated proteins form approx-imately a diagonal line. Relatively, only a small num-ber of proteins can be successfully separated using this approach.
Second-Dimensional Separation
(Sodium Dodecyl
Sulfate-Polyacryl-amide Gel Electrophoresis,
SDS-PAGE)
Following IEF, the proteins are separated according to their molecular masses. During this
nonequilib-rium step, the proteins are negatively charged by addition of the anionic detergent SDS. Upon application of an electricReld, the charged proteins move along a porous polyacrylamide gel and are separated according to their size. A reducing agent is also included to disrupt disulRde bonds. In comparison with IEF, SDS-PAGE is relatively easy to control. The terms ISO-DALT and IPG-DALT are often used to mean 2D gel electrophoresis employing IEF with carrier ampholytes or IPG strips, respectively.
Figure 5 Partial 2D gel images showing soluble proteins of (A)H. influenzae, (B) E. coli and (C) B. subtilis. The proteins were separated as stated in the legend to Figure 1. Note the similarity in the distribution of the major proteins in the three bacterial organisms.
technology and the large diversity of the samples to be analysed, and in order for the data to be useful to a broad research community, 2D PAGE has been to a large extent standardized. In the second dimension, for example, we usually use 9}16% linear gradient gels. This gel system represents a good compromise, as it separates proteins between 5 and 200 kDa. However, efRcient separation is limited to a range of approximately 15}40 kDa. Outside this range, in particular above 50 and below 10 kDa, the separ-ation is often suboptimal. For more efRcient separ-ation, gels of a different acrylamide concentration should be tried. Figure 4 gives examples of the im-proved separation of high molecular mass brain pro-teins using gels of lower acrylamide concentration and of low molecular mass proteins from Haemo-philus inUuenzae, using gels with Tricine as the trail-ing ion instead of Tris.
For spot visualization, the gels can be stained with either silver or Coomassie blue (usually colloidal Coomassie blue), depending on the quantity of
pro-tein sample applied and the aim of analysis. Silver stain may be preferentially used for gel comparison studies, whereas staining with Coomassie is preferred when the spots are intended for protein identiRcation. Colloidal Coomassie blue has the advantage that the stain is sensitive enough and the gels can be easily destained with water. The simultaneous staining of many gels in one tank substantially increases the throughput. Apart from silver and Coomassie blue, several other protein detection methods exist, such as staining with various metals, labelling with S uor-escent agents or detection of radiolabelled com-pounds, after gel drying and exposure, for example to aRlm.
Proteome Analysis
Figure 6 Partial 2D gel images showing the enrichment of enolase by hydrophobic interaction chromatography. (A) Total extract; (B) proteins from a fraction collected from the column.
approximately 1000}2000 protein spots can be vis-ualized on one 2D-gel, using Coomassie blue. Higher numbers can be detected, following staining with silver or after radiolabelling. Approximately one-half of the visible spots are available in sufRcient quantit-ies to be analysed for identiRcation. Figure 5shows the analysis by 2D electrophoresis of the proteomes of three bacteria,H.inUuenzae,Escherichia coliand Bacillus subtilis. The genomes of the three microor-ganisms have been completely sequenced, so that theoretically all expressed proteins can be mapped. This has however not yet been accomplished. The largest 2D proteome maps, such as that ofH. inU u-enzaeprepared at F. Hoffmann-La Roche, Basel, in-clude approximately 500 mapped proteins. Many of the unidentiRed proteins are not expressed in sufR -cient amounts to be visualized.
For the mapping of proteomes of the various or-ganisms, protein enrichment steps need to be intro-duced before analysis. We have used several chromatographic steps, such as heparin chromatogra-phy, hydrophobic interaction chromatography, chromatofocusing, hydroxyapatite chromatography and several other approaches, to enrich the low-abundance gene products ofH.inUuenzaeandE.coli.
Additional enrichment steps are required for an efR -cient mapping of proteins present at low abundance, such as cytokines or transcription factors. Figure 6 shows an example of protein enrichment by hydro-phobic interaction chromatography. One protein (enolase), represented by a strong spot in the 2D map of the total protein extract, is highly enriched after chromatography. Another example of protein enrichment, this time using heparin chromato-graphy is shown in Figure 7. In two fractions col-lected from the column, proteins which are not visible in the 2D gel image of the total extract can also be detected.
Figure 7 Partial 2D gel images showing the enrichment of low abundance proteins ofH. influenzae by heparin chromatography. (A) Total extract; (B, C) proteins from fractions collected from the heparin column. The arrowheads indicate spots representing two proteins (B, topoisomerase I; C, ATP-dependent RNA helicase) which are not visible in total extract (A).
Table 2 Steps in the preparation of 2D electrophoresis
IPG strip rehydration and sample preparation
Protein extraction, centrifugation, recovery in sample solution
Sample application
Application in cups at either or at both ends of the strip or strip rehydration in a solution containing the protein sample
First dimensional separation (isoelectric focusing)
Start at 200 V and increase gradually to 5000 V; keep 5000 V for 6}48 h, depending on sample, quantity and strip range; narrow pH range strips require longer focusing times
Reduction and alkylation of proteins on IPG strip
Equilibration of strip with reducing and alkylating agents or freeze until use
Second dimensional separation (SDS-PAGE)
Preparation of gel of the desired acrylamide concentration; gels should carry a label to identify them afterwards; establishment of contact between strip and gel with agarose solution; run at 40 mA/gel
Protein\xing and staining or blotting
Fixation of proteins within the gel and staining with silver or Coomassie blue or drying of the gel and exposure to a film or phosphorimager for detection of radiolabelled proteins or electrotransfer of proteins to membranes for immunoblot, MS or amino acid analysis
Gel scanning
Storage of image in a database
Gel comparison
Gel comparison and protein quantification using specific software; comparison with database master gels via the WorldWideWeb
Identi\cation of proteins
Identification of protein spots from gels by mass spectrometry or from membranes by N-terminal sequencing, amino acid composition analysis, MS or immunoblots
example of protein heterogeneity, most likely due to glycosylation, is presented.
Following 2D electrophoresis, proteins can be iden-tiRed by mass spectrometric analysis of the peptides resulting from the in-gel digestion with a speciRc
genomic sequence is in a database, the most efRcient identiRcation method presently available is matrix-associated laser desorption ionization mass spectro-metry (MALDI-MS) with which about 500 spots can be analysed daily by one person. The method toler-ates small amounts of salt in the sample, so that no time-consuming desalting steps are required after di-gestion. Several approaches using a combination of protein digestion on membranes and MS have also been reported.Table 2summarizes the essential steps of 2D electrophoresis and protein analysis.
Future Developments
2D electrophoresis is still in a developmental stage. Several technical improvements, mainly concerning further simpliRcation of the technology and possible automation, an increase in reproducibility and sensi-tivity, and expansion of the pH detection spectrum, have to be achieved in order for the method to be-come routine in any biochemical laboratory. Gel grin-ding techniques, together with sophisticated software using the mass spectroscopic data, may be developed to produce a gel image without previous staining of the gel. Such a development could be decisive as to whether the technology will reach its major goal, i.e. the investigation of biological problems by a faithful comparison of protein expression levels. The comple-tion of the sequencing of more genomes together with improvements in the analytical techniques will also
lead to a more widespread application of the tech-nology.
See Colour Plate 43.
Further Reading
Anderson L (1991)Two-dimensional Electrophoresis:
Op-eration of the ISO-DALT System. Rockville: Large Scale Biology Press.
Fountoulakis M and Lahm H-W (1998) Hydrolysis and amino acid composition analysis of proteins.Journal of Chromatography826: 109.
Hames BD and Rickwood D (1990) Electrophoresis of
Proteins:A Practical Approach. Oxford: IRL Press. Humphery-Smith I, Cordwell SJ and Blackstock WP (1997)
Proteome research: Complementarity and limitations with respect to the RNA and DNA worlds. Electrophor-esis18: 1217.
Kleinert T (1990)Elektrophoretische Methoden in der Pro-teinanalytik. Stuttgart: Georg Thieme Verlag.
Righetti PG (1990)Immobilized pH Gradients:Theory and Methodology. Amsterdam: Elsevier.
Smith BJ (1997) Methods in Molecular Biology: Protein
Sequencing Protocols, vol. 64. Totowa: Humana Press. Walsh BJ and Herbert B (1998) Setting up Two-dimensional
Gel Electrophoresis for Proteome Projects.
http://rbams3115/Pages/2DPAGE/ABRFNews}2dpage.html Westermeier R (1993)Electrophoresis in Practice.
Wein-heim: VCH Verlagsgesellschaft.
Wilkins MR, Williams KL, Appel RD and Hochstrasser DF (1997)Proteome Research:New Frontiers in Functional Genomics. Berlin: Springer.
Two-dimensional Polyacrylamide Gel Electrophoresis
J.-D. Tissot and P. Schneider,
Service Re&gional Vaudois de Transfusion Sanguine, Lausanne, Switzerland
M. A. Duchosal, Centre Hospitalier Universitaire Vaudois, Lausanne, Switzerland
Copyright^ 2000 Academic Press
Introduction
The evolution of tools utilized in biology and medi-cine, together with the exponential progress accomp-lished recently in the area of bioinformation, enables analysis of whole organism constituents. Such analyses are best exempliRed by complete genomic sequences of different microorganisms, and by the recent development in techniques permitting dissection of the whole protein repertoire of an indi-vidual, namely its proteome. Furthermore, the dra-matic growth in the number of genome projects as