THROUGHPUT IMPROVEMENT OF MOLECULAR DYNAMICS SIMULATIONS USING RECONFIGURABLE COMPUTING∗
SADAF R. ALAM, PRATUL K. AGARWAL, JEFFREY S. VETTER† AND MELISSA C. SMITH‡
Abstract. A number of grand-challenge scientific applications are unable to harness Terflops-scale computing capabilities of massively-parallel processing (MPP) systems due to their inherent scaling limits. For these applications, multi-paradigm computing systems that provide additional computing capability per processing node using accelerators are a viable solution. Among various generic and custom-designed accelerators that represent a data-parallel programming paradigm, FPGA devices provide a number of performance enhancing features including concurrency, deep-pipelining and streaming in a flexible manner. We demonstrate acceleration of a production-level biomolecular simulation, in which typical speedups are less than 20 on even the most powerful su-percomputing systems, on an FPGA-enabled system with a high-level programming interface. Using accurate models of our FPGA implementation and parallel efficiency results obtained on the Cray XT3 system, we project that the time-to-solution is reduced sig-nificantly as compared to the microprocessor-only execution times. A further advantage of computing with FPGA-enabled systems over microprocessor-only implementations is performance sustainability for large-scale problems. The computational complexity of a biomolecular simulation is proportional to its problem sizes, hence the runtime on a microprocessor increases at a much faster rate as compared to FPGA-enabled systems which are capable of providing very high throughput for compute-intensive operations thereby sustaining performance for large-scale problems.
Key words. field programmable gate arrays, molecular modeling, performance modeling and projections
1. Introduction. Despite the tremendous computing power, flexibility, and power and cost efficiency of the FPGA devices, their use in scientific high performance computing (HPC) has been limited to numerical functions and kernels that are implemented in a hardware description language (HDL) [30, 39]. The idiosyncrasies of the HDLs and limited support for floating-point (FP) operations restrict the ability of scientific code developers to port their algorithms and applications, let alone to exploit the full potential of these devices. In this paper, we present an analysis and FPGA implementation of a biomolecular calculation called the Particle-Mesh Ewald (PME) method using High-Level Languages (HLLs), and report application speedup results. This specific PME method is part of a widely-used molecular dynamics (MD) framework called AMBER [1, 21]. AMBER, a collection of programs including system preparation, simulation and analysis, allows application scientists to carry out complete experiments of biomolecular systems. MD techniques allow application scientists to study the dynamics of large macromolecules, including biological systems such as proteins, nucleic acids (DNA, RNA) membranes. Thesander module of AMBER is the most commonly used module for system simulations; furthermore, system simulations are the most time-consuming part of an experiment. Within the sander module, there are a number of algorithms for simulating a system. The PME method is used in most explicit solvent experiments including the simulations for protein structure, dynamics and functions [23].
Motivation. A number of strategies have been employed in attempts to accelerate the PME calculations on traditional supercomputing platforms such that scientists can simulate their experiments at native time and length scales. Currently, even the fastest computers are 104–106 magnitudes short of what is desired for even investigations of a medium-scale simulation. Our analysis revealed that the PME algorithm implementation in the sander module in the AMBER framework version 8.0 does not scale beyond 32 and 64 processors on the most powerful supercomputers including the IBM Blue Gene/L and the Cray XT3 systems [16]. Although no system-specific optimization are considered in these experiments, the applications have been compiled using the double-hummer optimization flags offered by the IBM XL compilers on the Blue Gene/L system and SSE optimization flags of the PGI compiler on Cray XT platforms. A number of researchers have identified the factors that limit the performance and scaling of PME algorithms on microprocessors and massively-parallel systems [21], [22]. Figure 1.1 shows the scaling characteristics of the PME calculations in the strong scaling mode (fixed problem size) and Figure 1.2 shows the performance in the weak scaling mode on the Blue Gene/L system. Pico-seconds per simulation day (psec/day) is the science-based metric used by application scientists to measure a simulation performance. A high value of psec/day is essential for longer time scale simulations. Analysis of the PME implementation reveals two major limiting factors. First, the message volume is roughly
∗Research sponsored by the Laboratory Directed Research and Development Program of Oak Ridge National Laboratory, managed by UT-Battelle, LLC, for the U. S. Department of Energy under Contract No. DE-AC05-00OR22725.
†Computer Science and Mathematics Division, Oak Ridge National Laboratory, USA ‡Department of Computer and Electrical Engineering, Clemson University, USA
Fig. 1.1. AMBER (PME method) scaling in the strong scaling mode with a 62K atoms system.
Fig. 1.2. AMBER (PME method) scaling for four dif-ferent system sizes: 62K, 144K, 194K and 300K atoms on the Blue Gene/L (BGL) system.
constant with the number of processors or MPI tasks. This limits parallel speedup to a maximum of 12x to 15x over microprocessor runtimes, even for systems like Blue Gene/L and Cray XT3 that provide relatively high communication bandwidth ratios compared to common SMP cluster systems. Second, the application’s memory capacity requirements do not scale with the number of processors, since all processors store the positions of all atoms [16, 21, 22, 40]. This is especially challenging for the emerging multi-core systems.
Fig. 1.3.Scaling of PMEMD (Amber 9) simulations on contemporary massively parallel systems
A special purpose system, called MDGRAPE, attempts to address memory and network latency issues of MD calculations with specialized execution pipelines for non-bond calculations [41]. Our reconfigurable design scheme addresses a similar issue but in a more cost-effective and flexible manner. In contrast to our approach, MDGRAPE is optimized for a small subset of MD calculations within the AMBER framework and requires end users to understand its customized software infrastructure. Our implementation is flexible, and extensible, and encompasses more MD computation logic.
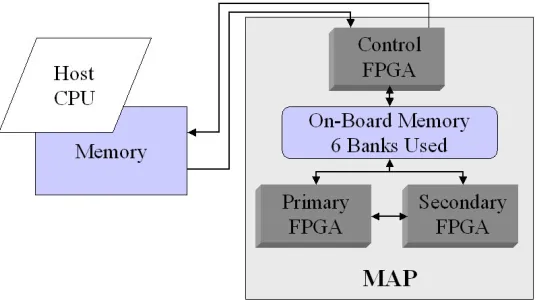
Contributions. In order to address the aforementioned issues regarding parallel efficiencies of MD simu-lations, we are investigating the acceleration of the PME method on FPGA-enabled supercomputing systems using a high-level language, Fortran—a widely used language for scientific computing. Currently, the SRC MAPstation, Cray XD1, and SGI RASC systems are all available with FPGA devices. The SRC platforms are the only systems that provide a tightly-coupled coherent programming environment allowing users to program the FPGAs using both Fortran and C programming languages [12]. Since the sander module in AMBER is written in Fortran 90, we targeted the SRC-6E MAPstation taking advantage of the Fortran support. The Series E MAPstation pairs a dual 2.8 GHz Xeon microprocessor with a MAP processor consisting of two user-configurable XilinxXC2VP100 FPGA devices [13] running at 100 MHz, a control processor, and seven 4MB SRAM banks referred to as On-Board Memory (OBM).
We characterized the computation and memory requirements of the PME calculations with extensive profil-ing and benchmarkprofil-ing on existprofil-ing microprocessors and parallel systems. Due to the logic capacity of the SRC-6E FPGA devices, we accelerated only the direct PME calculations which account for over 80% of the total ex-ecution time in most bio-molecular simulations. Initially, using single-precision FP calculations we achieved a computation speedup (not including overheads) of over 3x for two biological systems of sizes 24K and 62K atoms when compared to the same systems running on the microprocessor-only system. Then, after carefully characterizing the memory requirements, we managed to reduce the data transfer overheads and sustain a total application speedup of 3x compared to the microprocessor-only runtimes. Finally, we further increased the application speedup, by overlapping the ‘direct’ and ‘reciprocal’ PME calculations [22]. The FPGA devices execute the ‘direct’ part of the calculation while the ‘reciprocal’ part is executed by the host microprocessor.
Since the performance of the FPGA devices are increasing at a much faster rate than commodity micro-processors [43, 44] and the SRC-6E contains relatively old FPGA devices (two generations old), we developed a performance model to predict performance for our current implementation on future FPGA devices [17]. These models have been extended to the parallel implementation of sander that employs message-passing (MPI) pro-gramming paradigm. We validate the extended model with the MPI profile and timing data collected on the Cray XT3, a high-bandwidth MPP platform. This model is parameterized by the application’s input parame-ters, which determine the problem size, and the target device parameters including the FPGA clock frequency, memory capacity, and I/O bandwidth. Using this performance model, we estimate that the next-generation FPGA devices will provide an additional speedup of greater than 2x beyond our current improvements for overall application performance – a speedup of greater than 15x relative to contemporary microprocessors, with increasing biological system sizes. On parallel systems, we demonstrate that the time to solution on 16-to-32 FPGA-enabled nodes would be equivalent to the largest configuration of contemporary MPP supercomputers.
Paper Outline. The layout of the paper is as follows: Section 2 provides a background discussion of FPGA accelerator devices and bio-molecular simulations. In Section 3 we discuss related research efforts for accelerating MD simulations on reconfigurable devices. Section 4 presents the implementation details. Performance analysis of the current implementation on the SRC-6E system is given in section 5. Section 6 describes the performance model and performance projections on current-generation FPGA devices and on future FPGA configurations and biological experiments. Conclusions and future plans are outlined in section 7.
2. Background.
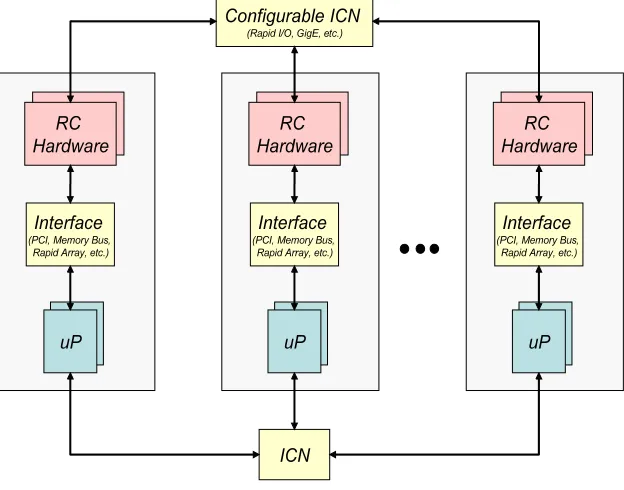
(RC), possible. As shown in Figure 2.1, High-performance Reconfigurable Computing (HPRC) platforms consist of a number of RC nodes connected by some interconnection network (ICN); the computing nodes typically consist of a general-purpose processor coupled to the RC hardware via some communication interface (e.g. PCI, memory bus, rapid array, HyperTransport, etc.).
Fig. 2.1.High-performance Reconfigurable Computer (HPRC) Architecture
The HPRC platform allows users to exploit fine and coarse grain parallelism within the RC device and across the parallel compute nodes. A variety of RC cards have been developed during the past decade [2, 3, 8, 9, 10, 25, 32, 34]. The early success of some of these offerings paved the way for HPC vendors such as the Cray XD1 [5] and the SGI RASC system [11] to enter the market with HPRC platforms featuring high-end processors more tightly coupled with the reconfigurable devices. Other vendors such as SRC with their line of MAPstations [12] and Opteron socket products from DRC Computers [6] and XtremeData [14] have entered the market with cluster-ready platforms. The systems from these vendors often include a more developed programming environment and clusters can be built incrementally (node by node).
For all the HPRC systems mentioned thus far, the RC element of the system is in the form of an RC board or module and the primary architectural difference is the manner in which it is coupled with the rest of the system. Each of the above-mentioned platforms has a different communication interface between the general-purpose processors and the reconfigurable hardware devices in addition to other variations including the host processor, memory hierarchy, FPGA devices, clock frequency, etc.
Biomolecular Simulations. Numerous applications use MD for biomolecular simulations. These appli-cations include AMBER [1], GROMACS [7], LAMMPS [36], and NAMD [29]. MD and related techniques can be defined as computer simulation methodology where the time evolution of a set of interacting particles is modeled by integrating the equation of motion. The underlying MD technique is based upon the law of classical mechanics, and most notably Newton’s law,F = ma [31].The MD steps performed in AMBER consist of three calculations: determining the energy of a system and the forces on atoms centers, moving the atoms according to the forces, and adjusting temperature and pressure. Most MD models treat atoms classically as points with mass and charge. The atomic points interact with other atomic points through pair-wise interactions from chemical bonds, electrostatic interactions and van der Waals interactions.
E(potential) =Xf(bonds) +Xf(angles) +Xf(d−torsions) + N
X
j=1 N
X
i=1
(−Aij/r6ij) + N
X
j=1 N
X
i=1
(qiqj/rij)
where the first three terms are the bonded terms and the latter two are referred as non-bonded terms. The non-bond energy is broken into two contributions: van der Waals and electrostatic interactions. The number of bonds, bond angles, and bond dihedrals during the classical simulations are kept constants. For a medium system, there are only a few thousand bonds and angles compared to millions of the non-bonded interactions; the calculations involving the bonded terms are extremely fast on conventional systems. The double sum of the non-bond terms makes the number of these calculations scale with an order ofN2, whereN is the number of atoms. Simulations of larger systems (largerN) are therefore extremely expensive.
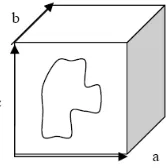
In the case ofperiodic boundary conditions(PCB), where the system is treated with a periodic arrangement of repeated unit cells to model the effect of large surrounding solvent without increasing the number of particles, the non-bonded sums become large. In a finite PCB, the simulation box is replicated a fix number of times in all directions to form a lattice (Figure 2.2). In practice, MD simulations evaluate potentials using acutoff distance scheme for computational efficiency, where each particle interacts with the nearest otherN−1 particles
in a sphere of radius cutoff. Figure 2.2 shows a 2-dimentional view of a simulation cell replicated in the three directions of space; atoms within cutoff will be involved in computing the non-bonded interactions.
Atom pairs that are separated by a distance greater than the cutoff limit (typically 10 Angstroms for AMBER simulations) are not included in the sums. The cutoff limits the number of non-bond interactions in the sum to beN∗(number of atoms in the cutoff sphere) as compared toN∗(N−1) interactions without the
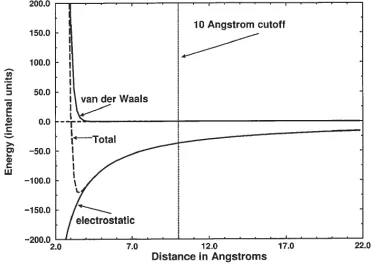
cutoff. For the van der Waals interactions, the cutoff error is small, but the electrostatic sum has a very large error, 10% or greater, when a 10 Angstroms cutoff is introduced. Figure 2.3 illustrates the magnitude of the problem for a system.
The total non-bond energy, the sum of the van der Waals and the electrostatic energies are of comparable magnitude near the equilibrium distance. But at 10 Angstroms, the electrostatic are still strong while the van der Waals energy is essentially vanished. Ignoring the electrostatic interactions that are beyond 10 Angstroms can introduce a large error in the energy and forces resulting in artificial force magnitudes. The Particle Mesh-Ewald (PME) method provides a solution to this problem by solving all electrostatic forces; it uses an atom-based cutoff [22, 23] reducing the number of non-bonded interactions toNlog(N).
Fig. 2.2.Two-dimensional view of a simulation cell replicated in the three-dimension space.
Fig. 2.3.The van der Waals and electrostatic contributions to the non-bond energy are shown as a function of the inter atomic distance [22].
The Ewald method expands the simple sum of Coulomb’s Law (electrostatic) terms into the following terms:
E(electrostatic) =E(direct) +E(reciprocal) +E(correct)
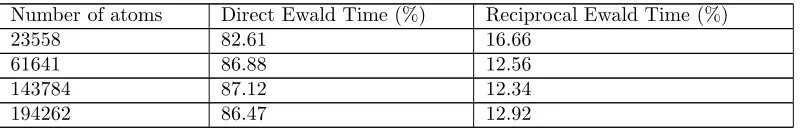
Table 2.1
Time spent in the direct and reciprocal Ewald calculations as a percentage of total execution time.
Number of atoms Direct Ewald Time (%) Reciprocal Ewald Time (%)
23558 82.61 16.66
61641 86.88 12.56
143784 87.12 12.34
194262 86.47 12.92
the direct sum misses due to the correction factor. The reciprocal sum is approximated using Fast Fourier Transform (FFT) with convolutions on the grid where charges are interpolated on the grid points. Table 2.1 provides the percentage of execution time (for 10000 time steps or production-level simulations) for four different protein experiments on an Intel dual 2.8 GHz Xeon system. The direct sum accounts for over 80% of execution time. The reciprocal Ewald calculation takes less than 13% of the total execution time. Taken together, these calculations account for over 95% of total execution time on a single processor system.
3. Related Work. A number of related efforts to develop MD codes on reconfigurable hardware plat-forms have been reported in the literature. In [26], the authors implement a basic MD system focused on the motion updates and the O(N2
) force terms (both Coulombic and L-J forces and multiple atom types) using hardware design techniques. The authors study the relationship between precision and quality of MD simula-tions and report that it is possible with reconfigurable devices to trade off unneeded precision for computing resources. Implementation on a COTS system yielded accelerations ranging from 31x to 88x with respect to a microprocessor-only implementation, depending on the size of the FPGA and the simulation accuracy. Simi-larly, in [19], the authors implemented a novel single atom type MD system with VHDL on a Transmogrifier 3 (TM3) system. This implementation focuses on the L-J force calculator with problem specific implementations. To reduce complexity, the implementation uses fixed-point representations varying between 22 and 76 bits for all values within the MD system. The author’s results show that this implementation closely tracked the higher precision software implementation with an error of less than 1% between consecutive time steps. The authors extrapolate that with better FPGA memory organization and faster FPGAs, a speedup of 40x to 100x over a microprocessor implementation can be achieved.
In [38], the authors use the SRC development suite Carte®
to implement a tightly coupled MD simulation kernel (not a complete MD software package such as AMBER) on the SRC-6E MAPstation. Like our approach, the important tasks of an MD simulation are analyzed and partitioned such that the most intensive are executed in the reconfigurable hardware and the rest are executed on the general-purpose processor. Even though only a portion of the simulation is accelerated in the MAP, the single-precision implementation achieves a 2x speedup over the software baseline running on the MAPstation host.
Neither [19, 6], nor [38] are concerned with the problem of accelerating existing, production-level, MD simulation software nor have they been tested with more than a few thousand particles. The most closely related work comes from [30] where the authors implement a simplified version of an MD algorithm in NAMD [29], an MD simulation package, on the SRC-6 MAPstation. While their implementation does trace the steps involved in porting a large-scale scientific code to FPGA-enabled systems, they do not cover memory analysis and characterization or the performance modeling work presented in this article.
Fig. 4.1. Call tree for the direct Ewald calculations in sander. Calls to functions f1, f2, and f3 are made once every time step; calls to f4 depend on the number of atoms in the system; f5 is called twice as many times as f4.
but the number of calls to f4 depends on the number of atoms in the system. For instance, when the number of atoms is 143784, f1, f2 and f3 are called once but f4 is called 143784 times and f5 is called 143784*2 times. This knowledge about the number of invocations plays a very important role in the decision making process, because there is a substantial call overhead (∼0.3 sec on SRC-6E) involved in calling a function that is mapped
on the FPGA devices from the host processor.
Table 4.1
Contribution of individual functions in the direct PME execution times.
Number of atoms 23558 61641 143784 194262
f1 (% of total) 0.1% 0.1% 0.2% 0.2%
f2 (% of total) 0.4% 0.5% 0.5% 0.5%
f3 (% of total) 82.1% 86.2% 86.4% 85.8%
f4 (% of f3) 86.1% 85.9% 88.4% 88.4%
f5 (% of f4) 18.8% 20.9% 17.9% 17.9%
After analyzing the call tree and contributions of individual functions in the direct Ewald calculations, we decided to map the branch functions f3, f4 and f5, onto the FPGA devices. First, we analyzed the loop structure within each of the three functions (Figure 4.1 and Figure 4.2). Function f4 has two nested loops that iterate through all atoms in the system. The outermost loop has a fixed count, which depends on the unit cell grid dimensions (a unit cell grid is shown in Figure 4.3), while the two inner loops are calculated at runtime.
The size of the unit cell grid depends on a number of factors including the size of the protein, number of atoms, density and types of atoms. The unit cell is divided in subcells, and each subcell contains a different number of atoms. Note that biological systems do not have a uniform density. Hence, the subcell iterations depend on the number of atoms in the currently selected subcell, which can range from 0 to a maximum density. Furthermore, the number of atoms in a subcell changes as the simulation progresses because the positions of atoms are not fixed.
Function f3
Do loop1=1, indexhi (fixed)
Do loop2=1, subcell(loop1) (variable) Call f4
Function f4
Do loop3=1, icount (variable)
Fig. 4.2. A pseudo-code for the three nested loop in the direct PME calculations.
Fig. 4.3.A schematic representation of a biomolecule in a unit cell.
Nevertheless, this value is not constant for individual atoms since the atoms move around during the simulation. A pair list, that contains pairing information of individual atoms with all other atoms in the system is, therefore, updated throughout the simulation run.
Application of the Performance Enhancing Features. Deep pipelining, concurrent execution capa-bilities and data streaming are the main performance advantages of FPGA devices for computing applications. These features are exploited during implementation to achieve a higher speedup for the direct Ewald calculation. Since our FPGA implementation is developed using Fortran, the three loops mentioned earlier are not different from the original implementation. The nested calls to functions f3, f4 and f5 in the original code are replaced by a single invocation to a SRC MAP (FPGA implementation) function that performs the calculations of the three functions on the FPGA devices.
The only differences between the original and FPGA implementation are the additional calls for data transfers between the host processor and the on-board memory of the MAP and the FPGA-specific constructs for parallel execution of the code blocks. A schematic of the process is shown in Figure 4.4. The control lines are shown in arrows (from source to target) and the data lines are shown in dotted lines. The host processor oversees the control and data movement between the host and the FPGA devices. However, once the devices are setup, the primary FPGA manages the DMA operations and the data transfers between the FPGAs. Note that all control and data transfer calls shown in Figure 4.4 can be active simultaneously. In addition, the SRC systems have multiple data ports; for instance, three 64-bit elements can be transferred between the two FPGAs in a single clock cycle.
Fig. 4.4.Control and data paths between the host and FPGA devices.
Deep pipelining allows a user to describe the parallelism in terms of a producer-consumer programming paradigm. A producer-consumer relationship can be between: (1) host and primary FPGA; (2) primary and sec-ondary FPGA; and (3) parallel sections within an FPGA. A ‘parallel section’ construct in the SRC programming permits task parallelism, i. e., multiple computation and data transfer tasks executing simultaneously. Typi-cally, streaming data is transferred between the producer and consumer devices. A deep pipelining example may include the following tasks executing in parallel:
1. DMA in a large array a1
2. DMA in two small arrays b1 and c1
3. Setup two communication ports with the sec-ondary FPGA
4. Send a1 to the secondary FPGA 5. Send c1 to the secondary FPGA
6. Compute within loop using b1 and a1, one el-ement at a time
7. Setup two communication ports with the primary FPGA
8. Receive a1 9. Receive c1
10. Continue the innermost loop of the primary FPGA and compute re-sult c1
The data transfer overheads and latencies in most cases, therefore, can be concealed using the deep pipelining and streaming techniques as long as there is sufficient work (computation) available to hide these latencies. The performance of the above pipeline will be the latency of the longest parallel section. Every effort is made to remove or reduce pipeline stalls, if the producer stream data element is not ready, the consumer stalls; likewise, if the consumer is not ready to accept the incoming data, the producer stalls. Additional performance improvements can be achieved with traditional loop optimization techniques like loop unrolling and flattening.
Algorithm Mapping onto the FPGA. To map the direct PME algorithm onto the FPGA devices, we characterized the data and control requirements of the algorithm implementation in the AMBER framework. For data requirements, we identified the local and non-local data elements, particularly the large arrays in the functions that are to be mapped onto the FPGA devices. These arrays include those containing the complete cell image coordinates, the force coordinates, pair information, Ewald tables, and indices to non-bond interactions. The sizes of the arrays depend on a number of parameters, primarily the number of atoms and dimensions of the unit cell grid. For example, for the 23558 atoms experiment, the indices arrays contain over 30K, floating-point data elements.
For control operations, we identified the loops that are potential targets for exploiting parallelism. The outermost PME loop has a fixed (constant) index, which depends on the dimension of the unit cell grid. The indices of the two nested loops within the outermost loop are determined at runtime. In addition, there are some smaller loops with a few tens of iterations that determine the runtime indices of the innermost loop. The calculations in the innermost loop are distributed between the two FPGA devices to exploit the concurrency that the two FPGAs offer. Moreover, the innermost loop is flattened creating the longest calculation in the pipeline and maximizing the throughput. We anticipate that the outermost loops can be flattened on FPGAs with larger logic capacities.
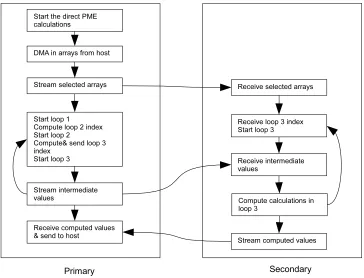
Fig. 4.5.Control flow of the direct PME calculation on the two FPGA devices.
primary FPGA. After computing and transferring the index of loop 3 to the secondary FPGA, partial nested loop calculations are performed on the primary FPGA. Since the bridge ports are already configured with the secondary FPGA, as soon as the data is generated on the first FPGA it is available to the second FPGA where the streaming calculations continue. The gray area in the diagram shows the deep pipeline that spans across two FPGA devices. The 3×3 virial arrays computed on the secondary FPGA are stored in intermediate arrays
and are transferred to the primary FPGA after the three loops have concluded. The primary FPGA then makes this data available to the host processor.
5. Performance Analysis. We use two metrics to compare performance of the FPGA-accelerated code with the microprocessor-only execution times. The first metric is traditional speedup:
Speedup = Runtimemicroprocessor/RuntimeFPGA-accelerated code
The second metric (used by the application scientists) is the science-based metric: pico-seconds (10-12) per simulation day (psec/day). This metric determines the time to simulate a biological system at the required time scales and is useful when comparing simulations of various sizes across different computing systems.
We measured the performance of the FPGA-accelerated code for two test cases namelyjac (joint amber-charmm) andHhaI. The jac benchmark is part of the AMBER version 8.0 release and it contains 23558 atoms. HhaI is a protein-DNA system that contains 61641 atoms. The microprocessor-based performance is measured on the SRC host processor system, which is an Intel dual 2.8 GHz Xeon system. The SRC-6E FPGA devices run at 100 MHz, a clock frequency restriction imposed by the SRC system (current-generation FPGA devices have more logic and memory capacity and are capable of operating at higher frequencies). Nevertheless, we demonstrate the potential for FPGA acceleration for an important class of applications on these devices. The results from the FPGA-accelerated code are compared with the microprocessor-only implementation for both performance and accuracy to verify the correctness of the design.
To analyze the performance behavior, we used the SRC-6E performance analysis and debugging tools to measure the runtime contributions of key sections of the accelerated code. Runtimes for three sections are measured separately: (1) time to setup the MAP (calling overhead); (2) compute time; and (3) data transfer times. The time to setup the MAP has an additional cost (∼0.3 milliseconds) for the first invocation; in
subsequent invocations this cost is comparable to regular Fortran function calls. The data transfer time includes the time to receive data from the host and to send results back to the host. Compute time is the computation time spent on the two FPGA devices including the time to transfer data between the two devices. As expected, the data transfer overheads offset the performance gains in a na¨ıve implementation and the penalties are higher for the larger problem, HhaI. The compute only speedup increases with the problem size or the number of atoms, 3.3x and ∼4x, respectively. However, since the data transfer overheads also increase with the problem
size, the overall application speedup is reduced to less than one. At this stage, we concluded that the memory access requirements needed further characterization in order to achieve sustained performance on the FPGA devices.
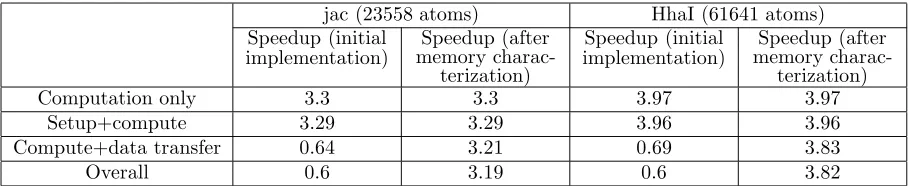
Table 5.1
Speedup of the PME calculations before and after memory characterization over the 2.8 GHz host microprocessor system
jac (23558 atoms) HhaI (61641 atoms)
Speedup (initial
implementation) memory charac-Speedup (after terization)
Speedup (initial
implementation) memory charac-Speedup (after terization)
Computation only 3.3 3.3 3.97 3.97
Setup+compute 3.29 3.29 3.96 3.96
Compute+data transfer 0.64 3.21 0.69 3.83
Overall 0.6 3.19 0.6 3.82
using the streaming directives provided in the SRC programming environment. Although these are partially done in the first implementation, carefully overlapping and pipelining additional data transfers can further improve performance. Finally, algorithm-specific optimizations are exploited by characterizing the memory access behavior and patterns in the accelerated code. We employed the last approach since it also leverages the other optimization techniques.
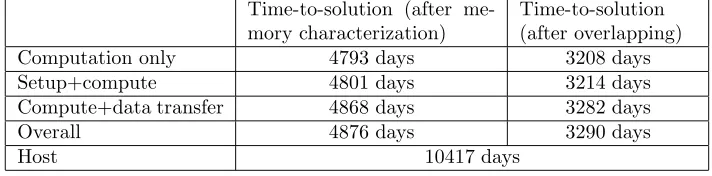
Implementation of the accelerated PME calculation is further modified according to memory access classifi-cation and characterization. This implementation, however, does not include any modificlassifi-cation to the AMBER source code on the host to exploit additional benefits from multithreading with pthreads or OpenMP. Only the Fortran code for the FPGA-accelerated calculations is modified to reduce the unnecessary data transfer overheads. Amazingly, the modified code resulted in a very significant reduction in the data transfer costs; the data transfer costs that previously accounted for over 70% of the total execution time, are now less that 5% of the total execution time resulting in sustained accelerated performance with the FPGA devices. Ta-ble 5.1 summarizes the performance improvements for jac and HhaI experiments.The time-to-solution metric is calculated for a nano-second scale simulation (106 time steps) and is presented for the jac benchmark in Table 5.2. We also measure and include time for the non-accelerated calculations; a constant for both host processor and FPGA-accelerated code because they are always executed on the host processor. We calculate the performance improvement achieved by overlapping the ‘direct’ and ‘reciprocal’ PME calculations on FPGA and host respectively (OpenMP constructs in the PME-AMBER source code enable the overlap).
Table 5.2
Time-to-solution for the SRC 6E FPGA-accelerated code for the jac benchmark
Tito-solution (after me-mory characterization)
Time-to-solution (after overlapping)
Computation only 4793 days 3208 days
Setup+compute 4801 days 3214 days
Compute+data transfer 4868 days 3282 days
Overall 4876 days 3290 days
Host 10417 days
From the values in Table 4, we estimate time for a nano-second scale simulation instead of our target micro-second scale simulation. A nano-micro-second simulation will take over 10 days on the microprocessor system with dual 2.8 GHz Xeon system, about 5 days on an FPGA accelerated code, and just over 3 days by overlapping FPGA and host execution. (Note: these computations are for the older-generation FPGAs on the SRC-6E.)
6. Modeling and Projections. In order to analyze the performance of the current system and predict the performance potential of future FPGA-enabled systems, we developed parameterized performance models of our current FPGA implementation. The models are parameterized with application parameters and system parameters allowing for the analysis of a variety of FPGA systems as well as larger biological simulations. The application parameters include the number of atoms, dimensions of the box, types of atoms, and number of residues. From the application parameters, we can generate the size of data transfers, physical memory requirements, and loop indices for the main computation loops. The FPGA system parameters are the FPGA clock frequency, bandwidth to the host processor, and bandwidth between the FPGA devices. Our modeling scheme is conservative because we do not take into account the characteristics of future FPGA devices that contain special features for double-precision floating-point calculations and logic capacities. Furthermore, we do not consider the performance advantages that can be achieved by flattening the three direct PME loops, which we anticipate will also be possible on larger FPGAs.
counts (variable and fixed) that are calculated from the application input parameters. Similarly, we calculate the number of data transfer bytes using the input parameters and apply the available memory bandwidth to determine the data transfer times. Since the sizes of data transfers do not depend on runtime values, the data transfer overheads are precisely measured for our current implementation. The workload requirement model and the runtime performance projection model are validated with the current SRC-6E implementations.
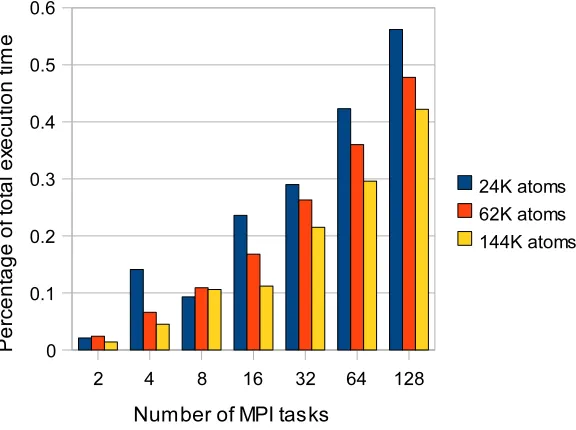
Fig. 6.1.Figure 12: Percentage of total execution time spent in MPI communication routines.
To develop a model for the parallel version of the application, we profiled MPI message sizes and timings on the Cray XT3 system, which has a high communication bandwidth compared to contemporary cluster systems. Figure 6.1 shows the fraction of total execution time spent in MPI communications for three test cases. We notice that the percentage of communication time increases with the number of parallel MPI tasks, and beyond 128 tasks it accounts for over 50% of total execution time. Although the fraction of MPI time decreases with the increase in the number of atoms, the reduction rate is much slower than the increase in number of atoms.
In addition to aggregate data collection, we investigated the runtime behavior of MPI messages and sizes. We note that the number and sizes of communication operations per simulation time step per processor is not constant. Also, AMBER does not use an MPI Cartesian topology; moreover, sizes for the MPI collective operations per processor do not change with the problem size or number of atoms. AMBER has a collection of programs that can run different MD simulations. In this study, we focused on the most widely used simulation method—explicit solvent simulations in sander.
We developed symbolic models for the communication phases with a fixed message size—an average of the smallest and largest message sizes exchanged in these phases. The largest message size does not change with processor count, while the smallest one scales linearly. These sizes are validated at runtime using the MPI profiling tool. The MPI Allreduce message sizes do not depend on the problem size, therefore, the collective message volume grows linearly with the problem size.
Fig. 6.2. Performance projections with varying FPGA performance metrics.
Projections on Future FPGA Devices. We use our validated performance models to carry out a num-ber of performance projection experiments. Figure 6.2 shows the performance projection results on a single-node FPGA accelerated system. We altered two FPGA-enabled system parameters for our experiments: the clock frequency and data bandwidth between the FPGA device and the host processor. The clock frequency of our current FPGA implementation is 100 MHz and the sustained payload bandwidth is 2.8 GB/s (utilizing input and output 1.4 GB/s bandwidth). The clock speed and data transfer rates have different performance impli-cations on small and large biological systems (Figure 6.2). Overall, the clock speed influences the performance gains of the PME calculations. For smaller biological systems, the change in the data transfer rates influences the runtime performance of the application. By contrast, the performance of the larger systems (100K and more atoms) nearly doubles by doubling the clock speed of the FPGA devices, while the data transfer rates alone do not significantly impact the runtime performance. Note that a∼150K atoms system only achieves∼12 psec/day
on a dual 2.8 GHz Xeon system today. An FPGA-enabled system using our current PME implementation can sustain over 75 psec/day with a 200 MHz FPGA and over 180 psec/day with a 500 MHz FPGA and a host bandwidth of 5.6 GB/s.
Parallel Efficiency. Based on the parameterized model of our FPGA implementation and a detailed analysis and modeling of MPI implementation of sander, we carry out performance projection studies on parallel systems with multiple FPGA accelerator devices. The FPGA-accelerated implementation of direct PME does not involve MPI communication; therefore, we can port the accelerated code without any modification to a parallel platform. However, we cannot take into account the contribution of overlapping the reciprocal and direct Ewald calculations because the reciprocal calculationsdo involve MPI communication. Hence, we consider a blocking implementation of the accelerated code; in other words, our performance estimates are highly conservative since the overlapping of calculations can result in significant performance benefits not only on small processor counts but also on 64–128 processor runs. We anticipate that simulations with 32 or more processors, the reciprocal Ewald calculation will contribute to a larger fraction of the runtime and the accelerated direct PME will have negligible runtime contributions.
We project runtime on a FPGA accelerated parallel system using the following expression:
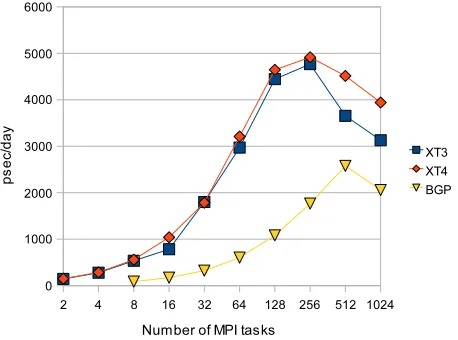
Computationtime=l1count∗(latencyl1+l2count∗(latencyl2+ latencyl3+l3count)/clockfrequency. Time on the host is the time that is not spent in communication and overlapped calculations. Considering a high-bandwidth communication network similar to Cray XT3 distributed memory system [5], we project perfor-mance in terms of psec/day for the 3 test systems with approximately 24K, 62K and 144K atoms respectively. We compare these results with the runtime measured on the XT3 system. For parallel performance projections, we conservatively targeted an FPGA with double the clock frequency, 200MHz, of the SRC-6E 100MHz. Cur-rently available FPGA devices are capable of operating at clock speeds higher than 200 MHz although they are only now becoming available in leading edge reconfigurable computing platforms. In addition, we consider no im-provement in the FPGA and host bandwidth, which is expected to be significantly higher for new production and future systems especially those connected via HyperTransport links. Figure 14 and Figure 15 show the through-put of an FPGA-accelerated system and the Cray XT3 in terms of psec/day. We note that speedup is sustained for simulation runs up to 16 MPI tasks in the FPGA accelerated system. For the 62K atoms experiment, a 32-processor FPGA-accelerated system could be as efficient as the largest configuration of the Cray XT3 and time to solution on a 2-node FPGA-accelerated system could be equivalent to large-scale Blue Gene L configurations.
Fig. 7.1.Parallel efficiency on the FPGA-accelerated system
Fig. 7.2.Parallel Efficiency on the Cray XT3 system
which are not accounted for in the current model. As new generations of these RC systems become available, we plan to collect performance data and validate our models in single-node and multi-node RC systems.
REFERENCES
[1] Amberhome pagehttp://amber.scripps.edu/
[2] Annapolis Microsystems,http://www.annapmicro.com, 2001. [3] Celoxica,Inc.,http://www.celoxica.com/
[4] K. Compton and S. Hauck,Reconfigurable Computing: A Survey of Systems and Software, ACM Comput. Surv., Vol. 34:2, pp. 171–210, June 2002.
[5] Cray Inc.,http://www.cray.com/
[6] DRC Computer Corp.,http://www.drccomp.com/
[7] GRMOACS,http://www.gromacs.org
[8] I. S. I. East,SLAAC: System-Level Applications of Adaptive Computing,http://slaac.east.isi.edu/ 2003. [9] NallatechFPGA-Centric Systems & Design Services,http://www.nallatech.com/2002.
[10] Virtual Computer Corporation,http://www.vcc.com/index.html2002. [11] SGI Inc.,http://www.sgi.com
[12] SRC Computers,Inc.,http://www.srccomp.com
[13] Xilinx Inc.,Virtex-II Platform FPGAs: Complete Data Sheet, June 2004. [14] XtremeData Inc.,http://www.xtremedatainc.com
[15] P. K. Agarwal,Enzymes: An integrated view of structure, dynamics and function,Microbial Cell Factories, 5:2, 2006. [16] S. R. Alam, P. K. Agarwal, J. S. Vetter and Al Geist,Performance Characterization of Molecular Dynamics Techniques
for Biomolecular Simulations,Proc. Principles and Practices of Parallel Programming (PPoPP), 2006.
[17] S. R. Alam, P. K. Agarwal, D. Caliga, M. C. Smith and J. S. Vetter,Using FPGA devices to Accelerate Biomolecular Simulations,IEEE Computer, Vol. 40. No. 3, 2007.
[18] S. R. Alam and P. K. Agarwal,On the Path to Enable Multi-scale Biomolecular Simulations on PetaFLOPS Supercomputer with Multi-core Processors,IEEE Int. Workshop on High Performance Computational Biology, 2007.
[19] N. Azizi, I. Kuon, A. Egier, A. Darabiha, and P. Chow,Reconfigurable Molecular Dynamics Simulator,IEEE Symposium on Field-Programmable Custom Computing Machines, 2004.
[20] B. R. Brooks, R. E. Bruccoleri, B. D. Olafson, D. J. States, S. Swaminathan, and M. KarplusCHARMM: A program for macromolecular energy, minimization, and dynamics calculations,Journal of Computational Chemistry, 1983. [21] D. A. Case, T. E. Cheatham, T. A. Darden, H. Gohlke, R. Luo, K. M. Merz, A. Onufriev, C. Simmerling, B. Wang
and R. J. Woods,The Amber Biomolecular Simulation Programs,Journal of Comp. Chemistry: 1668-1688, 2005. [22] M. Crowley, T. A. Darden, T. E. Cheatham, and D. W. Deerfield,Adventures in Improving the Scaling and Accuracy
of Parallel Molecular Dynamics Program,Journal of Supercomputing, 11, 1997.
[23] T. Darden, D. York and L. Pederson,Particle Mesh Ewald: an Nlog(N) method for Ewald sums in large systems,J. Chem. Phys. 98, 1993.
[24] H. ElGindy and Y. Shue,On Sparse Matrix-vector Multiplication with FPGA-based System,Proc. 10th
Annual IEEE Symp. on Field-Programmable Custom Computing Machines, 2002.
[25] S. C. Goldstein, H. Schmit, M. Budiu, S. Cadambi, M. Moe, and R. R. Taylor,PipeRench: A Reconfigurable Architec-ture and Compiler, IEEE Computer, pp. 70–77, Vol. 33, No. 4, Apr.2000.
[26] K. S. Hemmert and K. D. Underwood,An Analysis of the Double-Precision Floating-Point FFT on FPGAs,IEEE Sym-posium on Field Programmable Custom Computing Machines (FCCM05), 2005.
[27] M. C. Herbort, T. VanCourt, Y. Gu, B. Sukhwami, Al Conti, J. Model and D. DiSabello,Achieving High Performance with FPGA-Based Computing,IEEE Computer, Vol. 40. No. 3, 2007.
[28] L. Kale, R. Skeel, M. Bhandarkar, R. Brunner, A. Gursoy, J. Phillips, A. Shinozaki, K. Varadarajan, and K. Schul-ten,NAMD2 : Greater scalability for parallel molecular dynamics,Journal of Comp. Physics, 151, 1999.
[29] V. Kindratenko and D. Pointer,A case study in porting a production scientific supercomputing application to a reconfig-urable computer,IEEE Symposium on Field-Programmable Custom Computing Machines, 2006.
[30] A. R. Leach,Molecular Modeling: Principles and Applications,Prentice Hall, 2001.
[31] P. H. W. Leong, M. P. Leong, O. Y. H Cheung, T. Tung, C. M. Kwok, M. Y. Wong, and K. H. Lee, Pilchard— A Reconfigurable Computing Platform With Memory Slot Interface, Proceedings of the IEEE Symposium on Field-Programmable Custom Computing Machines (FCCM), 2001, California USA, IEEE.
[32] J. S. Meredith, S. R. Alam and J. S. Vetter, Analysis of a Computational Biology Simulation Technique on Emerging Processing Architectures,IEEE Int. Workshop on High Performance Computational Biology, 2007.
[33] M. Myers, K. Jaget, S. Cadambi, J. Weener, M. Moe, H. Schmit, S. C. Goldstein and D. Bowersox, PipeRench Manual, p. 41, 1998, Carnegie Mellon University.
[34] M. Ohmacht, R. A. Bergamaschi, S. Bhattacharya, A. Gara, M. E. Giampapa, B. Gopalsamy, R. A. Harring, D. Hoenicke, D. J. Krolak, J. A. Marcella, B. J. Nathanson, V. Salapura and M. E. Wazlowski,Blue Gene/L compute chip: Memory and Ethernet subsystem,IBM Journal of Research and Development, Vol. 49, No. 2/3, 2005. [35] S. J. Plimpton,Fast parallel algorithms for short-range molecular dynamics,Journal of Comp. Physics, 117, 1995. [36] V. K. Prasanna and G. R. Morris, Sparse Matrix Computation on Reconfigurable Hardware, IEEE Computer, Vol. 40,
No. 3, 2007.
[37] R. Scrofano, M. Gokhale, F. Trouw, and V. Prasanna, A Hardware/Software Approach to Molecular Dynamics on Reconfigurable Computers,IEEE Symposium on Field-Programmable Custom Computing Machines, 2006.
[39] C. Sosa, T. Hewitt, M. Lee and D. Case,Vectorization of the generalized Born model for molecular dynamics on shared memory computers, Journal of Molecular Structure (Theochem) 549, 2001.
[40] M. Taiji, T. Narumi, Y. Ohno, and A. Konagaya,Protein Explorer: A Petaflops Special-Purpose Computer System for Molecular Dynamics Simulations,Supercomputing Conference, 2003.
[41] A. Toukmaji, C. Sagui, J. Board, and T. Darden,Efficient particle-mesh-Ewald based approach to fixed and induced dipolar interactions,J. Chem. Phys 113, 2000.
[42] K. Underwood,FPGAs vs. CPUs: Trends in Peak Floating-Point Performance,Proc. 12th
International Symposium on Field Programmable Gate Arrays (FPGA04), 2004.
[43] K. D. Underwood and K. S. Hemmert,Closing the GAP: CPU and FPGA Trends in Sustainable Floating-Point BLAS Performance,Proc. IEEE Symposium on Field-Programmable Custom Computing Machines (FCCM04), 2004. [44] J. S. Vetter, S. R. Alam, T. H. Dunigan, Jr., M. R. Fahey, P. C. Roth and P. H. Worley,Early Evaluation of the
Cray XT3,20th IEEE International Parallel & Distributed Processing Symposium (IPDPS), 2006.
[45] L. Zhou and V. Prasanna, High Performance Linear Algebra Operations on Reconfigurable Systems, Supercomputing Conference, 2005.
Edited by: Dorothy Bollman and Javier D´ıaz Received: October 18th, 2007