PREDICTION AND UTILITY OF A CLINICAL FRACTURE RISK SCORE IN ADMINISTRATIVE CLAIMS
Robert Allen Overman
A dissertation submitted to the faculty of the University of North Carolina at Chapel Hill in partial fulfillment of the requirements for the degree of Doctor of Philosophy in Pharmaceutical Sciences in the Division of Pharmaceutical Outcomes and Policy, UNC
Eshelman School of Pharmacy.
Chapel Hill 2017
Approved By:
M. Alan Brookhart Stacie B. Dusetzina Joel F. Farley
Margaret L. Gourlay Betsy L. Sleath
ii
© 2017
Robert Allen Overman ALL RIGHTS RESERVED
iii ABSTRACT
ROBERT ALLEN OVERMAN: Prediction and Utility of a Clinical Fracture Risk Score in Administrative Claims
(Under the direction of Stacie B. Dusetzina)
The clinical manifestation of osteoporosis is osteoporotic fracture, which has been estimated to cost $25.3 billion by 2025 within the US healthcare system. Osteoporotic fracture risk has been measured using various risk scores with the most prevalent being FRAX® from the World Health Organization. FRAX® scores are used clinically to guide treatment, but these scores and key inputs (such as bone mineral density and body mass index) cannot be measured in administrative claims. The objectives of this dissertation are 1) to create a claims-based fracture risk score to determine if administrative claims data can be used to predict FRAX® (interval validation); to evaluate how the risk score performs in a different population (external validity);
and 3) to determine the best way to utilize the fracture risk score in a research study.
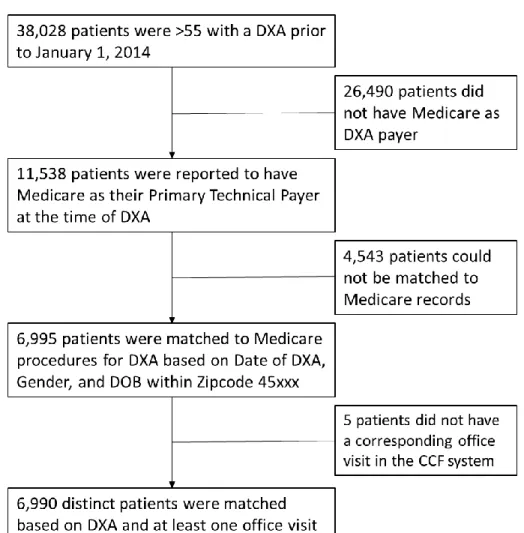
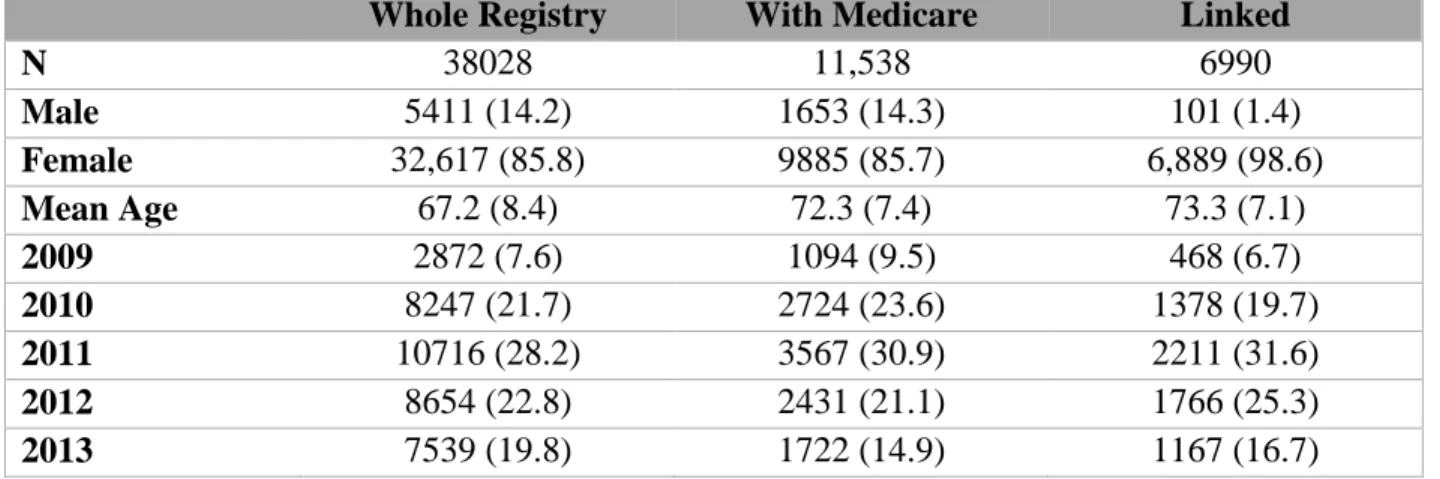
For this project, we linked registry data including clinical fracture risk factors from a multispecialty academic hospital with Medicare administrative claims for individuals receiving a dual energy x-ray absorptiometry scan (DXA) between 2009 and 2013. FRAX® has 4 different scores for 10-year fracture risk of hip and major osteoporotic fracture (MOF) with and without bone mineral density. We created the Calculated Fracture Risk Index (CFRI) to estimate these 4 scores. We found that we were able to predict a continuous FRAX® score with an adjusted R2 that accounted for between 21 to 43% of variation in the estimates. We found these estimates to be internally valid.
iv
Subsequently we used the linked dataset and a 20% random selection of fee-for-service Medicare beneficiaries to evaluate the external validity of our CFRI scores. We found no significant differences in CFRI and FRAX® ability to predict 1 year fractures. Additionally, we found CFRI and FRAX® to be similarly calibrated.
Lastly, we found that we were not able to sufficiently reduce confounding in a non- experimental comparative effectiveness study of alendronate users versus non-users to that of a randomized clinical trial using CFRI as a regression component or a restriction device. Although estimates including CFRI reduced confounding, residual confounding remained and estimates differed from those in the Fracture Intervention Trial (FIT); the gold standard in for our comparisons.
Overall CFRI appears to be internally and externally valid and a useful tool in reducing confounding compared to its non-use in osteoporosis research, though not to the level of an RCT.
It also appears to be a reasonable proxy score for FRAX® when only administrative claims data are available. Therefore, CFRI when calculated in administrative claims should be useful for both researchers and policy makers to determine who is at risk for osteoporotic fracture.
v
ACKNOWLEDGEMENTS
This dissertation is dedicated to my three children, Ainsley, Thatcher, and Poppy.
Without the three of you I would have lost my way a long time ago. I also want to thank my family and friends for standing by me through both the good and bad throughout this
dissertationm Particularly my parents, (Ed and Linda) and my sisters (Kathryn and Linnea). Life may have not gone the way that I thought it would, but you always supported me nonetheless.
I have to particularly say thank you to Dr. Chad Deal and Dr. Margaret Gourlay. Without the two of you I don’t know what type research I would have done, but it probably wouldn’t have been osteoporosis. The two of you have kept me on track even when I didn’t know what that track looked like. Additionally, I need to thank Dr. Jeffrey Curtis at UAB for proposing the idea of linking the data for this project at UAB, this saved me valuable time and headaches. To my committee at UNC, I know I wasn’t the easiest student and I thank you for guiding me even when I didn’t want the help. To Dr. Dusetzina, I hope you enjoy your Wednesday afternoons without having to hear me lament about this project. I also have no idea how my career would have turned out if Dr. Brookhart hadn’t picked me out of class in my first year and provided me with opportunities that I would have never thought of myself.
This project always and I have always had support through my division (DPOP), from my adoptive group (Pharmacoepi), and from Rheumatology at CCF, for this I eternally grateful.
RAO - Liverpool, Merseyside, United Kingdom 06APR2017
vi
TABLE OF CONTENTS
ABSTRACT ... iii
ACKNOWLEDGEMENTS ... v
LIST OF TABLES ... xi
LIST OF FIGURES ... xviii
LIST OF ABBREVIATIONS ... xxi
INTRODUCTION ... 1
1.1 Overview ... 1
1.2 Specific Aims ... 4
1.3 Importance of Proposed Research Plan ... 7
BACKGROUND ... 11
2.1 Introduction ... 11
2.2 Osteoporotic Fracture ... 14
2.2.1 Definition ... 14
2.2.2 Epidemiology of Fracture ... 21
2.2.3 Validated fracture sites ... 26
2.2.4 Administrative claims-based definitions ... 26
2.3 Burden of Osteoporosis and Osteoporotic Fracture ... 28
2.3.1 Prevalence ... 28
vii
2.3.2 Morbidity ... 30
2.3.3 Mortality ... 30
2.3.4 Economic ... 32
2.4 FRAX® WHO Fracture Risk Assessment Tool ... 33
2.4.1 Background ... 33
2.4.2 Development of FRAX® Algorithm ... 35
2.4.3 US-FRAX ... 39
2.4.4 Other Risk Scores ... 41
2.4.5 National Osteoporosis Foundation (NOF) ... 42
2.5 Treatment ... 49
2.5.1 Pharmacologic Therapy ... 49
2.5.2 AOM Safety ... 68
2.5.3 Comparative Effectiveness and Epidemiology of AOM use ... 70
2.5.4 Universal Supplement Recommendations ... 72
2.6 Quality Measures and Evaluation of Guidelines ... 72
2.7 Framework for variable selection ... 76
2.7.1 Andersen’s Behavioral Model of Health Services Use ... 77
2.8 Summary ... 88
METHODS ... 89
3.1 Data Sources ... 89
3.1.1 Cleveland Clinic (CCF) ... 89
3.1.2 University of Alabama at Birmingham (UAB) ... 90
3.1.3 CCF/Medicare Linkage (Linked Sample) ... 90
3.1.4 Medicare 20% Random Sample (Random Sample) ... 92
3.2 Aim 1 ... 93
viii
3.2.1 Step 1: Select covariates ... 95
3.2.2 Step 2: Determine model type and outcome ... 99
3.2.3 Step 3: Evaluate Model Parameters ... 102
3.3 Aim 2 ... 105
3.3.1 Calibration ... 108
3.3.2 Discrimination ... 111
3.4 Aim 3 ... 112
3.4.1 Study Design ... 113
3.4.2 Analysis Plan ... 123
Aim 1 Results ... 131
4.1 Cohort Selection ... 131
4.2 Prediction ... 134
4.2.1 With BMD Cohort ... 134
4.2.2 Without BMD Cohort ... 158
4.3 Summary ... 179
4.3.1 Hip with BMD ... 180
4.3.2 MOF with BMD ... 180
4.3.3 Hip without BMD... 181
4.3.4 MOF with BMD ... 182
Aim 2 results ... 183
5.1 Study Population... 183
5.1.1 Characteristics of the Random Population ... 186
5.2 Analysis ... 190
5.2.1 Hip with BMD CFRI score ... 190
ix
5.2.2 Major Osteoporotic Fracture with BMD CFRI Score ... 195
5.2.3 Hip without BMD... 199
5.2.4 MOF without BMD ... 203
5.3 Sensitivity Analysis ... 207
5.3.1 CFRI with BMD ... 207
5.3.2 CFRI without BMD ... 210
5.4 Summary ... 213
Aim 3 results ... 215
6.1 Overview ... 215
6.1.1 Study Population ... 215
6.1.2 Use of CFRI ... 216
6.1.3 Outcomes ... 216
6.2 Approach 1 ... 217
6.2.1 Study Population ... 217
6.2.2 Unrestricted Population Results ... 222
6.2.3 FIT restricted population results... 225
6.2.4 Conclusions ... 232
6.3 Approach 2: Non-Users are New Initiators of Statins, Hypertensives and Diabetes Drugs ... 233
6.3.1 Study Population ... 233
6.3.2 Unrestricted Population Results ... 238
6.3.3 FIT restricted population results... 241
6.3.4 Conclusions ... 246
6.4 Approach 3 ... 247
6.4.1 Study Population ... 247
6.4.2 Unrestricted Population Results ... 252
x
6.4.3 FIT restricted population results... 255
6.4.4 Conclusions ... 261
Discussion ... 263
7.1 Aim 1 ... 267
7.2 Aim 2 ... 271
7.3 Aim 3 ... 275
7.4 Strengths and Limitations ... 278
7.5 Future Directions ... 281
APPENDIX ... 284
REFERENCES ... 359
xi
LIST OF TABLES
Table 2.1: Osteoporosis Classifications ... 20
Table 2.2 Administrative Claims Osteoporotic Fracture Definitions ... 28
Table 2.3: Risk Factors Included in the Fracture Risk Assessment Model (FRAX) ... 37
Table 2.4 FRAX® 10-year risk sites ... 37
Table 2.5 US Osteoporosis Guidelines ... 43
Table 2.6 Anti-Osteoporosis Medications ... 50
Table 2.7 Alendronate v Placebo Randomized Control Trials with Fracture as an Outcome ... 57
Table 2.8 Quality Measures by Steward ... 74
Table 2.9 Variables associated with Osteoporosis or Osteoporotic Fracture ... 86
Table 2.10 Mechanism of Action for Conditions and Medications Associated with Osteoporosis and Osteoporotic Fracture ... 87
Table 2.11 Conditions and Medications associated with Falling ... 87
Table 3.1 Linked Population Characteristics ... 92
Table 3.2 Content Variables Associated with Osteoporosis (Coding Algorithms) ... 96
Table 3.3 FRAX® Major Osteoporotic Fracture Site Codes ... 108
Table 3.4 Aim 3 Fracture Definitions ... 123
Table 3.5 Power Calculation Table ... 124
Table 3.6 FIT Claims-based Restrictions... 125
Table 4.1 Basic Demographics of with BMD population... 135
Table 4.2 Hip Linear Model Error Terms ... 139
Table 4.3 LASSO Hip with BMD Model Results ... 140
xii
Table 4.4 Elastic Net Hip with BMD Model Results ... 141
Table 4.5 Best Linear hip with BMD models ... 142
Table 4.6 Model coefficients for best linear hip with BMD ... 144
Table 4.7 MOF with BMD Linear Model Error Terms ... 149
Table 4.8 LASSO MOF with BMD Model Results ... 150
Table 4.9 Elastic Net MOF with BMD untransformed model results ... 151
Table 4.10 Best linear MOF with BMD models ... 152
Table 4.11 Model coefficients for the best 3 linear MOF with BMD models ... 155
Table 4.12 Basic Demographics of the without BMD population... 159
Table 4.13 Hip without BMD Linear Model Error Terms... 163
Table 4.14 LASSO Hip without BMD Model Results ... 164
Table 4.15 Elastic Net Hip without BMD Model Results ... 165
Table 4.16 Comparison of the best linear hip without BMD models ... 165
Table 4.17 Model Coefficients for Best Linear Hip without BMD ... 167
Table 4.18 MOF without BMD Basic Linear Model Error Terms ... 172
Table 4.19 LASSO MOF without BMD Model Results... 173
Table 4.20 Elastic Net MOF without BMD Model Results... 174
Table 4.21 Comparison of the best linear MOF without BMD models ... 174
Table 4.22 Model Coefficients for Linear MOF without BMD ... 177
Table 5.1. Population Characteristics of the Random Population ... 187
Table 5.2 Hip with BMD CFRI Model Coefficients ... 190
Table 5.3 MOF with BMD CFRI Model Coefficients ... 195
Table 5.4 Hip without BMD CFRI Coefficients ... 199
xiii
Table 5.5 MOF without BMD CFRI Model Coefficients... 203 Table 6.1 Approach 1 (All New Users), Characteristics of the
Study Population before Restricting to FIT Criteria ... 220 Table 6.2 Unrestricted Population for Approach 1 (All New Users),
Hazard Ratio for MOF at 365-days comparing alendronate use to non-use... 222 Table 6.3 Unrestricted Population for Approach 1 (All New Users),
Hazard Ratio for MOF using all available time ... 224 Table 6.4 Population Characteristics of Restricted Population in
Approach 1 (All New Users) ... 227 Table 6.5 FIT-restricted population using CFRI at one year,
Approach 1 (All New Users) ... 230 Table 6.6 FIT-Restricted Population All Available time,
Approach 1 (All New Users) ... 232 Table 6.7 Unrestricted-population Characteristics of Approach 2,
Alendronate Users and Diabetes, Hypertension, and Statin Users (Non-Users) ... 236 Table 6.8 Hazard Ratios of the Unrestricted Population at 365-days
comparing Alendronate Users to Non-Users, Approach 2
(Diabetes, Hypertension, and Statin Users) ... 239 Table 6.9 Hazard Ratios of the Unrestricted Population using all
available time comparing Alendronate Users to Non-Users, Approach 2
(Diabetes, Hypertension, and Statin Users) ... 241 Table 6.10 Population Characteristics of Restricted Population in
Approach 2 (Diabetes, Hypertension, and Statin Users) ... 242
xiv
Table 6.11 Hazard Ratios for FIT-restricted population using MOF without BMD CFRI at one year, Approach 2 (Diabetes, Hypertension,
and Statin Users) ... 244 Table 6.12 FIT-Restricted Population All Available time, Approach 2
(Diabetes, Hypertension, and Statin Users) ... 245 Table 6.13 Approach 3 (DXA visit as non-user) Characteristics of the
Study Population ... 250 Table 6.14 Unrestricted Population for Approach 3 (DXA visit as non-user),
Hazard Ratio for MOF at 365-days comparing Alendronate Users to Non-Users ... 253 Table 6.15 Unrestricted Population for Approach 3 (DXA visit as non-user),
Hazard Ratio for MOF using all available time ... 254 Table 6.16 Population Characteristics of Restricted Population in
Approach 3 (DXA visit as non-user) ... 257 Table 6.17 FIT-restricted population at one year, Approach 3
(DXA visit as non-user) ... 260 Table 6.18 FIT-Restricted Population All Available time, Approach 3
(DXA visit as non-user) ... 261 Table A1 Approach 1, MOF 365 no restriction, regression coefficients ... 284 Table A2 Approach 1, MOF All available, no restriction, regression coefficients ... 286 Table A3 Approach 1, MOF 365 days, CFRI Without BMD,
regression coefficients ... 289 Table A4 Approach 1, MOF All available, CFRI Without BMD,
regression coefficients ... 291
xv
Table A5 Approach 1, MOF 365 days, CFRI With BMD, regression coefficients ... 293 Table A6 Approach 1, MOF All Available, CFRI With BMD,
regression coefficients ... 295 Table A7 Approach 1 Vertebral Fracture 365 days, no restriction,
regression coefficients ... 297 Table A8 Approach 1 Vertebral Fracture All Available, no restriction,
regression coefficients ... 299 Table A9 Approach 1 Vertebral Fracture 365 days, CFRI Without BMD,
regression coefficients ... 302 Table A10 Approach 1 Vertebral Fracture All Available, CFRI Without BMD,
regression coefficients ... 304 Table A11 Approach 1 Vertebral Fracture 365 days, CFRI With BMD,
regression coefficients ... 306 Table A12 Approach 1 Vert All Available, CFRI With BMD,
regression coefficients ... 308 Table A13 Approach 2 MOF 365 days, no restriction, regression coefficients ... 310 Table A14 Approach 2 MOF All Available, no restriction,
regression coefficients ... 312 Table A15 Approach 2 MOF 365 days, CFRI Without BMD,
regression coefficients ... 315 Table A16 Approach 2 MOF All Available, CFRI Without BMD,
regression coefficients ... 317 Table A17 Approach 2 MOF 365 days, CFRI With BMD, regression coefficients ... 319
xvi
Table A18 Approach 2 MOF All Available, CFRI With BMD,
regression coefficients ... 320 Table A19 Approach 2 Vertebral Fracture 365 days, no restriction,
regression coefficients ... 322 Table A20 Approach 2 Vertebral Fracture All Available, no restriction,
regression coefficients ... 324 Table A21 Approach 2 Vertebral Fracture 365 days, CFRI Without BMD,
regression coefficients ... 327 Table A22 Approach 2 Vertebral Fracture All Available, CFRI Without BMD,
regression coefficients ... 329 Table A23 Approach 2 Vertebral Fracture 365 days, CFRI With BMD,
regression coefficients ... 331 Table A24 Approach 2 Vertebral Fracture All Available, CFRI With BMD,
regression coefficients ... 332 Table A25 Approach 3 MOF 365 days, no restriction, regression coefficients ... 334 Table A26 Approach 3 MOF All Available Time, no restriction,
regression coefficients ... 336 Table A27 Approach 3 MOF 365 days, CFRI Without BMD,
regression coefficients ... 338 Table A28 Approach 3 MOF All Available, CFRI Without BMD,
regression coefficients ... 341 Table A29 Approach 3 MOF 365 days, CFRI With BMD,
regression coefficients ... 343
xvii
Table A30 Approach 3 MOF, All Available, CFRI With BMD,
regression coefficients ... 344 Table A31 Approach 3 Vertebral Fracture 365 Days, no restriction,
regression coefficients ... 346 Table A32 Approach 3 Vertebral Fracture All Available, no restriction,
regression coefficients ... 348 Table A33 Approach 3 Vertebral Fracture 365 Days, CFRI Without BMD,
regression coefficients ... 351 Table A34 Approach 3 Vertebral Fracture All Available, CFRI Without BMD,
regression coefficients ... 353 Table A35 Approach 3 Vertebral Fracture 365 days, CFRI With BMD,
regression coefficients ... 355 Table A36 Approach 3 Vertebral Fracture All Available, CFRI With BMD,
regression coefficients ... 357
xviii LIST OF FIGURES
Figure 2.1 Osteoporosis Standard of Care ... 11
Figure 2.2 Aims role in Standard of Care ... 13
Figure 2.3 Pathogenesis of osteoporosis-related fractures ... 15
Figure 2.4 US-FRAX® web interface ... 40
Figure 2.5 Carepath diagram ... 47
Figure 2.6 Weighted Relative Risks ... 64
Figure 2.7 Inclusion and Exclusion Criteria for the Fracture Intervention Trial (FIT) ... 66
Figure 2.8 Modified Andersen's Behavioral Model of Health Services Use ... 79
Figure 3.1 CCF/Medicare Linkage Flow Diagram ... 91
Figure 3.2 Aim 1 Study Schematic ... 94
Figure 3.3 Aim 2 Study Schematic ... 107
Figure 3.4 Aim 3 Schematic Part 1 ... 117
Figure 3.5 Aim 3 Schematic Part 2 ... 119
Figure 3.6 Aim 3 Restriction Study Schematic ... 121
Figure 4.1 Aim 1 Patient Flowchart ... 133
Figure 4.2 Density Plot of FRAX(R) Hip with BMD ... 138
Figure 4.3 Density Plot of Best 3 Hip with BMD models ... 143
Figure 4.4 Scatterplot of Best Hip compared to FRAX ... 145
Figure 4.5 Receiver Operating Curve CFRI compared to 3% treatment threshold ... 146
Figure 4.6 Density Plots of Test and Training Sample for MOF with BMD ... 148
Figure 4.7 Density Plot of Best 3 Linear MOF with BMD models ... 153
Figure 4.8 Scatterplot of best MOF with BMD model ... 153
xix
Figure 4.9 Receiver Operating Curve for MOF with BMD 20% Threshold ... 157
Figure 4.10 Density Plot of FRAX® Hip without BMD ... 162
Figure 4.11 Kernel Density plot of best 3 linear hip without BMD models ... 166
Figure 4.12 Best Hip without BMD model scatterplot ... 169
Figure 4.13 Receiver Operating Curve for Hip without BMD ... 170
Figure 4.14 Density Plot of FRAX® MOF without BMD ... 171
Figure 4.15 Kernel Density plot of best 3 linear MOF without BMD models ... 175
Figure 4.16 Best MOF without BMD model scatterplot ... 176
Figure 4.17 Receiver Operating Curve for MOF without BMD ... 178
Figure 5.1 Aim 2 Random Population Selection Flowchart ... 185
Figure 5.2 ROC Comparison for Hip with BMD in Linked Population ... 192
Figure 5.3 ROC Comparison for Hip with BMD in Linked and Random Populations ... 194
Figure 5.4 ROC Comparison for MOF with BMD in Linked Population ... 197
Figure 5.5 ROC Comparison for MOF with BMD in Linked and Random Populations ... 198
Figure 5.6 ROC Comparison for Hip without BMD in Linked Population ... 201
Figure 5.7 ROC Comparison for Hip without BMD in Linked and Random Populations ... 202
Figure 5.8 ROC Comparison for MOF without BMD in Linked Population ... 205
Figure 5.9 ROC Comparison for MOF without BMD in Linked and Random Populations ... 206
Figure 5.10 Sensitivity Analysis with BMD ... 209
xx
Figure 5.11 Sensitivity Analysis without BMD ... 212
Figure 6.1 Approach 1 (All New Users) Study Population Flowchart ... 218
Figure 6.2 Kernel Density Plot for Propensity Scores in Approach 1 (All New Users)... 224
Figure 6.3 Approach 2 Study Population Flowchart ... 234
Figure 6.4 Density Plot of the Unrestricted-populations Propensity Scores Approach 2 (Diabetes, Hypertension, and Statin Users) ... 240
Figure 6.5 Approach 3 (DXA visit as non-user) Study Population Flowchart ... 248
Figure 6.6 Kernel Density Plot for Propensity Scores in Approach 3 (DXA visit as non-user) ... 254
xxi
LIST OF ABBREVIATIONS
1se One Standard Error
95% CI 95% Confidence Interval
ACR American College of Rheumatology
ALN Alendronate
AOM Anti-osteoporosis medication
aR2 Adjusted R2
ASBMR American Society for Bone and Mineral Research AUC Area Under the Curve
BMD Bone mineral density
BMI Body Mass Index
BP Bisphosphonates
CCF Cleveland Clinic Foundation CFRI Calculated Fracture Risk Index
CMS Centers for Medicare & Medicaid Services COPD Chronic Obstructive Pulmonary Disease CPT Common Procedure Terminology
df Degrees of Freedom
DM Diabetes mellitus (Type 1 & 2) DXA Dual Energy X-Ray Absorptiometry EMR Electronic Medical Record
Enet Elastic Net
xxii EVOS European Vertebral Osteoporosis Study FDA Food and Drug Administration
FFS Fee For Service
FIT Fracture Intervention Trial FNT Femoral Neck T-Score
FRAX® World Health Organization FRAX® 10-Year Fracture Risk Model HCPCS Healthcare Common Procedure Coding System
HD High-Dimensional
HL Hosmer-Lemeshow Test
HR Hazard Ratio
HRT Hormone Replacement Therapy
ICD-9 International Classification of Diseases, Ninth Revision IOF International Osteoporosis Foundation
IQR Inter-quartile Range
ISCD International Society for Clinical Densitometry
JCAHO Joint Commission on Accreditation of Healthcare Organization LASSO Least Absolute Shrinkage and Selection Operator
MAE Mean Absolute Error
min Minimum
MOF Major Osteoporotic Fracture MPAB Medicare Part A & B
MPABD Medicare Part A, B, & D
xxiii MPR Medication Possession Ratio MrOS Osteoporotic Fractures in Men
MSE Mean Squared Error
NIS National Inpatient Sample
NOF National Osteoporosis Foundation NQF National Quality Forum
OLS Ordinary Least Squares ONJ Osteonecrosis of the Jaw
PCB Placebo
PMW Post-menopausal Women
PS Propensity Score
PTH Parathyroid Hormone
QM Quality Measure
RCT Randomized Clinical Trial RMSE Root Mean Square Error ROC Receiver Operating Curve
RR Relative Risk
SD Standard Deviation
SIPTW Standardized Inverse Probability of Treatment Weights SMRW Standardized Mortality Rate Weights
SOF Study of Osteoporotic Fracture THIN The Health Improvement Network
xxiv UAB University of Alabama at Birmingham UNC University of North Carolina
US United States
WHI Women’s Health Initiative WHO World Health Organization
ZA Zoledronic Acid
1
INTRODUCTION
1.1 Overview
Osteoporotic fractures are the clinical manifestation of osteoporosis and hip fractures and increase mortality, morbidity, future fracture risk, and health care costs while decreasing quality of life (1-4). The direct healthcare cost of osteoporotic fractures was estimated at $18.7 billion US dollars in 2010 and expected to rise to $25.3 billion by 2025 (5-7). Osteoporotic fracture risk increases with age and Medicare beneficiaries account for 80% of fracture-related costs (8).
Osteoporosis is defined as a bone mineral density (BMD) t-score of ≤-2.5 standard deviations below the mean value for young healthy Caucasian women, measured using dual energy x-ray absorptiometry (DXA). However BMD alone does not predict all fracture; in fact, the majority of fractures occur in persons without osteoporosis (9-12). In 2010, 10.3 million US men and women
≥50 years of age were estimated to have osteoporosis, with a total of 43.1 million persons having low bone mass (5, 13, 14).
Decisions for treatment and prevention of osteoporosis and osteoporotic fracture utilize the osteoporotic BMD, prior fracture, and may use fracture risk tools to estimate future risk.
FRAX® from the World Health Organization is a risk tool recommended by US guidelines, and is the most commonly used fracture risk tool (15). FRAX® estimates a patient’s 10-year fracture risk and, if guidelines are used to make treatment decisions, is likely related to the therapy decision and may serve as a marker of future fracture risk. Research which fails to account for
2
fracture risk and its relation to treatment decisions may produce results that are counterintuitive and overestimate the effectiveness of specific anti-osteoporosis therapies (16, 17). In clinical practice FRAX® is a diagnostic risk tool and a potential confounder in research of comparative effectiveness or patterns of anti-osteoporosis medication use.
Although the variables used to calculate FRAX® should be available from a clinical interaction or from a medical records review, research using secondary data may not contain the variables necessary to calculate FRAX® or a recorded FRAX® score is generally not possible (18). For example, payers may be interested in evaluating the quality of care delivered to
individuals they insure and basing reimbursement payments on that quality (19). Payers readily have access to administrative claims, which contain the reimbursed services a patient has received, but rarely contain any clinical variables. We are aware of only one claims-based algorithm for predicting fracture risk, however this score results in its own estimate of fracture risk, rather than producing an estimate of FRAX®, which is the fracture risk score clinicians use to make treatment decisions (20). Although useful in a research context, this administrative claims-based algorithm cannot be used directly for information at the clinical decision point, or as a measurement of guideline concordant care.
Rationale for the Calculated Fracture Risk Index (CFRI)
We propose to create a calculated fracture risk index (CFRI) to predict FRAX® using only administrative claims variables to provide payers and researchers with a proxy of the fracture risk score a clinician would have used to make a treatment decision. Although CFRI may not be the optimal tool to fully reduce epidemiologic confounding, whether it could be used as a proxy for FRAX for evaluations of care quality or to improve confounding control as a
3
disease risk in comparative effectiveness studies is unknown (21). Additionally, CFRI could be computed using existing data and made available to providers.
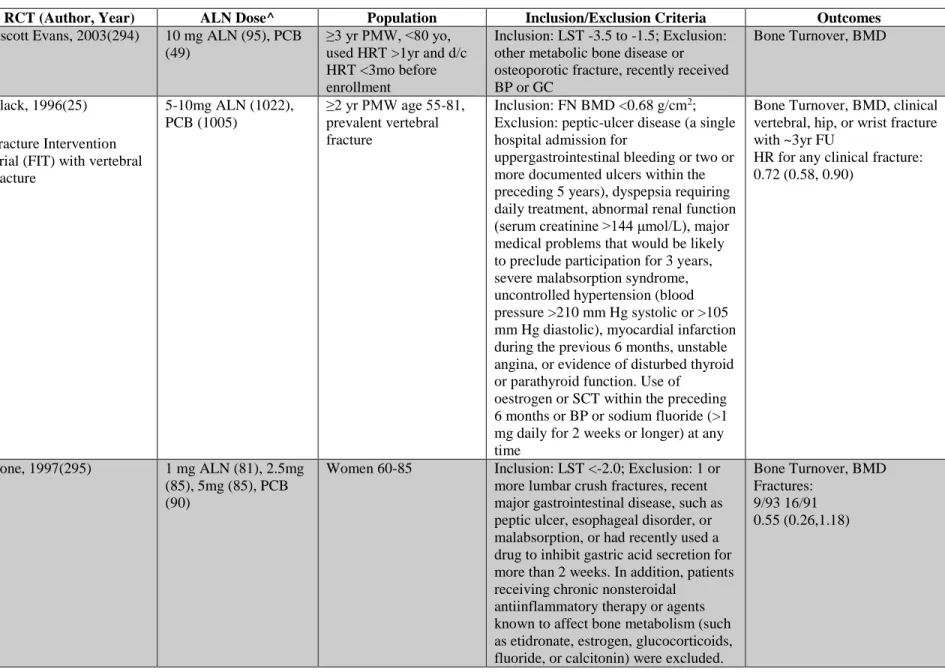
In non-experimental studies of treatment, it is challenging to validly contrast medication initiators to non-users due to baseline differences between the two groups, specifically due to confounding by indication (22-24). Approaches to making comparisons between these groups have included comparison groups of non-users (i.e., not using the medication of interest) or of groups using a different class of medication from the class of interest Although non-users comparisons are generally not done, for our study we desire to compare effect estimates using CFRI to those which compared alendronate users to placebo users from the Fracture Intervention Trial (FIT) (25-27). The FIT trial represents the best estimate of the effectiveness of alendronate to non-users, because the placebo users are assumed to have similar medical histories and medication use as the alendronate users and change in fracture risk is attributed to the use of alendronate based on the theory of randomization. We will investigate ways that CFRI can balance baseline characteristics between alendronate users and a population of non-users by reducing confounding by indication in comparison to the FIT results.
The most promising technique where CFRI may be used is restriction, which can
minimize confounding by creating more homogenous sub-populations (23). Which may be more likely to require treatment and medical care. This restricted population should be at a similar risk for fracture, with CFRI performing similarly across the entire population. FRAX® and by proxy CFRI are designed as tools to assist in making treatment decisions, therefore restricting the population to users and non-users with similar fracture risk based on the FIT trial will help to clarify the utility of these diagnostic risk tools to reduce confounding by indication for users versus non-users. Additionally, after restriction we will evaluate different
4
pharmacoepidemiologic methods for estimating osteoporosis treatment effects, including inverse probability of treatment weighting compared to unadjusted and multivariable-adjusted estimates.
This analysis will evaluate the potential use of CFRI by payers to evaluate the utility of the current AOM treatment quality measures based on treatment guidelines.
1.2 Specific Aims
To address the influence of FRAX® on the treatment decision and subsequent fracture outcomes we will determine if it is possible to identify surrogates for FRAX® in administrative claims data. We are interested in the information a clinician had at the face-to-face interaction where a decision on initiation of treatment was made, which is most applicable to evaluation of the quality of care. This information (CFRI) will use claims-based encounters to approximate the risk score at the face-to-face interaction for female patients. The analysis is restricted to female patients only due to long-term risks of fracture differing between men and women as well as possible differences in the ability for FRAX® to identify long-term fractures by sex. The long- term goal of this work is to develop a proxy score for FRAX® which could be used to identify the quality of prescribing for individuals at risk for fracture and to reduce confounding in comparative effectiveness studies of AOMs. The objectives of this study are to develop and validate a claims-based algorithm for identifying FRAX® and to identify the best strategy for incorporating this measure into comparative effectiveness studies for optimal confounding control. To accomplish these goals, three specific aims have been crafted:
Aim 1: Develop and internally validate a claims-based fracture risk index (CFRI) to estimate FRAX® risk scores at clinical interaction (office visit) using clinical registry data linked to Medicare claims data.
5
Hypothesis 1: In the final model, there will be no significant difference in predicted (CFRI) to observed (FRAX®) scores based on aR2.
This aim will utilize clinical DXA registry data from the Cleveland Clinic Foundation that has been linked to Medicare Fee for Service (FFS) administrative claims. FRAX® scores are recorded during a DXA examination and include 10-year risks of major osteoporotic and hip fracture with and without BMD.
We will create CFRI by estimating FRAX® utilizing both content knowledge of variables associated with osteoporosis and fracture based on the 2004 US Surgeon General’s report as well as identification of non-content variables associated with FRAX® using a high- dimensional variable selection method during the 365-days prior to DXA in only females (5, 17, 28). We will use an elastic net model to predict the independent variable (known FRAX®) using the factors associated with osteoporosis/ FRAX® as dependent variables (29-31). Validity of the estimates will be evaluated using calibration plots, R2, and mean-squared prediction error. This process will be repeated for all 4 types of FRAX® score; major osteoporotic fracture with and without BMD and hip fracture with and without BMD, with the internally validated model coefficients comprising the 4 CFRI algorithms.
Aim 2: Externally validate CFRI in a 20% random sample of Medicare beneficiaries by comparing the performance of CFRI and FRAX® to predict future fractures.
Hypothesis 2: There will be no significant difference between FRAX® and CFRI to predict future fractures as a continuous variable (calibration) between the linked and random sample.
Hypothesis 3: CFRI will identify fractures at a similar rate based on c-statistics in the random sample as FRAX® in the linked sample (discrimination).
6
This aim will utilize only females from the linked sample as well as a 20% random sample of Medicare fee-for-service beneficiaries. We will externally validate the CFRI algorithm using major osteoporotic fracture or hip fracture endpoints at 1-year, using hip fracture for hip risk scores, and major osteoporotic fracture for those scores. In the random sample a single randomly selected office visit with at least 365-days continuous enrollment prior to the visit will be used to calculate CFRI.
The data will be split into three groups, 1) linked sample FRAX®, 2) linked sample CFRI, 3) random sample CFRI. Calibration will be assessed using the Brier score and goodness- of-fit testing by use of the Hosmer-Lemeshow test. Discrimination will be measured using receiver operating curves (ROC) and area under the curve for the 3 populations. We will also examine the equivalency of calibration and discrimination between the populations (32).
Aim 3: Evaluate the utility of CFRI and restriction in a comparative effectiveness research study of alendronate users to non-users.
Hypothesis 4: Comparative effectiveness estimates will most closely approximate
Fracture Intervention Trial results after restricting by trial inclusion criteria and incorporating CFRI, then estimates generated without CFRI.
Using the 20% sample of Medicare beneficiaries, we will compare estimates of fracture risk reduction in this sample for patients newly prescribed alendronate (users) versus patients with a new prescriptions for any drug other than medications prescribed to reduce fractures, including alendronate (non-users) to estimates generated from the randomized controlled Fracture Intervention Trial (FIT) which compared alendronate 10mg daily to placebo with up to 4 years follow-up (25-27). Three other approaches to define non-users, users of specific
7
medication classes, and anchoring on the receipt of a DXA. As a first step, we will restrict the candidate population to only those with CFRI values similar to patients in the FIT trial.
The goal of this aim is to present a likely way that payers would use CFRI to evaluate quality measures and reduce confounding in comparative effectiveness studies of AOMs. We will compare the effect estimates from our CFRI restricted population to those of the FIT trial to illustrate a user versus non-user application which may be applicable to payer quality
measurement. To illustrate this we will present unadjusted, and multivariable adjusted estimates for the study population. The study population will be restricted to high-risk patients similar to FIT patients, and finally by all FIT inclusion/exclusion criteria with estimates created at each restriction. Lastly, we will fit a propensity score to model the receipt of alendronate using the content knowledge variables from Aim 1 (28, 33). This propensity score will be converted into a stabilized inverse probability of treatment weights, and weighted effect estimates will be
produced. All analysis will utilize cox proportional hazards model and compare female new users of alendronate to new users of a non-AOM, with only the requirement of 365-days continuous enrollment in Medicare Parts A, B, and D prior to an office visit to calculate CFRI (22).
1.3 Importance of Proposed Research Plan
Benefits of Claims-based Algorithms for Defining Fracture Risk
The use of claims data to calculate FRAX® is important to payers and researchers for a number of reasons. FRAX® is the most widely recognized fracture risk score in current clinical practice and is a component of several US osteoporosis management guidelines. There are no methods to estimate FRAX® in administrative claims data wherein payers typically evaluate quality measures. Manual abstraction of FRAX® from medical records by payers would be
8
costly and time consuming as FRAX® scores and bone mineral density measurements are generally only available in unstructured data. The claims-based fracture risk index (CFRI) on the other hand is based solely in administrative claims and will allow payers to tie medical care to quality measures using data which they already collect. Additionally, CFRI can be used by payers to identify high-risk patients using readily available data without additional costs.
For researchers, collection of FRAX® from unstructured clinical data including the identification and collection of all patient-level FRAX® risk factors would be unfeasible on a population level. Calculating FRAX® using CFRI in administrative claims would provide the opportunity to account for FRAX® and treatment decisions related to FRAX® using available data. A clinician’s decision based on National Osteoporosis Foundation (NOF) guidelines to initiate an anti-osteoporosis medication accounts for FRAX® risk, however without CFRI it cannot be measured or controlled for by researchers using administrative claims. Because FRAX® is a significant part of the US clinical osteoporosis guidelines with treatment decisions based on FRAX® risk, calculating FRAX® in administrative claims data available to payers and researchers will provide previously unavailable opportunities for the evaluation of care quality and effectiveness of therapies.
Payment Implications of Claims-based Fracture Risk Guidelines
Centers for Medicare and Medicaid Services (CMS) and commercial payers have increasingly moved towards reimbursement for medical care based on care quality. Quality measures generally are based on national guidelines and expert opinion. However, in
osteoporosis, quality is assessed through diagnoses of osteoporosis, fracture, or AOM use. The rationale behind basing osteoporosis quality measures on these factors is related to the ability to capture these values in administrative claims (where most payers will evaluate care quality). As a
9
result, osteoporosis quality measures have only focused on specific groups at risk for fracture (AOM users, fracture patients, and patients with osteoporosis), rather than the general population as intended by the NOF guidelines. Payers reimbursing medical expenses, including CMS now linking reimbursement for hospital stays to quality may prompt both commercial payers and CMS to use quality measures based on NOF guidelines to increase clinician prescribing based on the guidelines, reduce preventable osteoporotic fractures, and not reduce their amount
reimbursed for care administered (34).
CFRI may also be used to identify patients at high-risk for fractures and allow for intervention prior to a fracture, rather than after the patient has already had a fracture, been diagnosed with osteoporosis, or is prescribed an anti-osteoporosis medication. Up to thirty percent of patients with osteoporosis do not have a corresponding diagnostic code, and the majority of fractures occur in those without osteoporosis (35). Targeting patients based on fracture risk rather than prevalent fractures will allow payers to target primary prevention interventions rather than treatment of osteoporotic fractures, potentially reducing future costs.
Comparative Effectiveness Implications of Research
CFRI will be important in comparative effectiveness research (CER) as it may be used to create and evaluate “empirical equipoise” in osteoporosis research. Equipoise occurs in clinical practice when treatment options are considered interchangeable (no clear winner); for example, when a clinician chooses a therapy based on preference rather than on the merits of the specific therapy (21). For empirical equipoise to be valid, researchers need to be confident that a clinician views two patients at equal risk for fracture and make treatment decision based on preference.
In osteoporosis, fracture risk may be argued as the best proxy for empirical equipoise.
Based on NOF guidelines, if two patients have equal fracture risks, it is a clinician’s choice as to
10
which medication to start rather than the guidelines. Ergo the clinician’s preference should drive the choice of therapy for patients with similar fracture risks. In this way, propensity scores can be used to restrict or balance CFRI between the treated and the untreated and should serve as a proxy to control confounding by patient characteristics and create empirical equipoise. The results of these analyses should provide a basis to explain the difference in treatment decisions and effectiveness for the treatment of osteoporosis and osteoporotic fracture. Specifically, CFRI based restriction will be important for payers to determine optimal treatment groups, policy makers to evaluate the appropriateness of osteoporosis guidelines, and researchers to evaluate empirical equipoise in osteoporosis research.
CFRI would be an essential tool for payers and those interested in the quality of care as well as a proxy for empirical equipoise. Although FRAX® itself is an imperfect estimate of a patient’s future fracture risk, it is the most commonly used fracture risk tool in the US, has physician buy-in, and is currently used in national guidelines. Therefore, understanding patients’
fracture risks retrospectively during clinical encounters will allow payers, policymakers, and researchers to assess appropriate care and identify ways to improve patient outcomes.
11
BACKGROUND
2.1 Introduction
To help guide the reader through this project, an explanation of how each aim fits into the standard of care is warranted. Although standard of care is primarily a legal term, most
authorities agree that a particular specialties standard of care is based on guidelines or consensus statements (36). In the US, the most common osteoporosis guidelines are those of the National Osteoporosis Foundation, and their Clinician’s Guide. The 2014 Clinician’s Guide describes the continuum of care as assessing fracture risk, diagnosing osteoporosis, administering treatment when appropriate, and measuring the effectiveness of treatment (Figure 2.1) (37).
Figure 2.1 Osteoporosis Standard of Care
Revised from the Cosman et al, 2014 (37)
In brief FRAX®, DXA, and general health characteristics are first assessed by the clinician to assist in making a diagnosis. Once the patient has been assessed for osteoporosis by DXA bone density criteria, the clinician can then utilize the information gathered to determine if the patient meets the requirements for an osteoporosis diagnosis, or warrants treatment outside of
Assess Fracture Risk
(FRAX®)
Determine if fracture risk
warrants treatment (Diagnosis)
Administer Treatment
Evaluate effectiveness of treatment
12
the osteoporosis diagnosis. For those patients who warrant treatment the next step is for treatment to be administered, and after a period of time for the effectiveness of therapy to be reevaluated. If a decision to treat is not made then the patients should be reassessed in the future to determine if a diagnosis or treatment are warranted.
The aims for this project are based on this standard of care model and follow along the continuum of care. We present where each of the Aims fall along the model in Figure 2.2. For this project, we are estimating FRAX® utilizing administrative claims data to create CFRI and evaluating its internal validity in Aim 1 which represents assessing fracture risk. Then in Aim 2 we are externally validating CFRI in a random population of Medicare beneficiaries and
evaluating its ability to predict 1-year fracture rate, which requires both assessing fracture risk, and determining if the given fracture risk warrants treatment. Finally, in Aim 3 we are assessing the utility of CFRI to reduce confounding in the comparison of alendronate users to non-users, which spans both the administration of treatment and the evaluation of treatment effectiveness.
13 Figure 2.2 Aims role in Standard of Care
To understand why fracture risk and fractures in general are important, we felt it was first important to understand what type of fractures we were discussing. Therefore, we begin our background by discussing how fractures have been deemed to be osteoporotic, the relationship to osteoporosis, and the epidemiology of these fracture sites. Knowing the sites wherein
osteoporotic fractures occur helps us to explore the costs, both economic and societal including morbidity and mortality of osteoporotic fracture, primarily in the US. Although these are the costs of fracture, there are ways to identify patients at risk prior to the fracture occurring, to this end we discuss the current fracture risk assessment tools, particularly focusing on FRAX®. To provide a context for building the claims-based fracture risk index (CFRI) we describe the data that FRAX® was built upon, including the patient characteristics and proprietary algorithm.
With the discussion of FRAX® we also investigate its applicability to the US, including its use in the National Osteoporosis Foundation (NOF) guidelines and other risk tools that are currently being used in the US. Because AOM have been found to reduce fracture risk, and
14
recommendations are made for their use by the NOF guidelines we then describe the currently available Food and Drug Administration (FDA) approved therapies. We finish our background by discussing Andersen’s model for Healthcare Utilization which provides a context for characteristics used to predict the use of AOMs in Aim 3.
2.2 Osteoporotic Fracture
To better understand how osteoporotic fracture effects the population it is imperative to first understand what an osteoporotic fracture is. In this section, we discuss the different definitions of osteoporotic fracture including the definition currently favored by the FRAX®
algorithm. The relationship between osteoporosis, bone mineral density, and fracture. The epidemiology of the fracture sites thought to be osteoporotic, and finally how these fracture sites have been identified in administrative claims-based analyses.
2.2.1 Definition
Although fracture is the clinical manifestation of osteoporosis, there is no universally agreed upon definition of osteoporotic fracture. The actual cause of a fracture is multi-factorial including heredity, fall mechanics, and bone density among other characteristics (Figure 2.3) (37-39). One common way to define osteoporotic or fragility fractures are those which occur in the presence of low bone mass with either no or a low-energy impact (40, 41). Low-energy impact fractures also commonly referred to as “fragility fractures” and are fractures which likely would have not occurred in healthy persons, particularly those that result from falls at a standing height or less (41, 42). When a person falls from a standing height the force exerted on the femur has been estimated to be at least 10 times the impact needed to fracture the femur (43). Only 10% of all falls result in serious injury and 5% in fracture (44). Cohort studies have found low bone mineral density, fall history, concomitant diagnoses, and how the patient falls are
15
associated with if a fall will cause a fracture (44-47). Studies of the addition of a hip protector for patients who have a fall history has not consistently shown fracture reduction, suggesting that only reducing the force on the femur at a fall is not sufficient to prevent fracture (48, 49).
Fragility fractures were found to be responsible for the majority of hip and humeral fractures as well as 75% of vertebral fractures in a Swedish cohort (50). Though data from the Study of Osteoporotic Fracture (SOF) has suggested that only classifying fractures based on the amount of trauma needed to cause the fracture will lead to an under estimation of osteoporotic fractures (51).
Figure 2.3 Pathogenesis of osteoporosis-related fractures
From Cosman et al (37), adapted from Cooper and Melton (39), from Riggs (38)
SOF analyses also have demonstrated that all fractures, excluding those of the face, but including fractures caused by trauma are associated with low bone density measured at either the radius, hip or spine (51-53). For example, a one standard deviation decrease in BMD was
associated with between 1.39 and 2.01 increase in the risk for hip fracture based on duration of follow-up and measurement site (51, 52). This increased risk also transfers to high-impact
16
fractures with patients having low bone mass at a greater risk of fracture after high-energy impact compared to those with normal bone mass (54, 55).
With the difficulties of quantifying the amount of trauma needed to cause the fracture, another definition based on fractures which are associated with low bone mass and increase after age 50 has been proposed (56, 57). Using this definition vertebral, rib, pelvic, humeral, forearm, hip, tibia and fibula in women, as well as fractures of the clavicle, scapula, and sternum are considered osteoporotic fractures (51, 53, 56, 58). In this definition, the only fracture sites which were not considered to be osteoporotic were skull and face, tibia and fibula in men, feet and toes, ankle, and patella fractures, though ankle fractures specifically have been found to be associated with low peak bone mass. One criticism of this definition is that it underestimates the burden of osteoporotic fracture for person under the age of 50 as the definition itself requires that fractures are at an increased rate after this period (40). Still another definition has been based on sites where reduced bone density has been associated with the fracture and consider fractures of the vertebrae (spine), proximal femur (hip), and distal forearm (wrist) as quintessential osteoporotic fractures (59).
Attempting to quantify osteoporotic fractures by bone mass or amount of trauma has not led to a concrete definition. However, to estimate the economic impact and societal burden of osteoporosis and osteoporotic fracture a common definition was sought. The first published report used discharges from the 1985 National Hospital Discharge Survey, National Nursing Home Survey, and National Ambulatory Medical Care Survey to determine what proportion of healthcare utilization with osteoporosis listed as a diagnosis were directly attributable to low bone mass (60). This report was the first to directly tie dollar amounts to osteoporosis and osteoporotic fracture using attribution rates for the contribution of osteoporosis to each medical
17
cost. Pathologic and non-pathologic fracture of vertebrae, pelvis, femoral neck, and humerus were the fracture sites most attributable to osteoporosis (70% attribution for patients aged ≥60) (60).
In 1995, the National Osteoporosis Foundation (NOF) convened an expert panel to assess the cost effectiveness of osteoporosis interventions. The expert panel viewed hip, spine, and forearm fractures as more than 50% attributable to osteoporosis, although the attribution did differ somewhat based on age and gender (42). The most attributable fractures were hip fractures (0.95 attribution probability) for all women aged 85 years or older. This panel for the first time addressed the differences in attribution of osteoporosis for men and non-white women. However, the only sites which were assessed were broadly defined as hip, spine, forearm, and other
fractures which lack specificity for site specific probabilities and cost. The panel gave attribution weights which were designed to be utilized in cost analyses as the proportion of fracture costs which could be directly linked to osteoporosis and fracture in 1995 and are based solely on expert opinion.
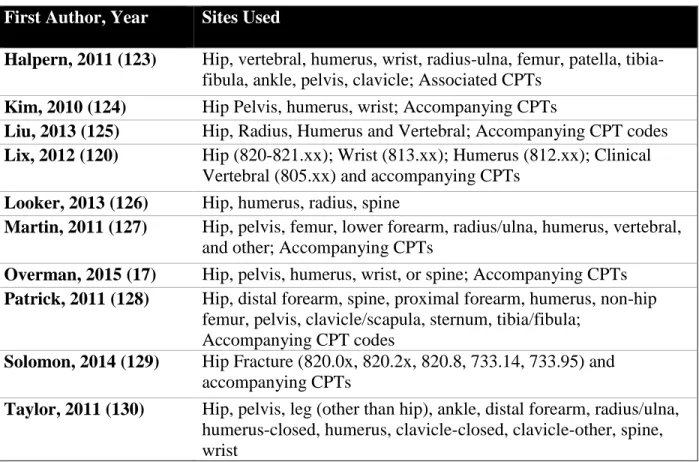
With increasing use of administrative claims to evaluate osteoporosis, a 2011 meta- analysis and expert panel review provide likelihood estimates for fracture sites to be associated with osteoporosis. This working group for the first-time integrated ICD-9 codes for fractures into osteoporosis attribution to better estimate the burden and costs of osteoporosis and osteoporotic fracture. Femoral neck, pathologic vertebral fractures, lumbar, thoracic, closed distal forearm and radius/ulna (NOS), and pelvis were sites which had a median of rating of 9 (most likely because of osteoporosis) from the expert panel (61). Conversely open fractures of the proximal humerus and closed fractures of the skull and facial bones were viewed as least likely to be associated with osteoporosis (61).
18
In osteoporosis RCTs the difference in bone mineral density at the femoral neck or lumbar spine commonly are used as surrogate end points for treatment efficacy rather than differences in fracture rate. This is due to a very large population being needed to demonstrate a significant reduction in fracture rate between the treatment groups. Also, it has been suggested that it may be unethical to treat patients with established osteoporosis with placebo rather than active drug because we know that active drug can reduce fractures (62). In randomized clinical trials, all non-traumatic fractures other than those of the skull, fingers, and toes generally are used in endpoint definitions. In recent trials of osteoporotic medications, fractures at the femoral neck and vertebral spine commonly are specified as endpoints with other fractures combined into an omnibus category (63, 64). Trials of osteoporosis medications generally have separately analyzed hip and vertebral fractures with all fractures other than those of the skull, fingers, and toes also being assessed for treatment efficacy.
For epidemiologic studies the most commonly studied fracture definition is that of clinical spine, forearm, hip or shoulder which is defined by the WHO FRAX® tool as major osteoporotic fractures. This definition and specific sites are further discussed in section 2.5. In this proposal, we will utilize two osteoporotic fracture definitions. For aims 1 and 2 we will only use fracture sites included in FRAX® major osteoporotic fracture (spine, forearm, hip, or
proximal humerus [shoulder]) with codes presented in Table 3.3 (65). While for aim 3 we will utilize a broader definition including all sites included in the MOF definition as well as pelvis tibia/fibula, clavicle, thoracic, and lumbar spine, because these were the sites from the Fracture Intervention Trial which corresponded to clinical fracture.
Osteoporotic fracture is the clinical manifestation of osteoporosis (low bone mass) or bone fragility. The first attempts to classify osteoporosis based on fracture risk found that the
19
90th percentile of 90% of all hip and vertebral fractures were approximately 2 standard deviations (SD) below the normal bone density distribution for both young men and women (66). This -2 SD threshold was found to hold for measurements at the hip, proximal femur, and distal radius in both men and women (66). When reporting on this topic Riggs et al were the first to provide support to the idea that if a patient decreased past a specific bone mineral density threshold then they were more likely to sustain a fracture.
In 1994 a specific threshold, that of -2.5 SD below the average value for a young healthy woman was proposed by the WHO for epidemiologic identification of osteoporosis using bone mineral density calculated by dual energy x-ray absorptiometry (DXA) (9, 67, 68). The reference value for defining osteoporosis among “young healthy women” were further clarified to the National Health and Nutrition Examination Survey (NHANES) III BMD values for 20-29-year- old Caucasian women (69, 70). Specifically, a femoral neck t-score is calculated as
(BMD – 0.858 [reference mean])
0.120 [reference SD] with all other bone mineral density sites based on the same
population. The 1994 WHO definition also gives definitions for osteopenia (T-score -1.01 to - 2.49), normal (T-score >-1.0), and severe osteoporosis (T-score ≤-2.5 and prevalent hip or
vertebral fracture) (Table 2.1) (9). The WHO definition was clarified in 2008 to encourage use of the NHANES III reference values and measurement of BMD at the femoral neck for the
diagnosis of osteoporosis (70).
20 Table 2.1: Osteoporosis Classifications
Bone Density T-Score Diagnostic Category
Greater than or equal to -1.0 Normal
Less than -1.0 and greater than -2.50 Osteopenia
Less than or equal to -2.50 Osteoporosis
Less than or equal to -2.50 with one or more fragility fractures
Severe Osteoporosis From WHO Technical Report, 1994 (9)
A position statement was presented in 2012 that argued that some of the under treatment and diagnosis of osteoporosis in the US may be due to a very limited definition of osteoporosis, which may need to be revised (71). To address insufficiencies of the current osteoporosis definition the Bone Health Alliance Working Group formalized a new definition in a 2014 position statement (72). The working group argues that patients who have experienced a low- trauma hip fracture and for those who have osteopenia by BMD who sustain a low-trauma vertebral, proximal humerus, pelvis, or, in some cases, distal forearm fracture, sites which are known to confer an increased future fracture risk, patients with a t-score ≤-2.5, as well as patients at an increased fracture risk based on fracture prediction tools should all be classified as having osteoporosis (72). This definition would include more persons in the US who previously had not been classified as osteoporotic and was intended to identify all persons at an increased fracture risk. At the present time, the new definition including fracture risk has not been formally accepted by payers as adequate for treatment reimbursement. If this new definition were to be adopted a formal process for assessing fracture risk based on data available to payers would need to be created and automated.
At the present time, BMD is important but not required in calculating fracture risk. Since 2006 the percentage of patients receiving DXA scans in the United States has diminished
possibly due to a reduction in reimbursement in the outpatient setting (73-79) or a reduction in
21
serial scanning for patients where repeat scans are not warranted (76). However, King et al have suggested regardless of why fewer scans are being performed their decrease will lead to more osteoporotic fractures which will increase the cost of osteoporosis for the United States (74).
Adding to the confusion is lack of consensus on when to start screening for osteoporosis, how often to screen, and whom to screen (80).
2.2.2 Epidemiology of Fracture 2.2.2.1 Hip Fracture
Hip fractures are fractures at the proximal femur either through the femoral cervix or through the trochanteric region (40). These fractures although only accounting for 20% of all osteoporotic fracture are the most readily captured and studied type of osteoporotic fracture as they typically require medical intervention (40, 81). It has been estimated that only 1% of all femoral fractures do not require medical intervention, possibly due to patients already lacking mobility and the risk of surgery outweighing the possible benefits of surgical fixation (82).
Depending on location and severity of the fracture differing surgical interventions can be undertaken.
Incident hip fractures are associated with an increased risk of death within 1-year, with between an 8.4% and 36% of the risk of death attributed to hip fractures (83). Additionally,
~20% of patients require care at a long-term facility and only 40% regain the level of
independence they had prior to the fracture. As such, hip fractures are responsible for much of the excess morbidity and healthcare cost associated with osteoporotic fracture. This has led to their use as a surrogate for the overall cost of osteoporosis and related care.
In the Rochester cohort increased between 1928 and 1982 before a decrease between 1983 and 1992, and a further decrease from 1992 to 2004 (84-86). Additionally, proximal femur
22
fractures decreased between 1989-1991 and 2009-2011 (87, 88). Results from the Framingham cohort suggest that when a person was born has as much to do with fracture rate as their age with more recent births having an increased fracture risk (89). Showing that hip fracture rates may differ based on US region. With only regional cohorts to base US hip fracture rates on, the National Hospital Discharge Survey for the years between 1970 and 1983 was used to make a nationally representative estimate. Between 1970 and 1983 hip fractures increased by 9.3% (90).
A subsequent analysis of the National Hospital Discharge Survey (1965-1993) indicated a linear increase in hip fractures for men regardless of age group with a less sharp increase for women during the study period (91). This suggests that regional estimates alone may be insufficient to estimate hip fracture rates for the US.
The first estimate of hip fractures utilizing administrative data in the US utilized a 20%
Medicare sample between 1985 and 2005 to estimate hip fracture in the United States. Using age adjusted rates hip fractures increased 9.0% in women between 1986 and 1995 before decreasing by 24.5% by 2005 (92). Men saw an increase of 16.4% between 1986 and 1995 before a decline of 19.2% by 2005 (92). These findings were echoed by an analysis of 1998 to 2007 rates of intracapsular hip fracture in a 5% sample of the Medicare population (93). In a non-Medicare commercially insured female population between 2000 and 2005 hip fractures increased (94).
Which may suggest a continued increase in hip fracture for persons less than Medicare age (<65) with a decrease in hip fractures for older adults.
US and non-US hip fracture incidence rates were compared using the Rochester cohort between 1928 and 1982 and all other available estimates finding men to have similar fracture trajectories (84). While in women the US rates appear to stabilize in the 1950s, European and Oceanic estimates continued to rise (84). This was updated in 2011 finding that hip fractures
23
increased until the 1980s where they began to decline in the US, Canada, and Norway (95). In most other estimates hip fractures increased until the 1990s wherein they too began to stabilize or decline other than those from Japan. The study suggests that the secular trends are due to one of three rationales, 1) a change in the frequency of risk factors for fracture which act relatively late in the life course; 2) a change in the frequency of risk factors influencing bone strength and propensity to trauma in early life which feed through as altered fracture rates in successive birth cohorts; and 3) alterations in the demographic structure of the populations studied within age and sex strata (95).
2.2.2.2 Vertebral Fracture
Changes in the size and shape of the L1-L4 lumbar are typically considered vertebral deformities or fractures. It has been reported that less than 1/3 of all vertebral deformities noticed by radiologists necessitated medical attention with less than 1/10 necessitating hospital
admission (96). Many patients complain of lower back pain or kyphosis (curvature of the spine) which prompts the discovery of vertebral fractures. Once a vertebral deformity is found it has been estimated that women have a four times higher risk of having an additional vertebral deformity without intervention (97, 98). Additionally, vertebral fractures were found to be associated with a 1.5 to 11.1 incidence rate increase in the Rochester cohort depending on site of future fracture (98). Though a study from European Vertebral Osteoporosis Study (EVOS) indicated that vertebral fractures were associated with an increase in hip but not forearm fractures (99). Vertebral deformities are typically augmented through balloon kyphoplasty or vertebroplasty which provide stability for the spine after the fracture. A recent randomized controlled trial has indicated that patients receiving either of these two treatments have similar long-term outcomes (100).
24
There are multiple definitions for vertebral fracture which make comparison across epidemiologic studies difficult. Some favor the idea of “you know one when you see one”, based on x-ray which is commonly referred to as expert opinion, however there have been recent attempts to create a more objective definition, these fractures are generally referred to as
“clinical vertebral fractures” (101, 102). Clinical vertebral fractures generally are also based on if the patient sought medical attention care for their fracture. Morphometric vertebral fractures are diagnosed by vertebral measurements at the anterior, middle, or posterior heights of each
vertebral column exceeded a pre-specified measurement (57, 101, 103). However, this technique has been found to underestimate the number of symptomatic and overall vertebral fractures (104). A second technique is based on a semi quantitative method proposed by Genant which summarizes the changes in shape as graded reductions in overall height and area (105). A further revision to a quantitative assessment has also been proposed (106). However, because all of the definitions differ at least slightly, they commonly disagree on the incidence and prevalence of vertebral fracture in the population (101, 107, 108).
In an EVOS study Leidig-Bruckner et al found that depending on age, sex, and definition of vertebral deformity prevalence ranged from 2% to 17% (estimated from figure) in men to 3%
to 27% (estimated from figure) in women (109). The incidence of vertebral fracture has also been shown to increase after age 50. Based on data from the cohort in Rochester, Minnesota the incidence of vertebral fracture has increased from 659 per 100,000 persons to 968 per 100,000 persons in both sexes combined comparing 1989-1991 to 2009-2011 (88). The incidence of vertebral fracture increased by 280 for women (812 to 1092) and 338 (460 to 798) for men when comparing age adjusted rates from 1989-1991 to 2009-2011 (88).
25
In a study of patients (including men) admitted to an internal medicine service in Italy, 47.5% of all patients had at least one vertebral deformity. Of most interest was 79.7% of these vertebral fractures were found in persons without a previous diagnosis of osteoporosis. Although the rate of vertebral deformities is relatively high, with 32% (atraumatic vertebral fracture) or 25% (vertebral compression fracture) of women expected to have a measurable vertebral deformity in their lifetime (depending on definition), severe vertebral deformities representing
~10% of all vertebral deformities are responsible for substantial increases in back pain and disability (110-113). They also represent the majority of deformities which are symptomatic and require medical intervention (96, 114). Therefore, estimates based on report rather than
measurement of vertebrae likely underestimate the prevalence of vertebral fracture.
2.2.2.3 Other Fractures
The most common fracture site after hip and vertebral are fractures of the wrist, typically classified as fractures of the ulna or radius. In an analysis of a commercially insured population between 2000 and 2005 Islam et al found the age adjusted incidence of wrist fractures to increase from 10.2 to 16.4 per 10,000 persons (94). Within this cohort, they also found an increase in rib and pelvis fractures between 2000 and 2005 (94). Based on the Rochester cohort, distal forearm fractures had increased by ~0.5% per year from 1945 to 1994 (115). While distal forearm fractures were reported to have decreased from 646 to 475 per 100,000 person years between 1989-1991 and 2009-2011 (88). Rib and pelvis fractures have also been noted to have decreased during this time period (88). However, the epidemiology of other fracture sites has not been well documented within the United States.
In a longitudinal study of the Geelong Osteoporosis Study 55.2% of the study population (females and males) had a fracture at some point in their lives. The study included all fracture