Sulfur flotation performance recognition based on hierarchical classification of local
dynamic and static froth features
Yalin Wanga,∗∗, Bei Suna,∗∗, Runqin Zhanga,∗∗, Quanmin Zhub aSchool of Information Science and Engineering, Central South University, China 410083
bDepartment of Engineering Design and Mathematics, University of the West of England, Coldharbour Lane, Bristol BS16 1QY, UK
Abstract
This study proposes a flotation performance recognition system based on a hierarchical classification of froth images using both local dynamic and static features, which includes a series of functions in image extraction, processing and classification. Within the integrated system, to identify the abnormal working condition with poor flotation performance (NB it could be significantly different with the dynamic features of the froth in abnormal working condition), it is functioned firstly with building up local dynamic features of froth image from the information including froth velocity, disorder degree, and burst rate. To enhance the dynamic feature extraction and matching, this system introduces scale-invariant feature transform (SIFT) method to cope with froth motion and the noise induced by dust and illumination. For the performance subdivision under normal working conditions, Bag-of-words (BoW) description is utilized to fill the semantic gap in performance recognition when images are directly described by global image features. Accordingly typical froth status words are extracted to form a froth status glossary so that the froth status words of each patch form the BoW description of an image. A Bayesian probabilistic model is built to establish a froth image classification reference with the BoW description of images as the input. An expectation-maximization (EM) algorithm is used for training the model parameters. Data obtained from a real plant are selected to verify the proposed approach. It is noted that the proposed system can reduce the negative effects of image noise, and has high accuracy in flotation performance recognition.
Keywords: froth flotation; static features; dynamics features; hierarchical classification; performance recognition
1. Introduction
Froth flotation is a widely used mineral separation technol-ogy to acquire high-grade concentrates. It has a long process flow which involves complex physical and chemical reactions with various influence factors. Due to reasons like fluctuation of feeding conditions, maloperations and external disturbances, a flotation process exhibits multiple working conditions with dif-ferent flotation performance. An accurate mathematical model that could comprehensively and precisely describe the dynam-ics of a froth flotation process, and thus to guide the operation, is costly to obtain. As an alternative, surface froth features, which are closely related to the final concentrate grade and re-covery rate, are utilized as the performance indicator in practi-cal production [1].
Performance recognition is crucial and fundamental in the optimal operation of a flotation process. With the development of machine vision and artificial intelligence, digital image pro-cessing technology has been widely applied in the classifica-tion of froth surface images and recogniclassifica-tion of flotaclassifica-tion perfor-mance [2]. Moolman et al. used digital image analysis and an artificial neural network approach in the classification of froth
∗Corresponding author
∗∗These authors contributed equally to this work and should be considered
co-first authors.
Email address:[email protected](Bei Sun)
the attached material within the system, whereas the velocity is related to the concentration of entrained material recovered. Morar chose the burst rate of froth surface lamellae to represent froth stability since each burst event signal is not determined by bubble size or any other froth structural features [15].
As indicated by previous studies, both dynamic features, such as froth stability, and static features, reflect flotation per-formance from different aspects, and should be taken into con-sideration together in flotation performance recognition. How-ever, there are few studies used both dynamic and static features in flotation performance recognition[16]. For a more detailed review of the application of machine vision in flotation process monitoring and control, the reader is referred to excellent re-views such as [17, 18, 19] and the references therein.
For sulphur flotation process, due to the high hydrophobici-ty of sulphur, the addition of chemical reagents is not required. The operations mainly include adjusting of air flow rate and pulp level. It is important to keep the pulp level around optimal to assure that a sufficient part of the valuable froth is collect-ed while abnormalities like turning pulp is avoidcollect-ed. According to expert experience, when pulp overflows, the froth exhibits distinct dynamic features compared with normal working con-ditions. This is verified in [20, 21, 22] which concluded that the variation of pulp level is reflected by the dynamic froth features including velocity, disorder degree and burst rate.
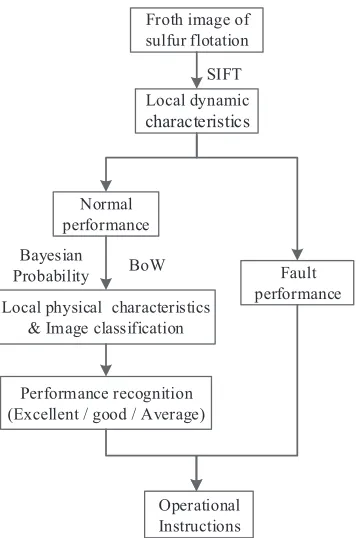
This study utilized both local dynamic and static froth fea-tures to detect the abnormal working condition and evaluate the sulfur flotation performance under normal working condition-s. In Section 2, the sulfur flotation process is introduced and analyzed, and a hierarchical flotation performance recognition framework is proposed. In order to obtain the dynamic features of froth and avoid the semantic gap in performance recogni-tion when images are directly described by global image fea-tures, the froth images are divided into local patches. Section 3 studies the detection of abnormal working conditions using local dynamic froth features. Three local dynamic features of the froth, including froth velocity, disorder degree, and burst rate, are extracted using the Scale Invariant Feature Transform (SIFT) algorithm. These local dynamic features are then used to detect the abnormal working conditions. Section 4 consid-ers the evaluation of flotation performance under normal work-ing conditions uswork-ing local static froth features. The local static features such as texture and color are extracted to obtain the ’Bag of Words’(BoW) description. The flotation performance is then recognized using a Bayesian probabilistic model. By comprehensively considering the relationship between flotation performance and local dynamic and static froth features, a hier-archical sulfur flotation performance recognition system is es-tablished. In Section 5, the proposed approach is tested through simulation experiments with data collected from a real plant.
2. Problem analysis
In metallurgy plants, sulfur flotation is used to recover valu-able sulfur as a secondary product from leaching residues of sulfide minerals. It is conducted by taking advantages of the naturally strong hydrophobicity of sulfide ores. The addition
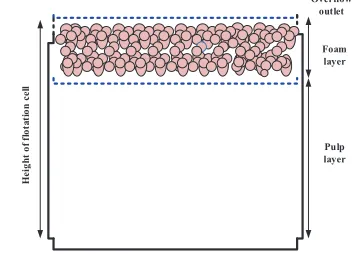
of chemical reagents is not necessary. The operation of sulfur flotation mainly involves the adjusting of pulp level and inlet air flow. As shown in Fig. 1, air is blew into the flotation cel-l to enabcel-le the formation of air bubbcel-les with mineracel-l particcel-les attached. The sulfur concentrate is recovered by collecting the mineralized froth at the overflow of the flotation cell.
[image:2.595.334.512.170.297.2]H e ig h t o f fl o ta ti o n c e ll Pulp layer Foam layer Overflow outlet
Figure 1: Cross-section diagram of a flotation cell
The thickness of froth layer has a large impact on the con-centrate grade. Increasing the thickness of the froth layer can prolong the residence time of the solid particles in the froth layer. It is beneficial to the detachment of gangue, and thus improve the concentrate grade. The height of the flotation cell is fixed, and equals to the sum of the pulp level and thickness of the froth layer. If the pulp level is low, then the froth layer is thick, and vice versa. Therefore, pulp level, which indicates and affects the flotation performance, is a key variable in sulfur flotation.
Pulp level is related to a number of dynamic froth features. When the pulp level is too high, the froth layer is extremely thin. The froth mainly consists of blister and flows fast. This may lead to the spillover of pulp and a low concentrate grade. When the pulp level is too low, the froth layer is excessively thick. The froth becomes sticky and difficult to collapse or burst. This leads to a slow froth overflow, or even non-overflow, resulting in low recovery. Hence, changes in pulp level are directly reflected in the dynamic features of froth image, including velocity, dis-order degree, and burst rate, which reflect flotation performance to a large extent. On the other hand, froth images under diff er-ent working conditions exhibit different static features, such as the fineness of froth texture, depth of grooves, etc. In addition, the froth color reflects the quantity of minerals carried by the froth.
Froth image of sulfur flotation
SIFT
Local physical characteristics & Image classification
BoW
Performance recognition (Excellent / good / Average)
Operational Instructions Bayesian
Probability
Local dynamic
characteristics
Normal performance
[image:3.595.75.255.78.347.2]Fault performance
Figure 2: The hierarchical performance recognition system based on both local dynamic and static froth features
BoW model. The Bayesian probabilistic model is introduced to train the model parameters using the expectation-maximization algorithm(EM).
3. Abnormal working condition recognition based on Scale-Invariant Feature Transform
In this section, a feature matching method based on SIFT is devised to extract the local dynamic features of froth image. First, three local dynamic features, i.e., speed, disorder degree, burst rate, and their computing formulas are selected and de-fined, respectively. Then, the relationship between these fea-tures and flotation performance is analyzed using froth images collected from a sulfur flotation plant. These dynamic features are used to detect the abnormal working condition, which laid a foundation for the later ’static features-based’ flotation perfor-mance subdivision under normal working conditions.
3.1. Key points extraction and matching
SIFT algorithm is a local feature descriptor based on scale space theory[23][24]. The main idea of scale pace theory is to present the original image on different scales and to extrac-t extrac-the invarianextrac-t key poinextrac-ts, edge, corner, as well as oextrac-ther fea-tures. SIFT is invariant to rotation, scaling, brightness change and affine transformation of image, and holds a certain stability towards angular variation and noise. For two consecutive ages to be matched, two vector sets of key points in the two im-ages can be obtained. Then, the vector similarity is calculated to
determine whether the two key points match. Implementation of SIFT algorithm is as follows,
• The detection of key points in froth images;
• Accurate positioning of key points;
• Calculating the orientation parameters of key points;
• Generation of parametric statistics and the final descrip-tion vector of key points.
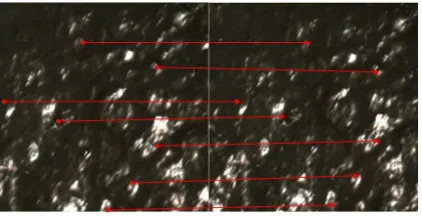
The effectiveness of SIFT was tested under three typical cat-egories of froth status. In the first category, the moving speed of froth is moderate and the moving direction is stable and uni-form. The froth has good surface adhesion and hardly burst. In the second category, froth moves faster with disordered direc-tions and less foam on the surface, resulting in low concentrate grade. In the third category, froth moves in a high speed which resulted in blurry froth surface and poor flotation performance. The matching results are shown in Fig. 2 (the coordinates are pixel coordinates). In Fig. 2 (a), (c), and (e), red line depicts matching result of the key points. The two endpoints of each red line represent the two matched key points. (Because of the large number of matched points, the figure shows only part of the key points). Fig. (b), (d), and (f) show schematic views of the velocity field of each category.
3.2. Local dynamic features extraction based on SIFT
According to the result of section 3.1, froth velocity, disorder degree and burst rate are selected as the dynamic features of froth. The formulae of these dynamic features are given in Eqs. (1) to (7).
Consider two consecutive images, the key points are first ex-tracted. The pixel displacements in the X and Y directions of the key point in unit time are obtained, as well as the velocity of the froth. Take the pixel displacements of two consecutive images in the X direction as x, the pixel displacement in the Y direction as y, the velocity in the horizontal direction as Vx, the velocity in the vertical direction as Vy, the froth velocity as V, and the movement direction asθ. Then if the sampling rate of the cameras in the sulfur flotation plant is D frame images per second, the equations for these variables are as follows,
Vx=
X
D
x (1)
Vy=
X
D
y (2)
V =
q
V2
x+Vy2 (3)
θ=arctanVy Vx
(4)
The unit of the velocity’s magnitude and velocity’s direction is pixel/sec (pixel per second) and deg/s (degree per second), re-spectively. In addition, to describe the disorder degree, express the froth velocity as,
(a) SIFT-based matching results in the first category (b) Froth velocity field of the first category
(c) SIFT-based matching results in the second category (d) Froth velocity field of the second category
[image:4.595.75.286.494.602.2](e) SIFT-based matching results in the third category (f) Froth velocity field of the third category
where ¯V is the average velocity of the froth over a period of time, and V′is the fluctuation of froth velocity. Then, define the following,
VT = √
V′2
¯
V . (6)
The average value of VTover a certain period of time is taken to represent the froth disorder degree. Besides the fluctuation in velocity magnitude, the change in froth velocity direction also reflects the disorder degree of froth movement to some extent. It can be noted from Fig. 2 that, in Fig. 2(d) the change in froth movement direction is more obvious than the change in Fig. 2(b) and (f), which is relatively stable.
Froth burst rate can be measured by the ratio of the total num-ber of key points and the numnum-ber of matched key points. The greater the ratio, the higher the burst rate:
S = N¯sum
Nmatch
, (7)
where ¯Nsumis the average number of key points in two adjacen-t frames of images, and Nmatchis the number of matched key points in two adjacent frames of images.
3.3. Abnormal working condition recognition based on local dynamic features
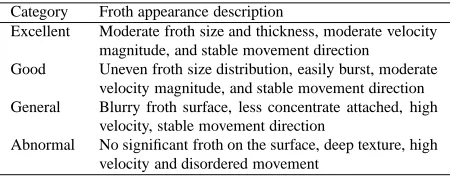
[image:5.595.51.278.510.599.2]A flotation process has both normal and abnormal working conditions, and according to the different grades of concentrate, the flotation performance under normal working conditions can be divided into three categories like excellent, good, and gener-al, see Table 1. Froth images representing the four performance categories are shown in Fig. 4.
Table 1: Flotation froth appearance in different performance categories
Category Froth appearance description
Excellent Moderate froth size and thickness, moderate velocity magnitude, and stable movement direction
Good Uneven froth size distribution, easily burst, moderate velocity magnitude, and stable movement direction General Blurry froth surface, less concentrate attached, high
velocity, stable movement direction
Abnormal No significant froth on the surface, deep texture, high velocity and disordered movement
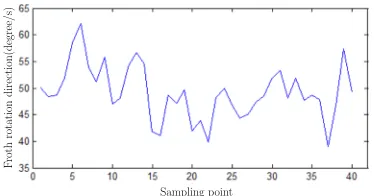
Consider a froth image sequence collected from a plant in three different time periods (denoted as A, B, and C), time pe-riod A refers to normal performance, while time pepe-riod B and C refer to abnormal performance. The local dynamic froth fea-tures extracted using the SIFT image matching algorithm are shown in Fig. 5. Fig. 5 (a)-(f) show froth velocity and froth velocity direction in time periods A, B and C. Fig. 5 (g) shows the froth burst rate in time periods A, B and C.
As can be seen from Fig. 5, the dynamic features in the three time periods showed great differences. Flotation performance in time period A is normal, in which the velocity magnitude kept in the range of 300-500 pixels/sec and movement direction
maintained at a small range of 40-65 deg/s. However, in time period B, the froth velocity magnitude is in the range of 600-700 pixels/sec, which indicates a very high speed. The move-ment direction maintained at a smaller range of 20-35 deg/s, froth during this period is likely to burst, and this resulted in unsatisfying flotation. In time period C, both froth velocity and velocity direction fluctuate sharply, and froth movement is dis-ordered. This is due to turning pulp, which indicates poor flota-tion performance and should be avoided.
4. Froth image classification based on the BoW model and Bayesian probabilistic model
Global features extracted from two distinct images may be very similar, resulting in lower accuracy froth image classifi-cation and performance recognition. Moreover, when the im-age is processed as a whole, describing the imim-age using global features is unintelligible. There exists a semantic gap problem in the classification, i.e., the inconsistency between global fea-tures and high-level semantic. In addition, due to dust and il-lumination, the noises in froth images have diverse impacts on different categories of froth images. Hence, to improve the ac-curacy of image classification and performance recognition, as well as to achieve optimal control of sulfur flotation, local dy-namic froth features are extracted and utilized in this study. An image is first divided into patches. The texture and color fea-tures of local patches are extracted, and transformed into words of froth status. Then, the BoW description of the images is obtained. The Bayesian probability model is introduced, and EM (Expectation-Maximization) algorithm is used for training model parameters.
4.1. BoW description of froth image
The BoW description of froth images is inspired by the BoW text classification model[25][26]. BoW is a simplified repre-sentation model, in which a text (or document) is represented as a bag of keywords and phrase. The grammar and the order of words in the text are ignored. In a document, the occurrence frequency of each key word is a representation of the theme. Similarly, in image classification, the occurrence frequency of each froth status word indicates the theme of an image, i.e., the category an image belongs to.
To start with, K-means clustering method is applied to obtain the froth status glossary,
• Step 1: Select N frames of images from the image library. The selected images should cover as much categories of flotation performance as possible;
• Step 2: Divide each image into m×m patches with the same pixel size Lx×Ly;
(a) Excellent (b) Good
[image:6.595.89.514.214.592.2](c) General (d) Abnormal
Sampling point
Direction X Direction Y
F
roth
velo
cit
y(pixel/s)
(a) Froth velocity in period A
Sampling point
F
roth
rotation
direction(degree/s)
(b) Froth velocity direction in period A
Sampling point
Direction X Direction Y
F
roth
velo
cit
y(pixel/s)
(c) Froth velocity in period B
Sampling point
F
roth
rotation
direction(degree/s)
(d) Froth velocity direction in period B
Sampling point
Direction X Direction Y
F
roth
velo
cit
y(pixel/s)
(e) Froth velocity in period B
Sampling point
F
roth
rotation
direction(degree/s)
(f) Froth velocity direction in period C
Sampling point
Period A Period B
Burst
rate
Period C
[image:7.595.324.511.105.203.2](g) Abnormal
• Step 4: Cluster all the feature description vectors using K-means method to obtain D clustering centers, which are the words of froth status. Then, the froth status glossary is obtained.
After the establishment of the froth status glossary, the BoW approach can be adopted to describe the froth image. BoW description of a froth image is a 1×D dimensional vector, in which each element illustrates the occurrence frequency of cor-responding froth status word in the patches. The acquired BoW description of a froth image is shown in Fig. 5. The acquisition steps are given as follows.
• Step 5: As each patch of the under processing image has different local features, repeat steps 1-3 to acquire feature vector description of each patch;
• Step 6: Obtain the similarity between the feature vector of each patch with the words in the froth status glossary by calculating the Euclidean distance. Then, choose the one with the highest similarity as the froth status word of the patch.
• Step 7: Calculate the frequency of each froth status word to obtain the BoW description.
[image:8.595.37.282.386.512.2]! " " #" # " # " #!" !" #!#" $% &'(' ) * %# % % % % % %# %# % % % %# % %# %# %
Figure 6: BoW description of froth images
As can be seen from Fig. 6, the BoW of a froth image is o-batined as [0,0,3,3,3,1,6,0]. Its high-level semantic meaning could be derived from the BoW description. The BoW descrip-tion vector is a 1 ×8 vector, which means there are 8 froth status words in the froth status glossary. In the BoW descrip-tion vector, 6 means that the 7th froth status word appeared 6 times, which indicates plenty of big froth in the image. Ele-ments with a value of 0 had no corresponding froth status word in the image, which means that the image did not contain blurry or smooth texture regions. This description is similar to human understanding, which from a certain perspective fills the seman-tic gap.
4.2. Froth image classification based on the Bayesian proba-bilistic model
The Bayesian theorem derive the probability of an even-t based on prior probabilieven-ty of condieven-tions relaeven-ted even-to even-the eveneven-t.
In sulfur flotation froth image classification, in order to make full use of prior knowledge (prior probability) and sample in-formation, the following assumptions are made.
• One image solely belong to one category zk∈ {z1,· · ·,zNz}, e.g., excellent, good, general.
• Category variables zk(k = 1,2,3,· · ·,Nz) obey the poly-nomial distribution on all froth image sample sets.
• Froth status wordsωj( j =1,2,3,· · ·,Nw) obey the poly-nomial distribution on a certain category zk.
On the basis of the above three assumptions, define following variables: p(d) represents the occurrence probability of a BoW vector (abstracted from a froth image) in the sample set, p(ωj | zk) depicts the occurrence probability of froth status wordωj when the corresponding category zk is set, p(zk,d) stands for the probability distribution of all categories in one image. Thus, the joint probability distribution of the froth status wordωjand BoW vector d is,
p(di, ωj)=p(d)p(ωj|d) (8)
p(ωj|d)= Nz
X
k=1
p(ωj|zk)p(zk|d) (9)
Thus
p(d, ω)=p(d)X z
p(z|d)p(ω|z) (10)
which can also be formulated as
p(d, ω)=X z
p(d)p(d|z)p(ω|z). (11)
Therefore, for the whole BoW vector set and froth status glossary, the model becomes
P(D,W)=
D Y d Nw Y w p(d)X z
p(z|d)p(ω|z), (12)
where di is the ith BoW vector in the sample set, Nw is the number of froth status words, and D is the number of BoW vectors in the sample set. The total number of model parameters is D·Nz+Nz·Nw.
Hence, the maximum likelihood parameter optimization problem of the classification model based on the Bayesian prob-abilistic model can be formulated as
max logP(D,W) (13)
st. X
z
p(z|d)=1
X
z
p(ω|z)=1
X
z
p(d)=1.
• Initializing the model parameters p(ω | z) and p(ω | d) according to the experts’ experience and knowledge.
• Step ’E’: Calculate p(z|ω,d).
p(z|ω,d)= p(ω|z,d)
p(ω,d) =
p(ω|z)p(z|d)
P
zp(ω|z)p(z|d)
(14)
Here, p(z|ω,d) is the category distribution of froth status words in a specific given froth image.
• Step ’M’: Calculate the derivations of the parameters, the maximum likelihood condition is met when the derivatives are equal to 0. Therefore,
p(d)=
P
ωPzn(d, ω)p(z|ω,d)
P
dPωPzn(d, ω)p(z|ω,d)
= Pn(d)
nn(d)
, (15)
p(ω|z)=
P
dn(d, ω)p(z|ω,d)
P
ωPdn(d, ω)p(z|ω,d)
, (16)
p(z|d)=
P
ωn(d, ω)p(z|ω,d)
P
zPωn(d, ω)p(z|ω,d)
=
P
ωn(d, ω)p(z|ω,d)
n(d) ,
(17)
where n(d, ω) indicates the times that froth status wordω ap-pears in froth image d. Step ’E’ and step ’M’ conduct iterative-ly until convergence. The resulted model parameters p(ω | z) and p(z|d) can then be used to derive the category of the froth image.
4.3. Experimental verification and analysis
In Section 3, by using the dynamic feature extraction based on the SIFT feature matching method described, abnormal working condition can be identified when the dynamic features exceed a predefined threshold. This section deals with the clas-sification of flotation performance under normal working con-ditions. The number of flotation performance categories is set as Nz = 3. We collected 300 froth images cover all the three categories (excellent, good, general) from a plant, 150 images for model training and the rest 150 images for testing. Before conducting the experiment, the images were labelled manually according to experts’ experience. The labelling result was then used as a reference to evaluate the image classification result.
In the simulation, the size of froth status glossary is assumed to be 20. The performance of the proposed image classification approach is illustrated in Fig. 7 and Table 2. Fig. 8 and Fig. 9 illustrate the impact of the size of froth status glossary and the number of patches in an image on the classification results.
The simulation result indicates a high classification accuracy. In addition, the size of froth status glossary and the number of patches in an image have an impact on the classification result. Increase the size of glossary would improve the classification accuracy. However, the flotation froth image obtained has a low gray level and the contrast between images in different cat-egories are not obvious. And beyond certain limits, increasing the size of the glossary can not result in a higher classification accuracy. So a large froth status glossary is not advised. Simi-lar phenomena was found in the relation between classification accuracy and the number of patches in an image.
Category 1 Category 2 Category 3
Sample
num
b
er
[image:9.595.323.538.83.183.2]Entire sample Accurate sample
[image:9.595.47.292.95.338.2]Figure 7: Image classification result based on Bayesian proba-bilistic model using local static features (Nz=3, the size of froth status glossary Nw=20)
Table 2: Statistics of froth image classification result (Nz=3, the size of froth status glossary Nw=20)
Numbers Excellent Good General
Samples 56 58 46
Accuracy 52 54 42
Accuracy rate 92.8% 93.1% 91.3%
Codebook size
Accuracy
[image:9.595.323.541.297.514.2]rate(%)
Figure 8: Influence of codebook size on classification accuracy
Number of patches
Accuracy
rate(%)
[image:9.595.324.542.560.711.2]5. Results and Discussion
[image:10.595.325.541.123.245.2]5.1. Recognition of abnormal working condition
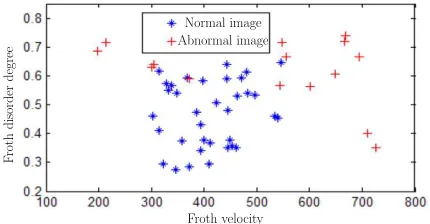
Fig. 10 shows the distribution of froth image samples, where the axes are the parameters of two local dynamic features (ve-locity and disorder degree). Statistical results of the normal and abnormal working conditions based on classification of froth velocity and disorder degree are shown in Table 3. The classifi-cation and recognition system showed high accuracy for normal working condition recognition, up to 96.5%. The accuracy for abnormal working condition recognition is 86.7%.
Froth velocity Normal image Abnormal image
F
roth
disorde
r
[image:10.595.57.272.247.359.2]degree
Figure 10: Feature distribution under normal and abnormal working conditions
Table 3: Classification performance using velocity and disorder degree
Category Normal Abnormal
Manual classification 57 15
System classification 59 13
Errors 2 2
Accuracy 96.5% 86.7%
5.2. Hierarchical classification system
Figs. 11 and 12 show the classification result with a combina-tion of local physical and dynamic features. The static features, such as texture and color features, are normalized and convert-ed into one parameter, which is denotconvert-ed as mean absolute of texture. Fig. 11 gives the distribution result of manual classi-fication of froth image samples, and Fig. 12 shows the distri-bution result of the proposed classification system. Statistical result of the hierarchical classification system based on dynam-ic and statdynam-ic characteristdynam-ics are shown in Table 4, where A, B, C, and D correspond to four categories of froth performance (ex-cellent, good, general, and abnormal, respectively). The result indicated that the proposed hierarchical classification based on local dynamic and static features could accurately identify the four types of froth.
Feature Disorder degree
V
elo
cit
y
Type A Type B Type C Type D
Figure 11: Manual classification result
Feature Disorder degree
V
elo
cit
y
[image:10.595.325.542.373.498.2]Type A Type B Type C Type D
Figure 12: Classification result using the proposed method
Table 4: Statistical results of the proposed classification system
Category A B C D
Manual classification 19 18 20 15
System classification 21 18 22 13
Errors 2 1 3 2
[image:10.595.84.245.478.527.2]6. Conclusions
A sulfur flotation performance recognition system based on hierarchical classification was developed in this paper. Since froth shows largely different dynamic characteristics under nor-mal and abnornor-mal working conditions in sulfur flotation, both local dynamic and static features were utilized to reduce the limitations introduced by only using static froth features in flotation performance recognition. The experimental results in-dicate that the abnormal and normal working conditions can be effectively identified with high recognition accuracy. There-fore, this system shows prospect for applications in sulfur flota-tion plants, and could be tailored and applied in other flotaflota-tion processes.
The effectiveness of this method could be explained from the perspective of information. In the operation of industri-al processes, operators usuindustri-ally encounter the the ’information asymmetry’ situation in which the control variables are adjust-ed with limitadjust-ed information comparadjust-ed with the complex system dynamics and it is thus hard to achieve global optimal[28]. By utilize both local dynamic and static froth features, the ’infor-mation asymmetry’ situation in sulfur flotation process is lifted. The result in this paper encouraged the development of more advanced flotation performance recognition algorithms which could process more froth features, especially in the context of fiercer competition and the global upgrading of industrial au-tomation system from Industry 3.0 to Industry 4.0.
References
[1] C. Aldrich, D. Moolman, S.-J. Bunkell, M. Harris, D. Theron, Relation-ship between surface froth features and process conditions in the batch flotation of a sulphide ore, Minerals Engineering 10 (1997) 1207–1218. [2] J. Bouchard, A. Desbiens, R. del Villar, E. Nunez, Column flotation
sim-ulation and control: An overview, Minerals Engineering 22 (2009) 519– 529.
[3] D. Moolman, C. Aldrich, J. Van Deventer, D. Bradshaw, The interpreta-tion of flotainterpreta-tion froth surfaces by using digital image analysis and neural networks, Chemical Engineering Science 50 (1995) 3501–3513. [4] D. Moolman, C. Aldrich, G. Schmitz, J. Van Deventer, The
interrelation-ship between surface froth characteristics and industrial flotation perfor-mance, Minerals Engineering 9 (1996) 837–854.
[5] J. Hargrave, N. Miles, S. Hall, The use of grey level measurement in predicting coal flotation performance, Minerals Engineering 9 (1996) 667–674.
[6] V. Singh, S. M. Rao, Application of image processing and radial basis neural network techniques for ore sorting and ore classification, Minerals Engineering 18 (2005) 1412–1420.
[7] J. Zhu, W. Gui, C. Yang, H. Xu, X. Wang, Probability density function of bubble size based reagent dosage predictive control for copper roughing flotation, Control Engineering Practice 29 (2014) 1–12.
[8] M. He, C. Yang, X. Wang, W. Gui, L. Wei, Nonparametric density esti-mation of froth colour texture distribution for monitoring sulphur flotation process, Minerals Engineering 53 (2013) 203–212.
[9] E. Ventura-Medina, N. Barbian, J. Cilliers, Froth stability and flotation performance, in: Proceedings of XXII International Mineral Processing Congress, Cape Town, South Africa, pp. 937–945.
[10] N. Barbian, E. Ventura-Medina, J. Cilliers, Dynamic froth stability in froth flotation, Minerals Engineering 16 (2003) 1111–1116.
[11] N. Barbian, K. Hadler, E. Ventura-Medina, J. Cilliers, The froth stabil-ity column: linking froth stabilstabil-ity and flotation performance, Minerals Engineering 18 (2005) 317–324.
[12] S. Morar, D. Hatfield, N. Barbian, D. Bradshaw, J. Cilliers, B. Triffett, A comparison of flotation froth stability measurements and their use in the
prediction of concentrate grade, in: Proceedings of the XXIII Internation-al MinerInternation-als Processing Congress, pp. 739–744.
[13] N. Barbian, J. J. Cilliers, S. H. Morar, D. J. Bradshaw, Froth imaging, air recovery and bubble loading to describe flotation bank performance, International Journal of Mineral Processing 84 (2007) 81–88.
[14] K. Runge, J. McMaster, M. Wortley, D. La Rosa, O. Guyot, A correlation between visiofrothtm measurements and the performance of a flotation
cell, in: Ninth Mill Operators Conference, pp. 19–21.
[15] S. H. Morar, D. J. Bradshaw, M. C. Harris, The use of the froth surface lamellae burst rate as a flotation froth stability measurement, Minerals Engineering 36 (2012) 152–159.
[16] Y. Fu, C. Aldrich, Flotation froth image analysis by use of a dynamic feature extraction algorithm, IFAC-PapersOnLine 49 (2016) 84–89. [17] C. Aldrich, C. Marais, B. Shean, J. Cilliers, Online monitoring and
con-trol of froth flotation systems with machine vision: A review, Internation-al JournInternation-al of MinerInternation-al Processing 96 (2010) 1–13.
[18] B. Shean, J. Cilliers, A review of froth flotation control, International Journal of Mineral Processing 100 (2011) 57–71.
[19] I. Jovanovi´c, I. Miljanovi´c, Contemporary advanced control techniques for flotation plants with mechanical flotation cells–a review, Minerals Engineering 70 (2015) 228–249.
[20] T. Subrahmanyam, E. Forssberg, Froth stability, particle entrainment and drainage in flotationła review, International Journal of Mineral Processing 23 (1988) 33–53.
[21] F. N ´u˜nez, A. Cipriano, Visual information model based predictor for froth speed control in flotation process, Minerals Engineering 22 (2009) 366– 371.
[22] S. Farrokhpay, The significance of froth stability in mineral flotationła review, Advances in colloid and interface science 166 (2011) 1–7. [23] J. S. Beis, D. G. Lowe, Shape indexing using approximate
nearest-neighbour search in high-dimensional spaces, in: Computer Vision and Pattern Recognition, 1997. Proceedings., 1997 IEEE Computer Society Conference on, IEEE, pp. 1000–1006.
[24] D. G. Lowe, Distinctive image features from scale-invariant keypoints, International journal of computer vision 60 (2004) 91–110.
[25] T. Hofmann, Probabilistic latent semantic indexing, in: Proceedings of the 22nd annual international ACM SIGIR conference on Research and development in information retrieval, ACM, pp. 50–57.
[26] D. Filliat, A visual bag of words method for interactive qualitative local-ization and mapping, in: Proceedings 2007 IEEE International Confer-ence on Robotics and Automation, IEEE, pp. 3921–3926.
[27] A. P. Dempster, N. M. Laird, D. B. Rubin, Maximum likelihood from incomplete data via the em algorithm, Journal of the royal statistical society. Series B (methodological) (1977) 1–38.