Acknowledgements
This project was supported by a David Bray Peele Memorial Research Award from the Department of Psychology and Neuroscience, University of North Carolina at Chapel Hill.
Abstract
Real-world risk-taking behaviors peak during the transition from high school to college, perhaps due to increased opportunity to engage in such behaviors. Examining longitudinal changes in the association between neural sensitivity to risky decision making and real-life risk-taking behavior may elucidate the underlying mechanisms that motivate increased risk-taking behavior during late adolescence. The goal of the present study was to understand how brain regions implicated in risky decision making differentially predict concurrent and longitudinal changes in real-life risky behavior. Forty college freshmen completed an experimental risk-taking task during fMRI, in which taking risks could benefit either themselves or their best friend, allowing us to
understand risky decision making across different social contexts. Participants reported their frequency of binge drinking at the initial visit (n = 40) and a follow-up visit nine months later (n = 35). We first conducted logistic regressions to analyze the relationship between behavior on the fMRI task and concurrent and longitudinal changes in binge drinking. Our findings showed that task behavior predicts concurrent binge drinking behavior but does not predict longitudinal changes in binge drinking. Using the brain-as-predictor model, we conducted logistic regressions to analyze the relationship between brain activation in four a priori regions of interest during the fMRI task and concurrent and longitudinal changes in binge drinking behavior. Our findings showed that brain activation during the task does not significantly predict concurrent or longitudinal changes in binge drinking behavior. Future research should further probe the contexts in which brain activation is predictive of real-life risk-taking behavior – beyond binge drinking – during late adolescence.
Using Neural Measures of Risk Taking to Predict Binge Drinking Behavior in Late Adolescence Considerable evidence suggests that adolescents engage in increased risk taking
compared to children and adults (Braams, Peters, Peper, Güroğlu, & Crone, 2014; Powers et al., 2018; Steinberg, 2008). This behavioral difference can lead to many negative outcomes during adolescence, including driving accidents, substance abuse, and risky sexual behaviors (Blum & Nelson-Mmari, 2004). In a cross-national study, both the propensity to take risks and actual risk-taking behavior was found to be highest during late adolescence (Duell et al., 2018), suggesting that late adolescence (i.e., 18-20 years old) may be an especially important period during which to examine changes in risk-taking behavior. At this age, many young adults are leaving home for the first time to attend college; this transition may provide them with greater opportunities and pressures to engage in risky behaviors (Duell et al., 2018; Willoughby, Good, Adachi, Hamza, & Tavernier, 2013). In particular, it seems that certain health-risk behaviors, such as binge
drinking, are most prevalent during late adolescence (Willoughby et al., 2013). Understanding why adolescents engage in heightened risk taking and what mechanisms underlie this propensity is important for developmental researchers. Recently, researchers have started to examine the neural correlates of risk-taking behavior in order to better understand how the brain processes various facets of the risk-taking experience. In the following sections, I will discuss hypotheses that may account for increased risk taking in adolescence and the role of social context in adolescents’ risky decision-making process. I will then describe the present study. Hypotheses Explaining Increased Risk-Taking in Adolescence
The brain continues to develop across adolescence and into the early 20s (Lebel & Beaulieu, 2011). Multiple neurobiological systems mature and interact in important ways during adolescence (Casey, 2015; Casey, Jones, & Hare, 2008; Steinberg, 2008; Telzer, van Hoorn,
Rogers, & Do, 2018). However, it is proposed that these different neurobiological systems mature according to different timelines (Casey et al., 2008; Steinberg, 2008). That is, some areas of the brain mature relatively quickly while others mature much later, though the specific neural changes are debated. Overall, research shows that adolescents exhibit heightened activity in the ventral striatum (VS) – considered a reward processing region – and other limbic areas and show cognitive deficits associated with immature prefrontal cortices (Casey, 2015; Casey et al., 2008; Steinberg, 2008; Telzer et al., 2018).
Prevailing theoretical models suggest these adolescent-specific changes in neurobiology may underlie the normative uptick in risk-taking behaviors during late adolescence (Casey et al., 2008; Ernst, Pine, & Hardin, 2006; Steinberg, 2008). Overall, these models suggest that
adolescents are more sensitive to social context (Telzer et al., 2018) and reward (Steinberg, 2008) and less sensitive to potential harms or consequences of risky or dangerous behavior (Ernst et al., 2006). Further, adolescents exhibit compromised cognitive control abilities, which may undermine their ability to inhibit impulsive responses and control their cognitive responses (Casey et al., 2008; Steinberg, 2008). Taken together, we may conclude that adolescents engage in heightened risk taking because they are more sensitive to rewards and less sensitive to
consequences while being unable to exhibit control over more impulsive and emotional responses. As I will discuss next, the presence of peers may further exacerbate this tendency towards risky behavior.
The Role of Peers in Risk-Taking
Higher levels of risk-taking behavior may emerge during late adolescence because opportunities to engage in risky behaviors may be highest during this time (Willoughby et al., 2013), suggesting that social context is important in facilitating or limiting risk-taking behavior.
In particular, peers are an especially salient part of an adolescent’s world (Greenberg, Siegel, & Leitch, 1983). Relative to children and adults, adolescents spend more time with peers compared to family (Brown, 2004) and show an increased susceptibility to peer influence (Brechwald & Prinstein, 2011; van Hoorn, van Dijk, Meuwese, Rieffe, & Crone, 2016). Given peers are an important part of an adolescent’s social context, adolescents may be more likely to engage in risky behavior in peer contexts to increase social belonging in the peer group. Indeed, prior research shows adolescents engage in greater risk-taking behaviors in the presence of friends than when alone (Chein, Albert, O’Brien, Uckert, & Steinberg, 2011; Gardner & Steinberg, 2005). In the presence of peers, the socio-emotional network is doubly activated by the potential to receive a reward and the opportunity to receive positive feedback from peers (Steinberg, 2008). These results suggest that the opinion of peers is an important and rewarding aspect of peer relationships. Adolescents may be more likely to take risks when a reward is imminent and peers approve of this decision.
Previous research has examined monetary reward processing at the neural level in different social contexts, such as in the presence of friends. In one study, researchers examined how adolescents consider the potential consequences of risky decisions for themselves and their peers (Braams et al., 2014). Adolescents played a functional magnetic resonance imaging (fMRI) task during which they could win or lose money for themselves, a friend, or a disliked peer (Braams et al., 2014). The researchers found that activation in the VS when winning for
themselves peaked during adolescence (Braams et al., 2014). Activation when winning for their friend was also related to activation in the VS, suggesting that winning for the self and a friend are similarly rewarding experiences (Braams et al., 2014). The social brain network – including areas such as the medial prefrontal cortex (mPFC) and the temporoparietal junction (TPJ) – was
more active when playing for the friend compared to playing for the self (Braams et al., 2014). These results suggest that processing in reward related regions (e.g., the VS) is important for risk-taking behavior when the consequences could impact the self or a close peer. Importantly, risk-taking behaviors are dependent on social contexts.
Researchers have also examined if adolescents compared to young adults consider the consequences that a risky decision might have for a friend in different ways. This is an important consideration because risk taking often involves or impacts multiple people, not just the self. One study had adolescent and young adult participants engage in an economic decision-making task when their friend was absent, present, or actively monitoring the participant’s actions (Powers et al., 2018). In general, considering the outcomes of an activity for a friend increases with age (Powers et al., 2018), suggesting that adolescents increasingly consider the consequences of taking a risk for others as they grow older. Adolescents consistently engaged in heightened risk taking when the friend could benefit, even if the friend was not able to see the participant’s decisions (Powers et al., 2018). Young adults, on the other hand, engaged in the most risk taking that would benefit the friend when their friend was monitoring their behavior (Powers et al., 2018). The authors suggest that this distinction may be due to an attempt to strengthen social bonds or perhaps to impress the friend who was monitoring them (Powers et al., 2018). This study furthers our conceptualization of how thinking about peer outcomes guides the risky decision-making process across development. Further, this study suggests that even late
adolescents continue to incorporate their peer into their decision-making process; this motivates our decision to focus on late adolescence in the present study.
Goals and Hypotheses of the Present Study
be related to longitudinal changes in real-world outcomes. This may be an important way to understand risk-taking behavior because brain activation during a task may predict self-reported behaviors above and beyond reported intentions (Berkman & Falk, 2013; Falk, Berkman, & Lieberman, 2012; Falk et al., 2014). Additionally, few studies have examined how risk-taking behavior manifests differently when it impacts multiple people at once. That is, simultaneously examining potential consequences of risk taking for the self and another person is important because it is more ecologically valid; in real life, making decisions about risk taking often requires considering more than one person. Further, a recent meta-analysis claims that there are no brain areas that have been consistently correlated with risk-taking (Sherman, Steinberg, & Chein, 2017); as such, more work in this area will help researchers solidify brain areas which are associated with risk taking. The present study aims to understand how neural correlates of risk taking might predict changes in risk taking, specifically binge drinking behavior, throughout the college years.
Given that brain activation may be a more powerful and objective predictor of
longitudinal changes in risk taking than self-report measures (Berkman & Falk, 2013; Falk et al., 2012; Falk et al., 2014), we use a brain-as-predictor approach to examine how activation in a priori regions of interest (ROI) are modulated by the type of consequences that risky decision making has for the self as opposed to another person. Specifically, we focus on regions involved in mentalizing (TPJ and mPFC), reward processing (VS), cognitive control (dorsolateral
prefrontal cortex; dlPFC), and socio-emotional processing (mPFC), which have been implicated in adolescent risk taking across peer contexts (Braams & Crone, 2017; Braams et al., 2014; Chein et al., 2011; Contreras, Schirmer, Banaji, & Mitchell, 2013; Geier, 2013; Pfeifer et al., 2011; Steinberg, 2008). This study will provide insight into mechanisms that drive risk taking
and will allow us to begin to understand how neural activation may be related to real-world risk-taking behavior.
Methods Participants
This longitudinal study had two waves of data collection. Wave 1 occurred during the Spring 2017 semester, and Wave 2 occurred 8-9 months later during the Fall 2017 semester. At Wave 1, we recruited a sample of 43 first-year college students (age M = 18.92, SD = .29) from a public university in the southeastern United States. All participants were screened for
neurological disorders or other MRI contradictions and provided written consent in accordance with the Institutional Review Board at the University of North Carolina at Chapel Hill. Three participants were excluded due to excessive motion or unusable data. The final sample included 20 men (age M = 18.91 years, SD = .31) and 20 women (age M = 18.93, SD = .27). The ethnic backgrounds of the participants included 52.5% White, 32.5% Asian, 7.5% African American, 5% Hispanic or Latino, 2.5% Native Hawaiian or Pacific Islander, 2.5% American Indian or Alaska Native, and 7.5% other. We collected information about parental education levels. Among participants’ mothers, 7.5% did not complete high school; 7.5% graduated high school; 2.5% completed trade or vocational school; 7.5% reported some college; 47.5% graduated from college; 10.0% reported some medical, law, or graduate school; and 17.5% graduated from medical, law, or graduate school. Among participants’ fathers, 2.5% did not complete high school; 12.5% graduated high school; 2.5% completed trade or vocational school; 5.0% reported some college; 37.5% graduated from college; 2.5% reported some medical, law, or graduate school; and 37.5% graduated from medical, law, or graduate school.
(age M = 19.85, SD = .3). One additional participant partially completed the follow-up survey but was not included in analyses because they did not respond to the target questions. The final sample at Wave 2 included 17 men (age M = 19.84, SD = .31) and 18 women (age M = 19.88, SD = .24). The ethnic backgrounds of participants at Wave 2 included 62.9% White, 40% Asian, 8.6% African American, 5.7% Hispanic or Latino, 2.9% Native Hawaiian or Pacific Islander, 2.9% American Indian or Alaska Native, and 8.6% other. Among participants’ mothers, 8.6% did not complete high school; 8.6% graduated high school; 2.9% completed trade or vocational school; 2.9% reported some college; 57.1% graduated from college; 11.4% reported some medical, law, or graduate school; and 22.9% graduated from medical, law, or graduate school. Among participants’ fathers, 2.9% did not complete high school; 14.3% graduated high school; 2.9% completed trade or vocational school; 5.7% reported some college; 45.7% graduated from college; 2.9% reported some medical, law, or graduate school; and 45.7% graduated from medical, law, or graduate school.
Materials
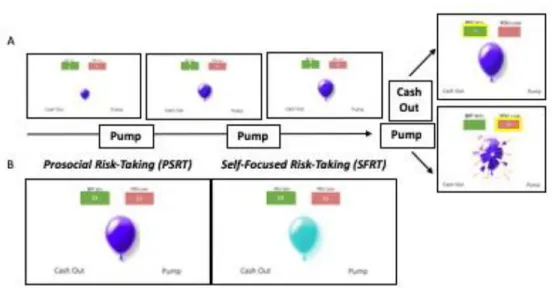
Risk-Taking fMRI Task. At Wave 1, participants completed the Balloon for Friend (BFF) task during an fMRI scan, which is a modified version of the well-validated Balloon Analog Risk Task (BART; Lejuez et al., 2002). In the BART, participants pump up a balloon in order to earn rewards, but each decision to pump increases the likelihood that the balloon will explode and all rewards gained on that balloon so far will be lost. Participants can also “cash out,” or save their points on the balloon any time before it pops. Pumping up the balloon is analogous to risk-taking behavior, and explosion outcomes can be understood as consequences of risk-taking behavior. When participants choose to cash out, they experience a reward and a positive outcome of their earlier risk taking. For the BFF task, we modified who the potential
gains (balloon cash-outs) and losses (balloon explosions) impacted in order to examine how the behavioral and neural correlates of risk-taking decisions (balloon pumps) change when there are consequences for both the self and a close other. It is important to understand the ways in which risk taking and prosociality overlap during adolescence because the literature shows similar neural responses during these two activities (Do, Moreira, & Telzer, 2017). We selected the best friend as the close other for this task due to the salience of peer relationships throughout
adolescence (Greenberg et al., 1983).
For each trial, a balloon is presented in the middle of the screen with a green box and a red box at the top of the screen. The green box displays the dollar amount that could be gained and the red box displays the dollar amount that could be lost. An indicator of who will win or lose on the trial is written above these boxes. Each decision to pump increases both the dollar amount displayed in both boxes and the size of the balloon (1:1 ratio). Explosion thresholds for each balloon ranged from 4 to 10 pumps, though participants were not explicitly informed of this explosion threshold. On each trial, participants have the option to pump the balloon or to “cash out” and keep any money accumulated on that balloon so far. Participants are instructed to gain as much money as possible throughout the task and to cash out on each balloon before it pops. Before the task, participants are told that they and their best friend each start out with a $10 bonus. They are told that one trial will be randomly chosen to determine how much money is added to or deducted from the bonuses of the participant and their best friend. Each balloon ends with either an explosion or a decision to cash out. Figure 1 displays a schematic of the task.
Either the participant or the best friend can win or lose rewards on a given balloon in four conditions: (1) Self-Focused Risk Taking (SFRT), (2) Prosocial Risk Taking (PSRT), (3)
condition is most similar to the original BART. In the SFRT condition, explosion events and cash outs both impact the participant; that is, the participant gains money (given a cash out) or the participant loses money (given an explosion event). In the PSRT condition, the participant’s best friend could win or the participant could lose. In the ASRT condition, the participant could win or the participant’s best friend could lose. Lastly, in the OFRT condition, the participant’s best friend could win and the participant’s best friend could lose. The SFRT and PSRT
conditions are our main trials of interest. This is because the SFRT is most similar to the original BART, which allows us to understand how participants take risks when the benefits and costs could impact them only. The BART is a well-validated measure of risk-taking behavior, and it has been linked to many real-world risky behaviors (Qu, Galvan, Fuligni, Lieberman, & Telzer, 2015). Because of this, we might assume that activity in the SFRT condition may be most related to real-world risk-taking behaviors. We also focus on the PSRT condition because this condition is the only other condition in which the participant might incur a risk. The PSRT condition might also be highly related to real-world risk taking because it involves taking a risk that might benefit another individual but hurt you. This happens often in the real world; for example, standing up to a bully might benefit another person but may bring harm to you. Figure 1 shows the task display during the PSRT and SFRT trial types.
Participants view 56 balloons in a fixed, but previously randomized, order across 2 runs, which are equally divided by the four conditions (14 balloons per condition). The task is self-paced such that participants have as much time as needed to make each pump decision. There is a jitter between each decision (inter-stimulus interval; ISI) and a jitter between each outcome and the next balloon (inter-trial interval; ITI). Jitters ranged from 500-3500 ms (M = 2000 ms) and were randomly generated. The outcome is presented for 1000 ms.
Questionnaire Measures. At both waves, participants reported their engagement in health-risk behaviors during the past 30 days, including sexual intercourse, alcohol and drug use, and smoking. Participants reported frequency of engagement using a Likert scale ranging from 0 (0 days) to 7 (all 30 days). We ensured participants that their responses would remain
confidential, but there is the possibility that participants self-censored their responses (see Turner et al., 1998). Because alcohol use is a common feature of the college environment despite
acknowledgement of the risks associated with this behavior (Wolburg, 2001), we focus on alcohol use, and specifically binge drinking behaviors. To capture this behavior, participants reported how often they “drank enough to feel drunk” in the past 30 days using the above Likert scale. Though our original measure asked participants to report the frequency of their binge drinking behavior, we recoded this information into a binary variable. We did this to address the little variability in the extremes of drinking behavior; because our sample reported binge
drinking in a positively skewed manner, recoding the variable allowed us to conceptualize binge drinking in a yes or no manner that may better summarize binge drinking in our sample. If participants reported that they “drank enough to feel drunk” on 0 days at Wave 1, they were including in the “no bingeing” group. If participants reported that they “drank enough to feel drunk” on at least 1 day at Wave 1, they were including in the “bingeing” group. Separate “no bingeing” and “bingeing” groups were created for Wave 2. Concurrent and longitudinal changes in binge drinking were the dependent variables in this study.
fMRI Data Acquisition
To collect data, we used a 3-T Siemens Trio MRI scanner with a 32-channel head coil. The task was presented on a computer screen that participants viewed using a mirror attached to the head coil. To obtain functional data, we used T2* weighted echoplanar images (EPI; slice
thickness = 3 mm; 38 slices; TR = 2 s; TE = 25 ms; matrix = 92 × 92; FOV = 230 mm; voxel size 2.5 × 2.5 × 3 mm). Structural scans were acquired to ensure that we had an anatomical reference; this included a T2∗-weighted, matched-bandwidth (MBW; slice thickness = 3 mm; 38 slices; TR = 5.7 s; TE = 65 ms; matrix = 192 × 192; FOV = 230 mm; voxel size 1.2 u 1.2 u 3 mm) and a T1∗ magnetization-prepared rapid-acquisition gradient echo (sagittal acquisition plane; slice thickness = 0.9 mm; 192 slices; TR = 2.4 s; TE = 2.22 ms; matrix = 256 × 256; FOV = 256 mm; voxel size 0.8 u 0.8 u 0.8 mm). We collected both EPI and MBW scans with an oblique axial orientation to avoid signal drop-out in orbital and temporal regions. This procedure allowed us to maximize coverage of the brain.
Data Analysis Plan
Using a brain-as-predictor approach, we aimed to understand if neural activation during the BFF task is predictive of concurrent binge drinking or longitudinal changes in binge drinking 8-9 months later. Four a priori brain ROIs were identified based on prior research on adolescent risk taking in a social context. First, we will examine brain activation within the VS, which has been previously implicated in reward processing (Braams & Crone, 2017; Braams et al., 2014; Chein et al., 2011; Pfeifer et al., 2011). Cognitive control regions may be important in risk-taking behavior; we will look specifically at the dlPFC (Geier, 2013). Mentalizing regions, including the TPJ and mPFC, may be important for thinking about how different decisions may impact another person (Blakemore, 2008; Contreras et al., 2013). The mPFC may also be implicated in socio-emotional processing (Steinberg, 2008), which is another aspect of the social risk-taking context that should be investigated.
In order to examine risk-taking behavior, fMRI analyses focused on decisions to pump on trials when participants decided to cash out. Notably, analyses examining risk-taking behavior
only included pump trials in which the participant decided to cash out because explosion events artificially constrain pumping behavior; that is, when an explosion occurs, it is unclear whether or not the participant would have engaged in further risky behavior, task permitting. In each participant’s first-level analysis, a general linear model (GLM) was created with 8 task regressors: decisions to pump on (1) PSRT trials, (2) SFRT trials, (3) ASRT trials, (4) OFRT trials and decisions to cash out on (5) PSRT trials, (6) SFRT trials, (7) ASRT trials, (8) OFRT trials. We modeled the number of pumps as a parametric modulator (PM) on decisions to pump for each condition which allows us to examine how our ROIs track increasing risk during the decision to pump on a trial-by-trial basis. All PM values were mean-centered by balloon within participants. As mentioned previously, we focused on decisions to pump during PSRT and SFRT trials because these trials are those in which the participant incurs a risk. We disregarded
decisions to pump during ASRT and OFRT trials as well as decisions to cash out for all trial types for the purposes of this study. Jittered inter-trial intervals were considered null events and were not explicitly modeled. These null events constituted an implicit baseline. To compare each of the conditions of interest, we created linear contrast images using the GLM parameter
estimates. We then submitted individual participant contrasts to random-effects, group-level analyses.
At the group-level, we conducted analyses to examine how neural responses when participants engaged in risk-taking behavior (pump decisions) within a priori regions differed between the PSRT and SFRT trial types. We examined how neural reactivity during risk-taking behavior (i.e., pump decisions) was modulated by trial type. Specifically, we examined risk taking related neural activation where the participant incurred a risk to benefit their best friend (PSRT > baseline) and where the participant could incur a risk or benefit (SFRT > baseline).
Comparing brain activation within these two trial types to baseline allows us to understand which brain areas are recruited when making risky decisions as opposed to simply resting. Additionally, we will calculate a difference score between brain activation during PSRT and SFRT trials (PSRT-SFRT). Using this difference score, we will attempt to understand if brain activation during the task differentially predicts concurrent or longitudinal changes in binge drinking behavior.
Results Behavioral Results
At Wave 1, our participants reported drinking enough to feel drunk at minimum 0 (0 days) and at maximum 5 (20-29 days) using the Likert scale provided. When grouped based on if they engaged in binge drinking or not, 17 participants are included in the “no bingeing” group (42.5%) and 23 participants are included in the “bingeing” group (57.5%). At Wave 2,
participants reported drinking enough to feel drunk at minimum 0 (0 days) and at maximum 4 (10-19 days) using the Likert scale provided. When grouped based on if they engaged in binge drinking or not, 13 participants are included in the “no bingeing” group (37.1%) and 22 participants are including in the “bingeing” group (62.9%).
In the BFF task, the average number of pumps taken during the PSRT condition (M = 4.35, SD = 1.1) was correlated with the number of pumps taken during the SFRT condition (M = 4.91, SD = 1.1), r = .735, p = .000. We conducted a paired samples t-test of the average number of pumps between PSRT and SFRT conditions to understand if there are significant differences in pump behavior between these two conditions. There was a significant difference between average number of pumps in the PSRT and SFRT conditions; t(39) = -4.68, p = .000.
variable of interest was brain activation. We calculated a difference score between average pumps during PSRT and SFRT trials. Because we focused on the PSRT and SFRT conditions, we used the difference score to help understand which condition might be more strongly related to our outcome of interest. We used these difference scores to predict if average pump behavior during the task might differentially predict concurrent binge drinking or longitudinal changes in binge drinking behavior. We used logistic regressions because our outcome variable was
dichotomous (i.e., “no bingeing” vs. “bingeing”). First, we used the difference score (PSRT-SFRT) to predict concurrent binge drinking behavior (i.e., at Wave 1). Next, we used the
difference score (PSRT-SFRT) in each brain region separately to predict longitudinal changes in binge drinking behavior (i.e., at Wave 2). In this model, we controlled for binge drinking
behavior at Wave 1. The logistic regression results are reported in Table 1. As shown in Table 1, average pump behavior significantly predicted concurrent binge drinking behavior (b = -1.12, SE = .56, p = .046) but does not predict longitudinal changes in binge drinking behavior. At Wave 1, pumping more on PSRT compared to SFRT trials predicted a decreased likelihood to binge drink concurrently. That is, taking more risks that might benefit a close other is related to decreased likelihood to binge drink.
fMRI Results
Figure 2 shows brain activation in each of our four regions based on trial type. We conducted paired samples t-tests in each region to understand if there are significant differences in brain activation between the PSRT and SFRT conditions. There was a significant difference in brain activation for PSRT (M = -.08, SD = .24) and SFRT (M = -.17, SD = .20) conditions in the mPFC; t(39) = 2.214, p = .033. There was not a significant difference in brain activation for PSRT (M = .16, SD = .20) and SFRT (M = .13, SD = .22) conditions in the dlPFC; t(39) =
-.759, p = .452. Likewise, there was not a significant difference in brain activation for PSRT (M = .14, SD = .20) and SFRT (M = .12, SD = .16) conditions in the VS; t(39) = .489, p = .628.
Additionally, there was not a significant difference in brain activation for PSRT (M = -.20, SD = .25) and SFRT (M = -.20, SD = .20) conditions in the TPJ; t(39) = -.162, p = .872.
We next calculated a difference score between brain activation during PSRT and SFRT trials in each of our four ROIs. Because we focused on the PSRT and SFRT conditions, we used the difference score to help understand which condition might be more strongly related to our outcomes of interest. Table 2 provides correlations between brain activation in each brain area for both trial types as well as difference scores in each area and binge drinking behavior at each time point.
We used these difference scores to predict if brain activation in these four brain areas might differentially predict concurrent binge drinking behavior or longitudinal changes in binge drinking behavior. We used logistic regressions because our outcome variable was dichotomous (i.e., “no bingeing” vs. “bingeing”). First, we used the difference score (PSRT-SFRT) in each brain region separately to predict concurrent binge drinking behavior (i.e., at Wave 1). Next, we used the difference score (PSRT-SFRT) in each brain region separately to predict longitudinal changes in binge drinking behavior (i.e., at Wave 2). In these models, we controlled for binge drinking behavior at Wave 1. The logistic regression results are reported in Table 3. As shown in Table 3, brain activation in the four ROIs did not predict binge drinking behavior at Wave 1 or Wave 2.
Discussion
The goal of the current study was to understand if brain activation in a risk-taking task predicted concurrent or longitudinal changes in real-life risk-taking behavior. We did not support
our hypothesis that brain activation in the BFF task may help us predict concurrent or
longitudinal changes in binge drinking behavior. That is, our results suggest that brain activation within the dlPFC, VS, TPJ, and mPFC are not predictive of binge drinking behavior at Wave 1 or Wave 2. However, we did find that risk-taking behavior during the task (i.e., pump behavior) is predictive of concurrent binge drinking behavior but not predictive of longitudinal changes in binge drinking behavior. That is, the average number of pumps the participant chose to make was predictive of binge drinking behavior at Wave 1 but not Wave 2. Additionally, we did find significant differences in brain activation by trial type in the mPFC, suggesting that the mPFC is tracking risk differently when the outcome can impact the self (SFRT) as compared to the best friend (PSRT).
Connection to Previous Research
When examining how brain activation during prosocial risk-taking scenarios differs from brain activation while taking self-focused risks, we found that the mPFC is less deactivated in response to increasingly risky choices that might benefit the best friend over the participant, given the participant is the individual who incurs the risk in both trial types. We propose that the mPFC is more active during low-risk scenarios and that activation decreases as riskiness
increases more so in situations where the risk impacts the self as opposed to the best friend. This is consistent with prior research that has suggested that the mPFC is involved in mentalizing, or thinking about others (Blakemore, 2008; Contreras et al., 2013). Thinking about others may be an especially important process in adolescence because peer acceptance is of paramount importance (Sebastian et al., 2011). As such, mentalizing, specifically within the mPFC, may play a larger role in tracking the level of risk in social decision making (i.e., risk taking that affects both the self and others) than when making risky decisions alone.
Limitations and Future Directions
Though we found that average pump behavior predicts binge drinking at the same time point, average pump behavior does not predict binge drinking behavior longitudinally. We may not have been able to predict longitudinal changes in binge drinking because binge drinking behavior did not change significantly in our sample between the two time points. Binge drinking at Wave 1 was highly correlated with binge drinking at Wave 2, suggesting a low variability of longitudinal change. Future studies might work to understand how task behavior and neural correlates differentially predict behavior. Additionally, future studies should work to understand how prosocial risk taking (i.e., behavior during the PSRT condition) might be related to real-life health-risk behaviors, as this is not immediately clear.
Surprisingly, neural activation that tracked increasing risk did not predict concurrent or longitudinal changes in binge drinking in our sample. A few important limitations may help explain these null results and inform future research directions. Overall, few participants reported binge drinking very frequently in the previous 30 days. Thus, our low variability may have prevented us from being able to predict their future behavior. Additionally, the Likert scale used to measure substance use in the past 30 days did not use evenly spaced markers; therefore, it is difficult to know exactly how often participants engaged in reported activities. Future studies could use a better Likert scale that might allow them to examine severity of substance use as opposed to strictly frequency.
Another important limitation to consider is the possibility that the brain regions chosen may have been more related to task activity than real-life risk taking. That is, the brain regions chosen a priori represented ones recruited during a task that involves taking risks that may differentially impact the individual or a close peer, but these brain regions may not be recruited
during real-life decisions about binge drinking. Thus, future studies might choose other brain areas or utilize a whole brain approach to understand neural activation as it relates to real-life risk taking. Alternatively, future studies might use a different task (such as the original BART) to predict real-life health-risk behaviors.
Conclusion
In conclusion, we found that brain activation during our risk-taking task in four different brain regions does not predict concurrent or longitudinal changes in binge drinking behavior. As such, future research should attempt to elucidate the ways in which brain activation is predictive of real-life outcomes. Despite this, we demonstrated that average pump behavior on the risk-taking task is predictive of binge drinking concurrently but not longitudinally. This suggests that taking more risks that might benefit a close other is related to a decreased likelihood to binge drink at the same time point. Further, we showed that the mPFC is differentially recruited in prosocial risk-taking and self-focused risk-taking scenarios. This suggests that activation in the mPFC decreases as riskiness increases and that this decrease in activation is especially
pronounced when the risk might benefit a close other. It is important to continue examining the conditions in which brain activation might predict outcomes. By understanding the conditions that best predict real-life outcomes, future researchers and clinicians might be able to use neural activation to predict future risky behavior and intervene in a timely manner. This work will allow for the use of early interventions to prevent dangerous risky behavior during adolescence.
References
Berkman, E. T., & Falk, E. B. (2013). Beyond brain mapping: Using neural measures to predict real-world outcomes. Current Directions in Psychological Science, 22(1), 45-50.
Blakemore, S. J. (2008). The social brain in adolescence. Nature Reviews Neuroscience, 9(4), 267-277.
Blum, R. W., & Nelson-Mmari, K. (2004). The health of young people in a global context. Journal of Adolescent Health, 35(5), 402-418.
Braams, B. R., & Crone, E. A. (2017). Peers and parents: A comparison between neural activation when winning for friends and mothers in adolescence. Social Cognitive and Affective Neuroscience, 12(3), 417-426.
Braams, B. R., Peters, S., Peper, J. S., Güroğlu, B., & Crone, E. A. (2014). Gambling for self, friends, and antagonists: Differential contributions of affective and social brain regions on adolescent reward processing. Neuroimage, 100, 281-289.
Brechwald, W. A., & Prinstein, M. J. (2011). Beyond homophily: A decade of advances in understanding peer influence processes. Journal of Research on Adolescence, 21(1), 166-179.
Brown, B. B. (2004). Adolescents' relationships with peers. Handbook of Adolescent Psychology, 363-394.
Casey, B. J. (2015). Beyond simple models of self-control to circuit-based accounts of adolescent behavior. Annual Review of Psychology, 66, 295-319.
Casey, B. J., Jones, R. M., & Hare, T. A. (2008). The adolescent brain. Annals of the New York Academy of Sciences, 1124(1), 111-126.
adolescent brain. Journal of Research on Adolescence, 21(1), 21-33.
Chein, J., Albert, D., O’Brien, L., Uckert, K., & Steinberg, L. (2011). Peers increase adolescent risk taking by enhancing activity in the brain’s reward circuitry. Developmental
Science, 14(2), F1-F10.
Contreras, J. M., Schirmer, J., Banaji, M. R., & Mitchell, J. P. (2013). Common brain regions with distinct patterns of neural responses during mentalizing about groups and
individuals. Journal of Cognitive Neuroscience, 25(9), 1406-1417.
Do, K. T., Moreira, J. F. G., & Telzer, E. H. (2017). But is helping you worth the risk? Defining prosocial risk taking in adolescence. Developmental Cognitive Neuroscience, 25, 260-271.
Duell, N., Steinberg, L., Icenogle, G., Chein, J., Chaudhary, N., Di Giunta, L., ... & Pastorelli, C. (2018). Age patterns in risk taking across the world. Journal of Youth and
Adolescence, 47(5), 1052-1072.
Ernst, M., Pine, D. S., & Hardin, M. (2006). Triadic model of the neurobiology of motivated behavior in adolescence. Psychological Medicine, 36(3), 299-312.
Falk, E. B., Berkman, E. T., & Lieberman, M. D. (2012). From neural responses to population behavior: Neural focus group predicts population-level media effects. Psychological Science, 23(5), 439-445.
Falk, E. B., Cascio, C. N., O'Donnell, M. B., Carp, J., Tinney Jr, F. J., Bingham, C. R., ... & Simons-Morton, B. G. (2014). Neural responses to exclusion predict susceptibility to social influence. Journal of Adolescent Health, 54(5), S22-S31.
Galvan, A., Hare, T. A., Parra, C. E., Penn, J., Voss, H., Glover, G., & Casey, B. J. (2006). Earlier development of the accumbens relative to orbitofrontal cortex might underlie
risk-taking behavior in adolescents. Journal of Neuroscience, 26(25), 6885-6892.
Galvan, A., Hare, T., Voss, H., Glover, G., & Casey, B. J. (2007). Risk‐taking and the adolescent brain: Who is at risk?. Developmental Science, 10(2), F8-F14.
Gardner, M., & Steinberg, L. (2005). Peer influence on risk taking, risk preference, and risky decision making in adolescence and adulthood: An experimental study. Developmental Psychology, 41(4), 625.
Geier, C. F. (2013). Adolescent cognitive control and reward processing: Implications for risk taking and substance use. Hormones and Behavior, 64(2), 333-342.
Greenberg, M. T., Siegel, J. M., & Leitch, C. J. (1983). The nature and importance of attachment relationships to parents and peers during adolescence. Journal of Youth and
Adolescence, 12(5), 373-386.
Lebel, C., & Beaulieu, C. (2011). Longitudinal development of human brain wiring continues from childhood into adulthood. Journal of Neuroscience, 31(30), 10937-10947. Lejuez, C. W., Read, J. P., Kahler, C. W., Richards, J. B., Ramsey, S. E., Stuart, G. L., ... &
Brown, R. A. (2002). Evaluation of a behavioral measure of risk taking: The Balloon Analogue Risk Task (BART). Journal of Experimental Psychology: Applied, 8(2), 75-84. Pfeifer, J. H., Masten, C. L., Moore III, W. E., Oswald, T. M., Mazziotta, J. C., Iacoboni, M., &
Dapretto, M. (2011). Entering adolescence: Resistance to peer influence, risky behavior, and neural changes in emotion reactivity. Neuron, 69(5), 1029-1036.
Powers, K. E., Yaffe, G., Hartley, C. A., Davidow, J. Y., Kober, H., & Somerville, L. H. (2018). Consequences for peers differentially bias computations about risk across development. Journal of Experimental Psychology: General, 147(5), 671-682.
changes in prefrontal cortex activation underlie declines in adolescent risk taking. Journal of Neuroscience, 35(32), 11308-11314.
Sebastian, C. L., Tan, G. C., Roiser, J. P., Viding, E., Dumontheil, I., & Blakemore, S. J. (2011). Developmental influences on the neural bases of responses to social rejection:
Implications of social neuroscience for education. Neuroimage, 57(3), 686-694.
Sherman, L., Steinberg, L., & Chein, J. (2017). Connecting brain responsivity and real-world risk taking: Strengths and limitations of current methodological approaches. Developmental Cognitive Neuroscience, 33, 27-41
Steinberg, L. (2008). A social neuroscience perspective on adolescent risk-taking. Developmental Review, 28(1), 78-106.
Telzer, E. H., Van Hoorn, J., Rogers, C. R., & Do, K. T. (2018). Social influence on positive youth development: A developmental neuroscience perspective. In Advances in Child Development and Behavior (Vol. 54, pp. 215-258). JAI.
Turner, C. F., Ku, L., Rogers, S. M., Lindberg, L. D., Pleck, J. H., & Sonenstein, F. L. (1998). Adolescent sexual behavior, drug use, and violence: increased reporting with computer survey technology. Science, 280(5365), 867-873.
van Hoorn, J., van Dijk, E., Meuwese, R., Rieffe, C., & Crone, E. A. (2016). Peer influence on prosocial behavior in adolescence. Journal of Research on Adolescence, 26(1), 90-100. van Hoorn, J., Crone, E. A., & Van Leijenhorst, L. (2017). Hanging out with the right crowd:
Peer influence on risk‐taking behavior in adolescence. Journal of Research on Adolescence, 27(1), 189-200.
Willoughby, T., Good, M., Adachi, P. J., Hamza, C., & Tavernier, R. (2013). Examining the link between adolescent brain development and risk taking from a social–developmental
perspective. Brain and Cognition, 83(3), 315-323.
Wolburg, J. M. (2001). The “risky business” of binge drinking among college students: Using risk models for PSAs and anti-drinking campaigns. Journal of Advertising, 30(4), 23-39.
Table 1
Behavioral Logistic Regression Models
Wave 1
Variables in the Equation b (SE) OR
Model 1 Average Pumps PSRT-SFRT -1.12 (.56)* .33
Wave 2
Variables in the Equation b (SE) OR
Model 1 Average Pumps PSRT-SFRT 1.19 (.7) 3.28
Binge Drinking (Wave 1) 4.73 (1.41)*** 113.78
Table 2
Correlations between Study Variables
1 2 3 4 5 6 7 8 9 10 11 12 13 14 1. dlPFC PSRT -- 2. dlPFC SFRT .5** -- 3. VS PSRT .03 .05 -- 4. VS SFRT -.2 .11 .34* -- 5. TPJ PSRT .86** .5** .02 -.13 -- 6. TPJ SFRT .61** .87** -.02 .09 .56** -- 7. mPFC PSRT .54** .25 .21 -.02 .77** .25 -- 8. mPFC SFRT .31 .51** .07 .38* .38* .64** .23 -- 9. dlPFC PSRT-SFRT -.46** .54** .02 .31 -.32* .3 -.27 .23 -- 10. VS PSRT-SFRT -.19 .04 -.69** .45** -.12 .09 -.22 .23 .23 -- 11. TPJ PSRT-SFRT -.44** .22 -.05 .23 -.65** .27 -.66** .15 .65** .23 -- 12. mPFC PSRT-SFRT -.24 .16 -.14 .3 -.38* .26 -.7** .54** .4* .36* .68** -- 13. Binge Drinking (W1) .19 .19 -.03 .12 .23 .23 .19 .27 .01 .12 -.06 .04 -- 14. Binge Drinking (W2) -.07 -.09 .09 .31 -.01 -.14 .09 .16 -.01 .15 -.13 .05 .71** -- M -.16 -.13 .14 .12 -.21 -.2 -.08 -.17 .04 -.02 .01 -.09 .58 .63 SD .21 .22 .20 .16 .26 .2 .24 .19 .21 .21 .21 .27 .5 .49 *p<.05, **p<.01, ***p<.001
Table 3
Brain-as-Predictor Logistic Regression Models
Wave 1
Variables in the Equation b (SE) OR
Model 1 dlPFC PSRT-SFRT .14 (1.55) 1.15
Model 2 VS PSRT-SFRT 1.2 (1.55) 3.32
Model 3 TPJ PSRT-SFRT -.54 (1.53) .59
Model 4 mPFC PSRT-SFRT .26 (1.17) 1.29
Wave 2
Variables in the Equation b (SE) OR
Model 1 dlPFC PSRT-SFRT .81 (2.4) 2.24
Binge Drinking (Wave 1) 3.6 (1.01)*** 36.52
Model 2 VS PSRT-SFRT 1.69 (2.39) 5.39
Binge Drinking (Wave 1) 3.57 (1.01)*** 35.44
Model 3 TPJ PSRT-SFRT -1.93 (2.84) .15
Binge Drinking (Wave 1) 3.58 (1.01)*** 35.9
Model 4 mPFC PSRT-SFRT .59 (1.8) 1.8
Binge Drinking (Wave 1) 3.56 (.99)*** 35.24
Figure 1. Schematic representation of the fMRI risk-taking task. (A) Depicts sequence of task events. During each trial of the risk-taking task, participants viewed a balloon and had the option to pump the balloon or cash out. A cash out decision allows the participant to save any points gained thus far on that balloon. After pumping the balloon a variable number of times, the balloon may explode unless the participant chooses to cash out. The participant loses all points gained if the balloon explodes. (B) Shows the two conditions of interest. During the prosocial risk-taking condition, the participant’s best friend could win money given a cash out and the participant could lose money given an explosion event. During the self-focused risk-taking condition, both outcomes impact the participant. The balloons are different colors to aid the participants in distinguishing between the conditions.
Figure 2. Depicts brain activation in each of the 4 a priori regions of interest (dlPFC, VS, TPJ, and mPFC) by trial type (PSRT vs SFRT). Note that the y-axis represents the linear relationship between average brain activation and the level of risk throughout the task. Risk increases as the participant continues to pump up the balloon; that is, the sixth pump that the participant chooses to make is riskier than the fourth pump because the balloon is increasingly close to the random explosion threshold. (A) Brain activation in the dlPFC is not significantly different in the PSRT and SFRT conditions. (B) Brain activation in the VS is not significantly different in the PSRT and SFRT conditions. (C) Brain activation in the VS is not significantly different between the PSRT and SFRT conditions. (D) Brain activation in the mPFC is significantly different in the PSRT and SFRT conditions. The mPFC is significantly less deactivated in response to increasingly risky choices that might benefit the best friend. R=Right; L=Left.