K. Vidal, A. Larra˜naga, A. Mor´an-Ruiz, M.A. Laguna-Bercero, R.T. Baker, M.I. Arriortua
PII: S0032-5910(17)30742-8
DOI: doi:10.1016/j.powtec.2017.09.020 Reference: PTEC 12825
To appear in: Powder Technology Received date: 16 May 2017 Revised date: 30 August 2017 Accepted date: 6 September 2017
Please cite this article as: K. Vidal, A. Larra˜naga, A. Mor´an-Ruiz, M.A. Laguna-Bercero, R.T. Baker, M.I. Arriortua, Effect of the synthesis conditions on the properties of La0.15Sm0.35Sr0.08Ba0.42FeO3 − δ cathode material for SOFCs, Powder Technology
(2017), doi:10.1016/j.powtec.2017.09.020
ACCEPTED MANUSCRIPT
Effect of the synthesis conditions on the properties of
La
0.15Sm
0.35Sr
0.08Ba
0.42FeO
3-cathode material for SOFCs
K. Vidala,*, A. Larrañagaa, A. Morán-Ruiza, M.A. Laguna-Bercerob, R.T. Bakerc
and M.I. Arriortuaa,*
aUniversidad del País Vasco (UPV/EHU), Facultad de Ciencia y Tecnología, Barrio
Sarriena S/N, 48940 Leioa, Vizcaya, Spain.
b CSIC-Universidad de Zaragoza, Instituto de Ciencia de Materiales de Aragón (ICMA),
Pedro Cerbuna 12, 50009 Zaragoza, Spain.
c EaStChem, School of Chemistry, University of St Andrews, St Andrews, Fife KY16
9ST, Scotland, United Kingdom.
Abstract:
The perovskite La0.15Sm0.35Sr0.08Ba0.42FeO3- has been prepared by the glycine nitrate
(GNC) route, varying the fuel/oxidizer ratio (glycine/nitrate, G/N= 1 and 2) and cooling
rate (slow cooling and air-quenched), in order to study the influence of sample
preparation on the materials’ properties, in the context of their application as a cathode
material for SOFCs. For this, the performance of the prepared mixed ion and electron
conducting perovskite oxides is dictated by their structure, oxygen stoichiometry (3-δ),
chemical composition and thermal expansion properties. High-resolution Synchrotron
X-ray powder diffraction patterns were collected at room temperature and at 700 and
800ºC. It was found that the materials had a cubic crystal structure at these
temperatures. As expected, 3-δ decreased as temperature increased, and was slightly
smaller for the quenched sample. Higher electrical conductivity values were obtained
for the sample with G/N = 1 (air-quenched) in the cooling rate. At 700 and 800°C the
ACCEPTED MANUSCRIPT
resistance values in impedance spectroscopy studies. Therefore, the physicochemical
and electrochemical characterization clearly demonstrated the influence of the synthetic
conditions on the cathode performance.
Keywords: Chemical synthesis; Oxygen content; Cathode material; SOFC; Impedance Spectroscopy.
______________________________________
* Corresponding Author: Karmele Vidal and María Isabel Arriortua e-mail: [email protected] and [email protected]
ACCEPTED MANUSCRIPT
1. IntroductionMajor obstacles to the commercialisation of solid oxide fuel cells are the limited
long-term stability and high production costs. Both are related to the high operating
temperatures of SOFC systems. The reason why high temperatures are nevertheless
required is the general sluggishness of the kinetics of the elementary processes
involved, most of which are thermally activated. A prominent example is the oxygen
reduction reaction at the cathode, which is often the main limiting factor to the
performance of the whole SOFC system [1]. One important goal in SOFC research is
therefore the search for cathode materials which offer a sufficient electrochemical
performance at intermediate temperatures (500-750ºC). One strategy to improve the
cathode performance below 800ºC is to use mixed ionic-electronic conductors (MIECs)
such as (A1-xSrx)(B)O3- (with A = Ba or La; B = Mn, Fe or Co). The possibility to
transport oxygen ions and electrons through a single-phase material would extend the
number of active sites for the oxygen reduction reaction (ORR) and enhance the cathode
performance [2]. This doping strategy has been extensively applied to tailor the
properties of perovskite oxides for various functional applications, including oxygen
reduction electrodes for SOFCs [3].
Synthesis procedure and conditions can strongly affect the properties of perovskites,
in particular of doped perovskites. Wet-chemical solution-combustion synthesis is an
effective and economical approach [4]. The exothermicity of the reaction, which
influences the powder characteristics such as crystallite size, surface area, phase purity
and the nature of agglomeration, can be changed by varying the fuel to oxidant ratio
and/or employing different fuels [5].
The simplest approach to account for variations of physical properties with A-site
ACCEPTED MANUSCRIPT
hard sphere cations over the A type sites. This has traditionally been parameterised
through the average A cation radius <rA>, often expressed as the Goldschmidt tolerance
factor t= (<rA>+rO) /√2(rB+rO) [6], where rB and rO are the B-site cation and oxide ion
radii, respectively. A strong <rA> dependence of the electrochemical properties has been
reported [7-9]. However, it was subsequently shown that a general description requires
the use of an additional parameter, the A cation size disorder, which takes into account
the inherent disorder due to the size mismatch between different cations occupying the
A-site. This parameter has been quantified as the variance of the A cation radius distribution, σ2(r
A)=<rA2 >-<rA>2 [10].
Our group has studied the effect of this last parameter by impedance spectroscopy
and a significant decrease in polarization resistance (Rp) with the application of the
current was observed for a perovskite compound with a high value of σ2(rA) [11,12].
It is well known that the performance of MIEC perovskite oxides is dictated by the
structure, oxygen non-stoichiometry (δ), chemical composition and thermal expansion
properties. In order to be able to track the oxygen vacancies with temperature,
high-resolution Synchrotron X-ray powder diffraction (SXRPD) or neutron diffraction
patterns are required.
Considering these objectives, this work focused on the synthesis of different
La0.15Sm0.35Sr0.08Ba0.42FeO3-compositions phases with high values of A cation size
disorder (σ2(rA)= 0.0231 Å2) obtained varying the fuel/oxidizer ratio and the cooling
rate. The resulting compounds were characterized by X-ray powder diffraction (XRD),
inductively coupled plasma atomic emission spectroscopy (ICP-AES), high-resolution
Synchrotron X-ray powder diffraction (SXRPD), scanning electron microscopy (SEM),
particle size distribution, electrical conductivity, I–V measurements and impedance
ACCEPTED MANUSCRIPT
2. Experimental2.1. Powder preparation
La0.15Sm0.35Sr0.08Ba0.42FeO3- samples were prepared by the glycine nitrate
combustion (GNC) process, a self-combustion technique that uses glycine as fuel and
nitrates of the metal components as oxidants.
The synthesis of the samples was performed using La(NO3)3.6H2O (>99%),
Sm(NO3)3.6H2O (>99%), Sr(NO3)2. (>99.99%), Ba(NO3)2 (>99.995%), Fe(NO3)2.9H2O
(98.5%) and glycine (>99%), all from Aldrich. The reagents were dissolved in distilled
water and mixed in a 1 litre glass beaker, which was placed on a hot plate, under
constant stirring, to evaporate excess water. The resulting viscous liquid started
autoignition just after the glass beaker was placed directly onto a hotplate preheated at
450°C. The resulting powders were pelletized and calcined in air at 850, 1050 and
1250ºC for 10 h at each temperature to obtain the pure samples. Two samples were
synthesised: one with the molar fuel/oxidizer ratio, G/N = 1 and a second with G/N=2.
In addition, after the calcination at 1250ºC the first sample was cooled rapidly by
air-quenching (at about 50ºC/min) and the second was cooled slowly (at 3ºC/min).
2.2. Characterization techniques
The structural analysis was performed using laboratory X-ray diffraction (XRD).
Data were collected at room temperature (r.t.) using a Philips X'Pert-PRO X-ray
diffractometer with secondary beam graphite monochromated Cu–K radiation, from
2θ 15 to 90°, with a step size of 0.026° and 10 s per step. The crystal structures were
refined by the Rietveld method [13] using the GSAS software package [14].
Compositional analysis was performed on the prepared samples to confirm that the
ACCEPTED MANUSCRIPT
inductively coupled plasma atomic emission spectroscopy (ICP-AES) on a Horiba
Yobin Yvon Activa spectrophotometer.
For both samples, in situ synchrotron powder diffraction data (ALBA, BL04-MSPD,
the Spanish Synchrotron Radiation Facility, Barcelona) were collected in
Debye-Scherrer (transmission) mode with a wavelength of 0.35 Å from room temperature up to
800 ºC in air. In addition, for the quenched sample, data were recorded during
subsequent cooling to room temperature. The data acquisition time was ~2.5 h per
pattern and this allowed a very good signal-to-noise ratio to be obtained over the
angular range 2θ = 20-40°. SXRPD patterns were analysed using the Rietveld
methodology as implemented in the GSAS software package.
The total electrical conductivity was measured in air from room temperature to
950°C using a heating rate of 3°C/min in air by applying a current of 0, 10, 50 and 100
mA using the four-point method on sintered rectangular bars of both perovskite
samples. Electrical contacts were made using Pt wires and Pt paste placed over whole
end faces ensuring a homogeneous current flow. The conductivity (σ) was determined
from a set of V–I values by taking σ=1/ρ=L/A×dI/dV, where L is the distance between
voltage contacts and A is the sample cross section.
Prior to cell fabrication for the electrochemical tests, the compounds were ball milled
under identical conditions for 24 h and particle sizes were measured using a Malvern
Mastersizer X particle size analyser.
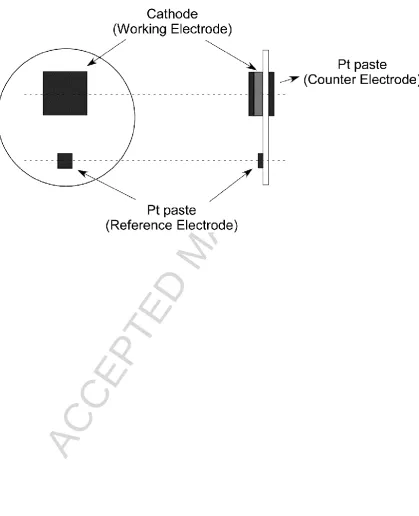
The impedance spectra were obtained using three-electrode configuration cells
(Figure 1). The powders used as the working electrode were deposited on yttria
ACCEPTED MANUSCRIPT
colloidal spraying (a total active area of 1 cm2) followed by sintering at 1050°C for 2 h.
Pt paste and mesh (Heraeus) were employed as the counter and the reference electrode.
(Figure 1)
The Pt reference electrode was painted on the same side as the working electrode,
and care was taken to leave as large a distance as possible between the reference and
working electrodes in order to minimize systematic errors in the measurement of the
electrochemical characteristics. A Pt counter-electrode, having the same shape and
position as the working electrode, was painted on the opposite side of the electrolyte
pellet. Reference and counter electrodes were fixed to the electrolyte using a sintering
treatment at 950ºC for 30 min.
AC impedance spectra were obtained using a Solartron 1260 Frequency Response
Analyzer coupled to a Solartron 1286 electrochemical interface, with an applied voltage
amplitude of 10 mV over a frequency range of 0.01 Hz to 1 MHz at measurement
temperatures of 700 and 800°C (typical operating temperatures for the application of
these materials in SOFC technology).
The morphologies of the powders and the sintered bars were examined using a
scanning electron microscope (JEOL JSM-7000F). Secondary electron images were
taken at 20 kV and 1.1.10−11 A.
3. Results and discussion
ACCEPTED MANUSCRIPT
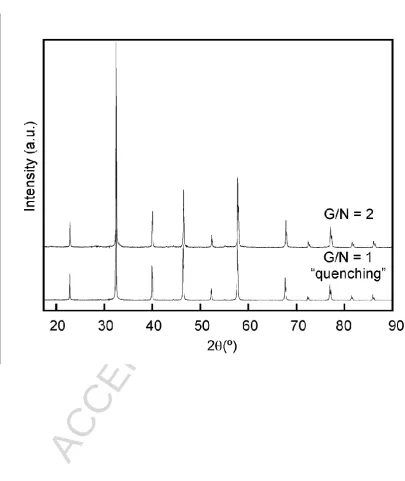
X-ray diffraction patterns collected for both La0.15Sm0.35Sr0.08Ba0.42FeO3- samples
are presented in Fig. 2 and showed that single-phase materials had been obtained
without impurities.
(Figure 2)
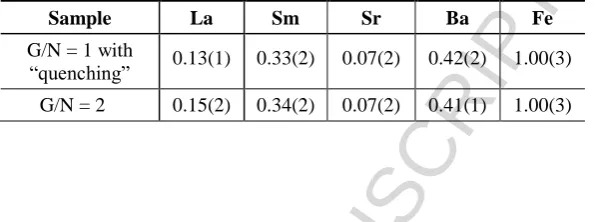
Results from chemical analyses of the prepared powers are presented in Table 1 and
show a good agreement with the expected nominal compositions.
(Table 1)
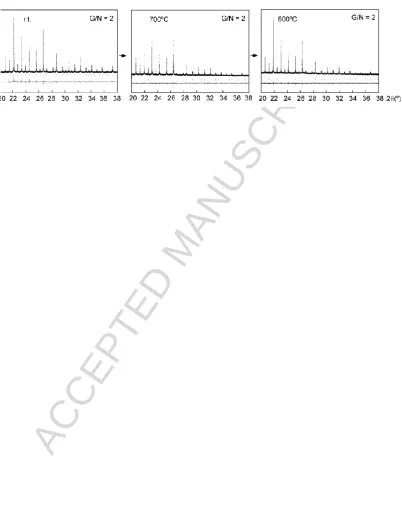
Figure 3 gives the raw SXRPD patterns, Rietveld fits and difference patterns for the
quenched sample with G/N = 1 at 30, 700 and 800ºC (heating), and then at 700 and
30ºC on cooling.
(Figure 3)
Figure 4 shows raw SXRPD patterns, Rietveld fits and difference patterns for the slow cooled sample with G/N = 2 at 30, 700 and 800ºC.
(Figure 4)
Over the whole temperature range studied (25-800ºC), the SXRPD patterns for both
samples were refined in a cubic symmetry (S.G: Pm-3m).
Final refined values of the structural parameters for the compounds are summarised
in Tables 2 and 3.
(Table 2)
ACCEPTED MANUSCRIPT
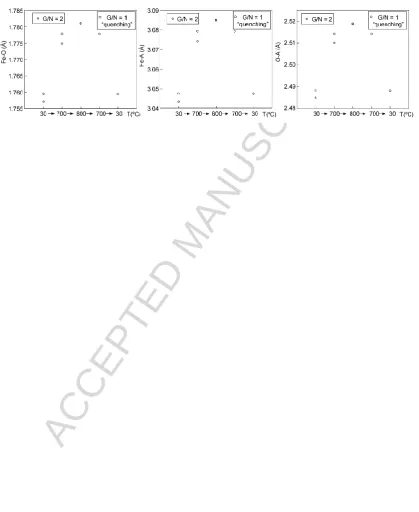
Figures 5 and 6 show the evolution of the cell parameters and cell volume, and the average Fe-O, Fe-A and A-O bond distances obtained from the SXRPD data as a function of temperature.
(Figure 5)
(Figure 6)
As observed, all of these parameters increased on increasing the temperature. For the
quenched sample, the structural parameters are slightly larger during heating than
during cooling. However, there is a significant difference in the cell parameters between
the samples prepared using different G/N ratios. At room temperature and 700ºC on
heating, the values for G/N=1 (quenched) are significantly higher than for G/N=2
(slow-cooled), although they became very similar at 800ºC.
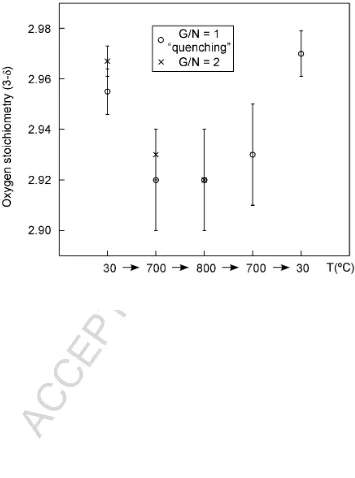
Figure 7 shows the oxygen stoichiometry for the samples determined from the
structural refinements.
(Figure 7)
Setting aside the expected general thermal lattice expansion caused by increasing the
temperature, the larger additional expansion observed for the G/N=1 (quenched) sample
at r.t. and at 700°C on heating than in the subsequent cooling regime could be explained
by the lower oxygen occupancy of the former (see Figure 7), which would lead to
stronger repulsion between neighbouring cations and/or to an increased tendency to
form the larger iron cation [15-17], Fe3+ (ionic radii are: Fe3+(VI)= 0.645 Å; Fe4+(VI)=
0.585 Å) [18]. Heating at 800°C allowed the oxygen occupancy to increase (equilibrate)
and caused the lattice expansion at 700°C and r.t. to be smaller on cooling than on
ACCEPTED MANUSCRIPT
The smaller structural parameters for the sample with G/N = 2, could be explained
because an increase of the fuel/oxidant ratio gives rise to changes in the perovskite
structure, varying the oxygen vacancy concentration. This phenomenon was reported to
result in a decrease in mean ionic radius of the B site ions (formation of Fe4+ cations)
[19]. It is interesting that oxygen occupancy values for the two materials – like the other
structural parameters – become very similar at 800ºC and this is attributed to the
equilibration of oxygen vacancy concentration in both samples at this temperature.
3.2. Morphological study
Representative SEM micrographs of the powder samples synthesised by the glycine
nitrate combustion method under the two conditions are shown in Figure 8. As
observed, no significant differences can be seen in the morphology or the average
particle size of the two samples in these images. Both samples are composed of
agglomerated sub-micron particles.
(Figure 8)
The aggregation rate is determined by the temperature generated during the
combustion reaction which is higher in the fuel-rich case. As has been reported in other
works, the agglomerates formed at lower G/N ratio are soft and could be easily split up,
while those at the higher ratio are hard and difficult to break into particles [5].
In Figure 9 the particle size distribution of unmilled and milled powders is shown.
ACCEPTED MANUSCRIPT
The largest peak just below 1 m is attributed to the presence of primary particles
while those at higher particle sizes indicate the presence of agglomerates in the
suspensions, in agreement with SEM observations. The G/N = 1 sample has a smaller
fraction of agglomerates than the G/N=2 sample and has an average diameter (d50) of
0.963 m compared to 1.685 m for G/N = 2. For both samples, the milling leads to a
substantial decrease in mean particle size and in the presence of agglomerates, the d50
values being 0.710 and 0.830 m for G/N = 1 and 2, respectively.
SEM micrographs taken of the surface of the sintered at 1250ºC bars are shown in
Figure 10.
(Figure 10)
The observed microstructures present similar morphology with grain sizes from ~ 0.6
to 1.7 µm.
An agglomerate is defined as a limited arrangement of primary particles, which
forms a network of interconnected pores. Weak agglomerates can be destroyed during
compaction at relatively low pressures, so that inter- and intra-agglomerate pores of the
same size with a narrow pore size distribution can be formed in such a powder. On the
contrary, powders consisting of hard agglomerates cannot be compacted to give such a
homogeneous pore size distribution which results in a decrease in sinterability [20].
In this work, this effect has been observed since relative densities of 88 and 83 % of
the theoretical value (obtained by XRD) were obtained for the samples using G/N = 1
and 2, respectively. These results are in good agreement with the particle size
distribution curves which show that fewer agglomerates were formed for G/N = 1 than
ACCEPTED MANUSCRIPT
3.3. Electrical conductivity studyThe total electrical conductivity measured by the four-point method as a function of
temperature is shown in Figure 11 for the samples. As can be seen, the electrical
conductivity of each specimen increased with increasing temperature up to a maximum
value (at Tmax) and then decreased. This indicates a transition in electrical conduction
from (p-type) semiconducting to metallic, typical of perovskite-type mixed conductors
[21]. The conductivity of the samples can be described by the small polaron
conductivity model. In this model, the electronic conductivity is a result of the hopping
of electrons from the occupied sites, Fe3+ ions, to the unoccupied sites, Fe4+ ions
(electronic hole charge carriers in p-type semiconductors) [22]. It can be assumed that
the behavior at low temperatures (where ~0) reflects a thermally activated conduction
mechanism and the electrical conductivity increases due to the increasing mobility of
the electronic charge carriers. At high temperatures, the electronic conductivity is
affected by the decrease in the number of p-type charge carriers due to progressive
formation of oxygen vacancies [23,24].
(Figure 11)
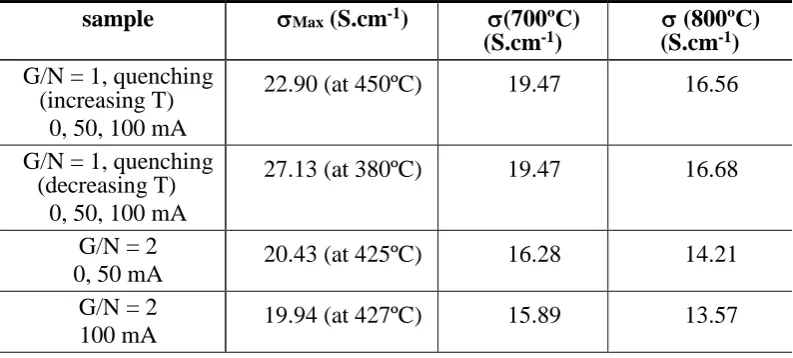
The electrical conductivity values obtained at 700 and 800ºC (typical operating
temperatures for the application of these materials in SOFC technology) by applying a
current of 0, 10, 50 and 100 mA for the compounds are given in Table 4.
ACCEPTED MANUSCRIPT
The electrical conductivities obtained are comparable with those previously reported
for this type of perovskite material with high σ2(rA) values [7,11]. However, in this
study, a slight decrease in electrical conductivity was observed for the sample with G/N
= 2 when a current of 100 mA was applied. This is an interesting phenomenon that we
have not found to be reported in the literature for similar compounds on varying the fuel
to oxidant ratio in the synthesis procedure.
For the values obtained it can be concluded that the preparation route has an
important influence on the electrical properties of these materials. The highest electrical
conductivity was obtained for the sample with G/N = 1 during cooling. This behavior
can be attributed to two factors: first, to the lower oxygen vacancy concentration on
cooling than on heating (for the quenched sample) and applying a current of 100 mA
(for the sampled with G/N = 2), given that, at high concentrations, oxygen vacancies
can act as electron traps, decreasing the mobility of the carriers and so decreasing the
electrical conductivity [25]; and secondly to the higher relative density for G/N = 1 than
G/N = 2.
3.4. Electrochemical characterization
Electrochemical cells with the configuration La0.15Sm0.35Sr0.08Ba0.42FeO3-/YSZ/Pt
were investigated using Impedance Spectroscopy (IS) under open circuit conditions and
applying a cathodic current of 50 and 75 mA. The measurements were carried out in air
at 700 and 800ºC during the heating step for both samples and at 700ºC during the
cooling step for the quenched sample.
The typical Nyquist plots obtained for the samples are shown in Figure 12. The best
fitting results were achieved with an equivalent circuit of Rohm(RHFCPEHF)(RLFCPELF)
ACCEPTED MANUSCRIPT
assigned to the high (HF) and low (LF) frequency arcs - are active; the oxygen
reduction reaction at the electrode interface involves at least two different processes. In
this equivalent circuit, Rohm, is the overall ohmic resistance (including the electrolyte
resistance and the resistance of the lead wires) which has been subtracted for clarity of
the Nyquist plots; RHF and RLF are the polarization resistances of the high frequency and
low frequency arcs (attributed to the polarization resistance, RP, of the cathode
reaction), respectively; and CPEHF and CPELF are the corresponding constant phase
elements.
(Figure 12)
The RHF is attributed to the charge transfer processes involving oxygen ions at the
electrode/electrolyte interface, and RLF is related to the oxygen species
adsorption-dissociation and diffusion phenomena on the electrode [26].
In Table 5 are reported the capacitance values for the electrode processes and the total
polarization resistance (Rp = RHF + RLF) for both samples. The lower value of the
capacitance CHF (~10-4 F.cm-2) indicates that this process is related to oxygen ion
transfer and electronic processes, and the larger value of the capacitance CLF (~10-2
F.cm-2) can be related to molecular oxygen dissociation and diffusion process [27].
(Table 5)
It is observed that Rp decreases when increasing the temperature and is much smaller
for the sample with G/N = 1. For this sample, it was also observed that Rp is slightly
smaller on increasing (than on decreasing) the temperature, since the sample presents
ACCEPTED MANUSCRIPT
that it is beneficial to apply “quenching” in the preparation of the cathode material in
order to get lower Rp values.
The cross-sectional microstructures have been studied by SEM, showing similar
microstructures and grain sizes. However, as shown above, the particles are more
agglomerated in the sample with G/N=2 than for the G/N=1 one (Figure 9). This effect
may have worsened the behaviour of the former sample, given that increased
agglomeration would decrease the specific electrochemical surface area and the surface
area available for adsorption/desorption processes, which, in turn, would increase Rp.
As have been studied for similar compositions with high values of σ2(r
A) [11,12], the
Rp values are very sensitive to changes in applied currents. Figure 13 shows the typical
Nyquist diagram of the impedance spectroscopy for Samples with G/N = 1 and 2 at
800°C at OCP and under a current of 50 and 100 mA. The Warburg impedance (W1) in
the equivalent circuit is related to the resistance of oxygen adsorption/decomposition
and the oxygen ions diffusion in the cathode.
(Figure 13)
Table 6 shows the resistance and capacitance values at high and low frequency for the
samples at 800ºC at OCP and under a current of 50 and 100 mA.
(Table 6)
It is interesting that a significant decrease in Rp is observed for both samples when
applying a cathodic current, the decrease being greater for the cathode with G/N = 2, so
ACCEPTED MANUSCRIPT
agreement with results obtained from conductivity measurements, showing a greater
influence of the applied current on the electrochemical measurements for the cathode
with G/N = 2.
To our knowledge, this is the first time that such an effect of the G/N value has
resulted in significant cathode activation under different applied currents.
4. Conclusions
La0.15Sm0.35Sr0.08Ba0.42FeO3- compounds have been obtained using a glycine-nitrate
method by varying the fuel/oxidizer ratio (G/N = 1 and 2) and changing the cooling rate
for the sample with G/N = 1 in order to study the effect of these factors on the
structural, morphological and electrical properties of the materials. The SXRPD patterns
for both samples, over the whole temperature range studied (30-800ºC), show cubic
symmetry (S.G: Pm-3m). On cooling, the compound with a stoichiometric ratio (G/N =
1) value presented the highest values of electrical conductivity in the cooling step and
showed the lowest value of Rp in the heating step in impedance measurements. When a
current is applied, a significant decrease of this resistance is observed for the sample
with G/N = 2. The Rp of the quenched sample with G/N = 1 showed less decrease of the
polarization when applying current remaining similar than for the unquenched sample.
Therefore, it can be concluded that the glycine-nitrate process, with a G/N ratio of 1 and applying “quenching”, is a more appropriate technique for preparing a promising
candidate cathode for IT-SOFC applications.
Acknowledgements
This research has been funded by the Ministerio de Economía, Industria y
ACCEPTED MANUSCRIPT
Departamento de Educación of the Basque Government (IT-630-13). The authors thank
SGIker of UPV/EHU for technical and personnel support. This work was benefited
from the BL04-MSPD beamline at ALBA. The authors thank Dr. Francois Fauth of the
Experiments Division of ALBA for his assistance in situ synchrotron measurements. K.
ACCEPTED MANUSCRIPT
5. References[1] A.V. Berenov, A. Atkinson, J.A. Kilner, E. Bucher, W. Sitte, Oxygen tracer
diffusion and surface exchange kinetics in La0.6Sr0.4CoO3-δ, Solid State Ionics 181
(2010) 819-826.
[2] S. Vazquez, L. Suescun, R. Faccio, Effect of Cu doping on Ba0.5Sr0.5Fe1-xCuxO3-δ
perovskites for solid oxide fuel cells: A first-principles study, J. Power Sources 311
(2016) 13-20.
[3] Y. Chen, B. Qian, Z. Shao, Tin and iron co-doping strategy for developing active
and stable oxygen reduction catalysts from SrCoO3-δ for operating below 800°C, J.
Power Sources 294 (2015) 339-346.[4] A. Bedon, M.M. Natile, A. Glisenti, On the
synthesis and stability of La0.6Sr0.4Ga0.3Fe0.7O3, J. Eur. Ceram. Soc. 37 (2017)
1049-1058.
[5] A.P. Jamale, S. Shanmugam, C.H. Bhosale, L.D. Jadhav, Physicochemical
properties of combustion synthesized La0.6Sr0.4Co0.8Fe0.2O3-δ perovskite: A role of
fuel to oxidant ratio, Mat. Sci. Semicon. Proc. 40 (2015) 855-860.
[6] V.M. Goldschmidt, Skr. Norsk. Videnk.-Akad, Geochemische Verteilungsgesetze
der Elemente, Mat. Nat. Kl. 2 (1926) and 8 (1927).
[7] A. Ecija, K. Vidal, A. Larrañaga, A. Martínez-Amesti, L. Ortega-San-Martín, M.I.
Arriortua, Characterization of Ln0.5M0.5FeO3-δ (Ln = La, Nd, Sm; M = Ba, Sr)
perovskites as SOFC cathodes, Solid State Ionics 201 (2011) 35-41.
[8] X. Ding, X. Gao, W. Zhu, J. Wang, J. Jiang, Electrode redox properties of
Ba1-xLaxFeO3-δ as cobalt free cathode materials for intermediate-temperature
SOFCs, Int. J. Hydrog. Energ. 39 (2014) 12092-12100.
[9] K. Vidal, L. M. Rodríguez-Martínez, L. Ortega-San-Martín, M. L. Nó, T. Rojo, M.
ACCEPTED MANUSCRIPT
of mean radius of the A-Site cations, J. Electrochem. Soc. 157 (8) A919-A924
(2010).
[10] L.M. Rodríguez-Martínez, J.P. Attfield, Cation disorder and size effects in
magnetoresistive manganese oxide perovskites, Phys. Rev. B. 54 (2002)
R15622-R15625.
[11] K. Vidal, L.M. Martínez, L. Ortega-San-Martín, M.L. Nó, T. Rojo, M.I. Arriortua,
Effect of the A cation size disorder on the properties of an iron perovskite series for
their use as cathodes for SOFCs, Fuel Cells 11 (2011) 51-58.
[12] A. Ecija, K. Vidal, A. Larrañaga, A. Martínez-Amesti, L. Ortega-San-Martín , M.I.
Arriortua, Structure and properties of perovskites for SOFC cathodes as a function
of the A-site cation size disorder, Solid State Ionics 235 (2013) 14-21.
[13] J. Rodrıguez-Carvajal, FULLPROF Rietveld pattern matching analysis of powder
patterns, Grenoble, 2011.
[14] A.C. Larson, R.B. Von Dreele, GSAS: general structure analysis system, LAUR;
1994.
[15] E. Lay, M. Benamira, C. Pirovano, G. Gauthier, L. Dessemond, Effect of
Ce-doping on the electrical and electrocatalytical behavior of La/Sr chromo-manganite
perovskite as new SOFC anode, Fuel Cells 12 (2012) 265-274.
[16] Y. Sun, N. Yan, J. Li, H. Wu, J.L. Luo, K.T. Chuang, The effect of calcination
temperature on the electrochemical properties of La0.3Sr0.7Fe0.7Cr0.3O3-x (LSFC)
perovskite oxide anode of solid oxide fuel cells (SOFCs). Sustain. Energy Technol.
Assess. 8 (2014) 92-98.
[17] L. Ge, Z. Zhu, Z. Shao, S. Wang, S. Liu, Effects of preparation methods on the
oxygen nonstoichiometry, B-site cation valences and catalytic efficiency of
ACCEPTED MANUSCRIPT
[18] R. D. Shannon, Revised effective ionic radii and systematic studies of interatomic
distances in halides and calcogenides, Acta Cryst. A32 (1976) 751-767.
[19] F. Deganello, G. Marcí, G. Deganello, Citrate-nitrate auto-combustion synthesis of
perovskite-type nanopowders: A systematic approach, J. Eur. Ceram. Soc. 29 (2009)
439-450.
[20] J. Majling, P. Znasik, V. Khandl, S. Komarneni, Porosimeter as a means to
measure the compatibility of powders, J. Am. Ceram. Soc. 77 (1994) 1369-1371.
[21] L.W. Tai, M.M. Nasrallah, H.U. Anderson, D.M. Sparlin, S.R. Sehlin, Structure
and electrical properties of La1-xSrxCo1-yFeyO3. Part 1. The system
La0.8Sr0.2Co1-yFeyO3, Solid State Ionics, 76 (1995) 259-271.
[22] P.A. Cox, The electronic structure and chemistry of solids, oxford science
Publications, Oxford, UK, 1987.
[23] E. Bucher, W. Sitte, Defect chemical analysis of the electronic conductivity of
strontium-substituted lanthanum ferrite, Solid State Ionics 173 (2004) 23-28.
[24] M. Chen, S. Paulson, V. Thangadurai, V. Birss, Sr-rich chromium ferrites as
symmetrical solid oxide fuel cell electrodes, J. Power Sources 236 (2013) 68-79.
[25] H.H. Yu, X. Li, Z.G. Yuan, Synthesis and characterization hollow spherical
La0.7Sr0.2Ca0.1Co0.9Fe0.1O3- (LSCCT) for cathode of solid state oxide fuel cell
(SOFC), Metalurgija 22 (2016) 796-798.
[26] S.B. Alder, Limitations of charge-transfer models for mixed-conducting oxygen
electrodes, Solid State Ionics 135 (2000) 603-612.
[27] M.J. Escudero, A. Aguadero, J.A. Alonso, L. Daza, A kinetic study of oxygen
reduction reaction on La2NiO4 cathodes by means of impedance spectroscopy, J.
Electroanal. Chem. 611 (2007) 107-116.
ACCEPTED MANUSCRIPT
of LaM0.25Mn0.75O3-δ (M = Fe, Co, Ni, Cu) as promising cathode materials for
intermediate-temperature solid oxide fuel cells, Electrochim. Acta 169 (2015)
ACCEPTED MANUSCRIPT
Figure CaptionsFig. 1. Schematic diagram of three-electrode configuration on YSZ electrolyte pellet.
Fig. 2. X-ray diffraction patterns for La0.15Sm0.35Sr0.08Ba0.42FeO3- perovskites prepared
by the glycine nitrate combustion method under different synthetic conditions.
Fig. 3. Rietveld refinement of the SXRPD patterns of quenched sample with G/N = 1
during a heating and cooling cycle in air.
Fig. 4. Rietveld refinement of the SXRPD patterns for the slow-cooled sample with G/N
= 2 during heating in air at room temperature, 700 and 800ºC.
Fig. 5. Lattice parameters (a) and unit cell volumes (V) of La0.15Sm0.35Sr0.08Ba0.42FeO3-
samples at different temperatures (error bars are smaller than the used symbols).
Fig. 6. Average Fe-O, Fe-A and O-A bond distances for La0.15Sm0.35Sr0.08Ba0.42FeO3-
samples at different temperatures (error bars are smaller than the used symbols).
Fig. 7. Oxygen stoichiometry vs temperature of La0.15Sm0.35Sr0.08Ba0.42FeO3- samples.
Fig. 8. Micrographs of La0.15Sm0.35Sr0.08Ba0.42FeO3- perovskites obtained under two
synthetic conditions.
Fig. 9. Particle size distribution of samples before (left) and after (right) milling.
Fig. 10. SEM micrographs taken of the surface of the sintered bars.
Fig. 11. Conductivity dependence upon temperature for the perovskites measured in air.
Fig. 12. Impedance spectra of cathodes measured: (a) at 700ºC during the heating and
cooling steps for both samples and (b) at 800ºC for both samples.
Fig. 13. Impedance spectra of cathodes with: (a) G/N = 1 and (b) G/N = 2 measured at
ACCEPTED MANUSCRIPT
TablesTable 1. Summary of the stoichiometric compositions obtained from ICP analyses for
the perovskite products with nominal composition La0.15Sm0.35Sr0.08Ba0.42FeO3-.
Sample La Sm Sr Ba Fe
G/N = 1 with
“quenching” 0.13(1) 0.33(2) 0.07(2) 0.42(2) 1.00(3)
[image:24.595.151.450.156.267.2]G/N = 2 0.15(2) 0.34(2) 0.07(2) 0.41(1) 1.00(3)
Table 2. Structural parameters obtained by Rietveld refinement for ABO3 (A=
La0.15Sm0.35Sr0.08Ba0.42; B= Fe) perovskite sintered by glycine nitrate combustion
method with G/N = 1 at different temperatures.
T(ºC) 25 700 800 700 25
Symmetry Cubic Cubic Cubic Cubic Cubic
Space group Pm-3m Pm-3m Pm-3m Pm-3m Pm-3m
a (Å) 3.519103(3) 3.555759(5) 3.562199(6) 3.555754(5) 3.518974(9) V/Z (Å3) 43.581(1) 44.957(1) 45.202(1) 44.957(1) 43.576(1)
the.(g/cm3) 9.166 8.963 8.692 8.834 9.199
A x=y=z 0.5 0.5 0.5 0.5 0.5
Uiso(x100 Å2) 1.82(1) 3.30(2) 3.47(3) 3.25(2) 1.811(8)
Overall Smoccup. 0.349(3) 0.353(6) 0.343(7) 0.348(6) 0.350(3)
Overall Laoccup. 0.149(3) 0.153(6) 0.143(7) 0.148(6) 0.150(3)
Overall Sroccup 0.079(3) 0.083(6) 0.073(7) 0.078(6) 0.080(3)
Overall Baoccup 0.419(3) 0.423(6) 0.413(7) 0.418(6) 0.420(3)
B x=y=z 0 0 0 0 0
Uiso(x100 Å2) 1.18(1) 2.24(3) 2.42(4) 2.24(3) 1.18(1)
Overall Feoccup. 0.999(3) 1.003(6) 0.993(7) 0.997(6) 1.000(3)
O x 0.5 0.5 0.5 0.5 0.5
O y=z 0 0 0 0 0
Uiso(x100 Å2) 3.8(1) 5.5(1) 5.5(2) 5.4(1) 3.8 (1)
Overall Ooccup. 0.985(3) 0.973(6) 0.973(7) 0.977(6) 0.990 (3)
A-B (x12) (Å) 3.04763(1) 3.07938(1) 3.08495(1) 3.07937(1) 3.04752(1) A-O (x12) (Å) 2.48838(1) 2.51430(1) 2.51886(1) 2.51430(1) 2.48829(1) B-O (x6) (Å) 1.75955(1) 1.77788(1) 1.78110(1) 1.77788(1) 1.75949(1)
Rwp (%) 8.09 3.73 4.12 4.09 8.60
Rp (%) 6.53 3.52 4.14 4.08 7.11
ACCEPTED MANUSCRIPT
Table 3. Structural parameters obtained by Rietveld refinement for ABO3 (A=La0.15Sm0.35Sr0.08Ba0.42; B= Fe) perovskite sintered by glycine nitrate combustion
method with G/N = 2 at the temperatures indicated.
T(ºC) 25 700 800
Symmetry Cubic Cubic Cubic
Space group Pm-3m Pm-3m Pm-3m
a (Å) 3.51434(1) 3.549815(4) 3.562199(6) V/Z (Å3) 43.404(1) 44.732(1) 45.202(1)
the.(g/cm3) 9.205 8.990 8.787
A x=y=z 0.5 0.5 0.5
Uiso(x100 Å2) 1.800(7) 3.28(2) 3.49(3)
Overall Smoccup. 0.348(2) 0.352(5) 0.347(7)
Overall Laoccup. 0.148(2) 0.152(6) 0.147(7)
Overall Sroccup 0.078(2) 0.082(5) 0.077(7)
Overall Baoccup 0.418(2) 0.422(5) 0.417(7)
B x=y=z 0 0 0
Uiso(x100 Å2) 1.17(1) 2.17(3) 2.39 (4)
Overall Feoccup. 0.999(2) 1.002(5) 0.997(7)
O x 0.5 0.5 0.5
O y=z 0 0 0
Uiso(x100 Å2) 4.6 (1) 5.7(1) 5.6(1)
Overall Ooccup. 0.989(2) 0.975(5) 0.973(7)
A-B (x12) (Å) 3.04351(1) 3.07423(1) 3.08495(1) A-O (x12) (Å) 2.48501(1) 2.51010(1) 2.51886(1) B-O (x6) (Å) 1.75717(1) 1.77491(1) 1.78110(1)
Rwp (%) 6.78 3.29 4.56
Rp (%) 5.45 3.13 4.57
2 1.65 1.32 1.52
Table 4. Electrical conductivity values of La0.15Sm0.35Sr0.08Ba0.42FeO3- perovskites at
700 and 800ºC.
sample Max (S.cm-1) (700ºC)
(S.cm-1) (S.cm (800ºC) -1)
G/N = 1, quenching (increasing T)
0, 50, 100 mA
22.90 (at 450ºC) 19.47 16.56
G/N = 1, quenching (decreasing T)
0, 50, 100 mA
27.13 (at 380ºC) 19.47 16.68
G/N = 2
0, 50 mA 20.43 (at 425ºC) 16.28 14.21 G/N = 2
[image:25.595.91.488.580.759.2]ACCEPTED MANUSCRIPT
Table 5. High frequency, low frequency and total polarization resistances andcapacitances of the samples at 700 and 800ºC in air obtained by equivalent circuit fitting
of the impedance spectra.
Sample
700ºC 800ºC
RHF
(.cm2)
RLF
(.cm2)
RP
(.cm2)
RHF
(.cm2)
RLF
(.cm2)
RP
(.cm2)
G/N = 1, “quenching”
(increasing T) 6.89 6.42 13.31 1.35 0.95 2.30
G/N = 1, “quenching”
(decreasing T) 10.54 10.14 20.68
G/N = 2 (increasing T) 26.94 37.04 63.98 3.73 4.70 8.43
G/N = 2 (decreasing T) 28.37 40.21 68.58
Sample CHF
(F.cm2)
CLF
(F.cm2)
CHF
(F.cm2)
CLF
(F.cm2)
G/N = 1, “quenching”
(increasing T) 5.3.10
-5 1.6.10-3 4.9.10-5 1.8.10-3
G/N = 1, “quenching”
(decreasing T) 4.8.10
-5 1.9.10-3
G/N = 2 (increasing T) 6.1.10-5 1.2.10-3 6.2.10-5 1.3.10-3
G/N = 2 (decreasing T) 5.9.10-5 1.3.10-3
Table 6. Electrode resistances and capacitances of the samples at 800ºC in air obtained
by equivalent circuit fitting of the impedance spectra.
Resistance (.cm2) G/N = 1, “quenching”
G/N = 2
OCP 50 mA 100 mA OCP 50 mA 100 mA
RHF 1.35 1.12 0.80 3.73 1.26 0.68
RLF 0.95 3.45 3.52 4.70 3.12 3.12
RP 2.30 4.57 4.32 8.43 4.38 3.80
Capacitance (F.cm2) OCP 50 mA 100 mA OPC 50 mA 100 mA
CHF 4.9.10-5 4.5.10-4 1.5.10-4 6.2.10-5 4.5.10-4 9.3.10-4
[image:26.595.88.503.517.694.2]ACCEPTED MANUSCRIPT
HighlightsThe perovskite La0.15Sm0.35Sr0.08Ba0.42FeO3- was prepared by the glycine-nitrate route.
Synchrotron powder diffraction data were collected from r.t. up to 800ºC in air.