https://www.scirp.org/journal/jgis ISSN Online: 2151-1969
ISSN Print: 2151-1950
DOI: 10.4236/jgis.2019.115034 Oct. 18, 2019 551 Journal of Geographic Information System
Spatio-Temporal Dynamics and Evolution of
Land Use Land Cover Using Remote Sensing and
GIS in Sebou Estuary, Morocco
Ayoub El Adnani1* , Adnane Habib2,3, Khalid El khalidi1, Bendahhou Zourarah1
1Laboratoire Géosciences Marines et Sciences des sols—LGMSS—URAC 45, Faculté des sciences El Jadida, El Jadida, Morocco 2DBAR_ICoE-EOAWARE, (LGMSS-URAC45), Chouaib Doukkali University, BD Jabran Khalil Jabran, EL Jadida, Morocco 3State Key Laboratory of Remote Sensing Science, Institute of Remote Sensing and Digital Earth, Chinese Academy of Sciences, Beijing, China
Abstract
Land use and land cover (LULC) represent the ongoing challenge of envi-ronmental variation. The understanding of the level and process of its change is the basis for any environmental planning and management. In Morocco, as everywhere in the world, human population densities are constantly increas-ing on the coastal zones. This results in a continuous and rapid acceleration of the use of coastal space and an increase in pressures on ecosystems and the different species they contain. The purpose of this study is the analysis of the changes in LULC from 1985 to 2017 in the coastal area of Sebou estuary, si-tuated in the Northwest of the Moroccan Atlantic coast. The changes were identified and assessed after classifying a series of Landsat images taken dur-ing 1985, 2002 and 2017. The algorithm used for the classification is the Sup-port Vector Machine (SVM), which yielded results with accuracy higher than 85%. The results of the land use land cover change describe phenomenal ur-banization and deforestation, as well as an evolution of the agricultural sector, indicating the impact of anthropization in this vulnerable environment.
Keywords
LULC, Change Detection, Accuracy Assessment, Landsat, Sebou Estuary, Anthropization
1. Introduction
Land use and land cover (LULC) is one of the fundamental topics in the study of environmental changes. During the 20th century, the world experienced a phe-How to cite this paper: El Adnani, A.,
Habib, A., El Khalidi, K. and Zourarah, B. (2019) Spatio-Temporal Dynamics and Evolution of Land Use Land Cover Using Remote Sensing and GIS in Sebou Estuary, Morocco. Journal of Geographic Informa-tion System, 11, 551-566.
https://doi.org/10.4236/jgis.2019.115034
Received: September 14, 2019 Accepted: October 15, 2019 Published: October 18, 2019
Copyright © 2019 by author(s) and Scientific Research Publishing Inc. This work is licensed under the Creative Commons Attribution International License (CC BY 4.0).
DOI: 10.4236/jgis.2019.115034 552 Journal of Geographic Information System nomenal and rapid population growth, which goes from 1.6 Billion in 1900 to 6.1 Billion in 2006 [1] [2] [3]. The vast majority of this growth has occurred in developing countries [3]. In Mediterranean countries, more than a third of this growth takes place in coastal regions, especially in coastal cities [4].
According to the World Development Indicators (WDI), the urbanization rate in Morocco has increased from 29% in 1960 to 60.3% in 2014, where 20.4 mil-lion of Moroccan’s population live in urban areas, while 13.4 milmil-lion live in rural areas. This evolution leads to an over-exploitation of natural resources, rural exodus, uncontrolled growth of cities and also the creation of new urban centers
[5]. Therefore, these changes boost the modification of land use causing a real danger to the ecosystems and biodiversity of the affected areas.
The evolution of urban planning and agriculture in an estuarine area is in-evitable given the multiplicity of resources that this area can offer. Over the past three decades, the world has undergone very strong change and massive migra-tion to coastal areas. The study of land use change is a key factor in environ-mental changes [6] [7] [8] [9] [10]. Those changes have a significant impact on natural resources through their impacts on soil and water quality, ecosystem processes and functions, and global climate systems [11] [12] [13] [14]. Recently, remote sensing with multi-temporal satellite data has become a strong tool for monitoring aspects such as vegetation cover, soil degradation, urban expansion and more generally for most types of LULC changes [15] [16] [17] [18] [19].
The city of Kenitra, one of the biggest cities in Morocco, has experienced rap-id population growth due to the creation and concentration of new and large industrial units making a large number of job opportunities and consequently leading to massive immigration of rural populations. All these parameters have led to environmental degradation in the absence of safeguard action plans inte-grated into the socio-economic development of the region [20]. In literature, no study has been conducted on the evolution and impact of LULC in the Sebou estuary. Therefore, this original work will try to better understand the evolution of the LULC in the study area and to serve as a basis for further environmental studies as well as it will give an overall assessment of anthropogenic develop-ment (agriculture, urban ...).
The objective of this research is to study the temporal changes of LULC for the years 1985, 2002, 2017 and to evaluate its transformation between 1985 and 2017. This analysis will make possible the identification of urban sprawl, as well as changes in forest and agricultural cover, and to quantify the impact of anth-ropogenic pressure on coastal environments. The produced results will make an essential contribution to decision-making in the fields of environmental man-agement and future planning.
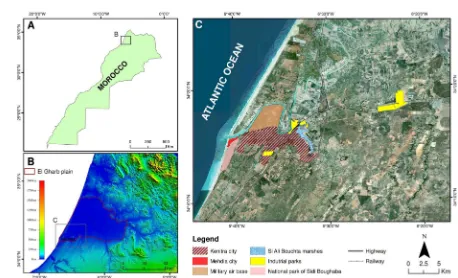
2. Study Area
DOI: 10.4236/jgis.2019.115034 553 Journal of Geographic Information System Figure 1. (A) Situation of the study area at national scale. (B) Shaded relief map of the study area. (C) Study area (Sebou Estuary).
Mediterranean climate with mild, moderate and rainy Atlantic influence during winter, humid and temperate weather during summer with hot wind coming from the East. The rainfall average between 1973 and 2011 is about 537 mm/year, and the average temperature is about 15˚C. However, the temperature is charac-terized by an apparent variability (minimum temperature of 4˚C during winter and maximum 40˚C during summer) [21] [22].
The Kenitra city being the capital of the El Gharb region, with a concentration of 90% of the region’s industrial factories, has become in a few decades a territo-ry with strong anthropogenic attraction, causing a subsequent expansion of the urban area. The Kenitra and Mehdia agglomerations have been established on an exceptional natural site, represented by two wide loops of the Estuary Sebou’s meanders. The left bank is occupied by unsuitable constructions for this vulner-able environment, namely two port areas, a military air base, a penitentiary complex and an industrial area, while the right bank is occupied specially by agricultural lands.
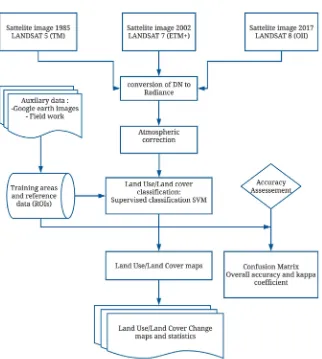
3. Material and Methods
[image:3.595.81.539.60.338.2]DOI: 10.4236/jgis.2019.115034 554 Journal of Geographic Information System Figure 2. Flowchart of the proposed method for LU/LC change mapping.
3.1. Preprocessing
Images acquired by Landsat sensors are subject to the perturbation due to the effects of sensors, sun, atmosphere and topography. The step of image prepro-cessing attempts to minimize these effects to the extent required for a particular application [23]. First, Digital Number (DN) values were converted to radiance values. Later, the atmospheric correction was performed using FLAASH model (Fast Line of sight Atmospheric Analysis of Spectral Hypercubes) which incor-porates a radiative transfer code based on MODerate resolution atmospheric TRANs mission (MODTRAN4) [24] [25].
3.2. LULC Mapping
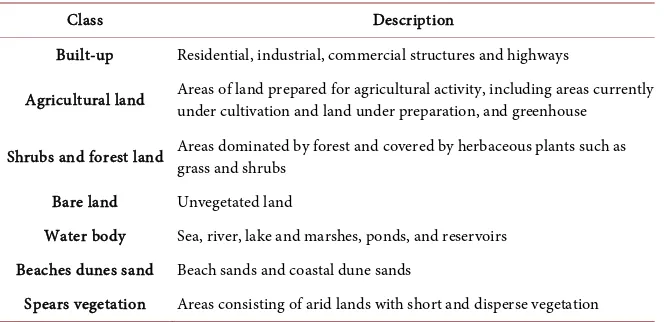
LULC maps of the Sebou Estuary were produced for the years 1985, 2002 and 2017, using a supervised classification algorithm SVM (Support Vector Ma-chine), following a meticulous selection of pixel samples, based on the spectral variation of each class. The generalized images were reclassified into 7 categories (Table 1).
DOI: 10.4236/jgis.2019.115034 555 Journal of Geographic Information System Table 1. The identified LULC types in the study area.
Class Description
Built-up Residential, industrial, commercial structures and highways
Agricultural land Areas of land prepared for agricultural activity, including areas currently under cultivation and land under preparation, and greenhouse
Shrubs and forest land Areas dominated by forest and covered by herbaceous plants such as grass and shrubs
Bare land Unvegetated land
Water body Sea, river, lake and marshes, ponds, and reservoirs Beaches dunes sand Beach sands and coastal dune sands
Spears vegetation Areas consisting of arid lands with short and disperse vegetation
which is one of the most critical problems of the supervised classification [26]. Previous studies show that SVM classifier (Support Vector Machine) is not re-lated to sample’s size, and it has been improved to give better results with quality and limited quantity learning samples [27]. Although SVM is less known than other classifiers for LULC mapping, it has been shown to achieve very good per-formance and has the advantage of dealing well with small ground training sam-ples, which is of particular interest for this case study [27] [28] [29].
3.3. Accuracy Assessment
The accuracy assessment was based on confusion matrices between classification maps and training samples. For this purpose, two indices were evaluated which are the overall accuracy and Kappa index.
The overall accuracy is calculated by summing the number of correctly classi-fied values and dividing by the total number of values according to the equation below [30]:
100
C OA
A
= ∗ (1)
where:
OA is the overall classification accuracy. C is the number of correct points. A is the total number of reference points.
The kappa coefficient measures the agreement between classification and real values. A kappa value of 1 represents perfect agreement, while a value of 0 represents no agreement [30]. The kappa coefficient is computed as follows:
(
)
(
)
, 1 1 2 1 n ni i i i
i i
n i i i
N m G C k
N G C
= = = = − −
∑
∑
∑
(2)where:
i is the class number.
DOI: 10.4236/jgis.2019.115034 556 Journal of Geographic Information System mi,i is the number of values belonging to the truth class i that have also been classified as class i (i.e., values found along the diagonal of the confusion matrix).
Ci is the total number of predicted values belonging to class i. Gi is the total number of truth values belonging to class i.
3.4. Change Detection Analysis
Change detection analysis describes and quantifies the differences between im-ages of the same scene at different times. This analysis was performed with ENVI software, providing a simple approach to measure changes between a pair of images that represent an initial state and final state.
4. Results and Discussion
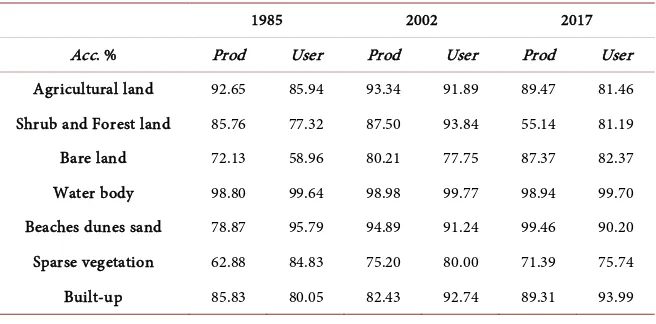
4.1. LULC Classification and Accuracy Assessment
Based on the accuracy assessment, it can be shown that the accuracy of the three produced maps is very similar (higher than 84%). The overall accuracies and kappa indices are, respectively, 88% and 84% for 1985, whereas years 2002 and 2017 show an overall accuracy of 93% and 88.4%, while the kappa indices are around 90.6% and 85%, respectively. Table 2 shows the producer and user ac-curacy for the related years. The choice of the SVM classifier made this task eas-ier, especially for 1985 and 2002 images, where there is a lack of the data needed to establish the different samples classes ROIs (Regions of Interest). As explained above, this classification is based on the quality, not on the number of samples. Therefore, we have been able to use topographic maps, field data and data col-lected from the High Commission for Water and Forests and the Kenitra Urban Agency. This approach allows for a reliable classification and assessment of the obtained results using a limited number of quality samples. The classified images of LUCL for the years 1985 and 2002 and 2017 are presented in Figure 3.
[image:6.595.211.539.563.725.2]The Landsat images used in this study were taken in the same month of the year. All images belong to the summer season, the choice of season is based on
Table 2. Accuracy assessment of classification results based on the confusion matrix for the years 1985, 2002 and 2017.
1985 2002 2017
Acc. % Prod User Prod User Prod User
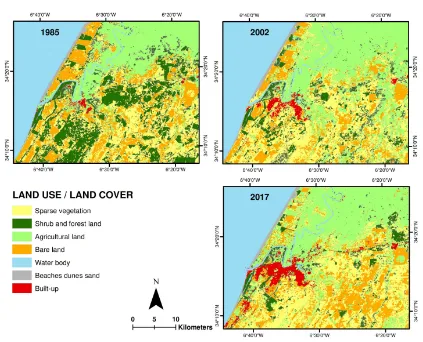
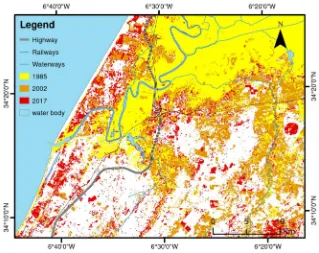
DOI: 10.4236/jgis.2019.115034 557 Journal of Geographic Information System Figure 3. Land use/Land cover maps of the study area for 1985, 2002 and 2017.
our needs to avoid seasonal plants and is to highlight the degradation or evolu-tion of shrubs and forests in the study area. The corresponding classificaevolu-tions have been presented in the form of maps and graphs, which are illustrated in
Figure 3 and Figure 4. Figure 4 shows the area corresponding to each LULC
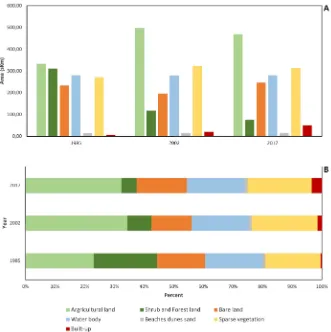
category and its percentage of the total area. Accordingly, a significant increase in built-up areas from 6.7 km2 (0.43%) in 1985 to 49.97 km2 (3.45%) in 2017 can be noted. On the other hand, it can be observed that the class occupying the ma-jority of the study area since 1985 is the agricultural land which has been known a general increase from 333.1 km2 (23%) to 468.6 (32.37%) with a peak in 2002, expressed by a surface of 496.3 km2 (34.31%). Since 1985 Shrubs and Forest land class has known a phenomenal drop from 310.6 km2 (21.45%) to 74.2 km2 (5.42%) in 2017. The bare land, water body, beaches dunes sand and sparse ve-getation classes do not show significant changes representing a variation of 1 to 3% over the last 32 years.
4.2. Change Detection
DOI: 10.4236/jgis.2019.115034 558 Journal of Geographic Information System Figure 4. Total area (A) and percentages (B) of each land use category during the years 1985, 2002 and 2017.
Figure 5. Gains and losses and net change per land use category.
4.2.1. Change in Built-Up
[image:8.595.207.541.448.573.2]DOI: 10.4236/jgis.2019.115034 559 Journal of Geographic Information System Population census data between 1982 and 2014 shows a higher growth rate in this area than the national recorded rate. Indeed, the growth percentage reached 2.3% between 1982 and 1994, 1.5% between 1994 and 2004 then a rate of 1.3% between 2004 and 2014 against 2.06%, 1.3% and 1.25% respectively for the na-tional growth rate [5] [31] [32]. This population increase directly involves an expansion of the urban area.
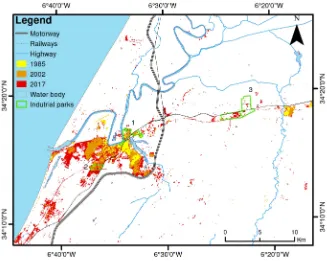
[image:9.595.211.538.421.682.2]A built-up evolution map shows that excessive growth has mainly occurred south of the Sebou river, following three main directions (Figure 6), which are the south-east, south-west and west directions. South-east direction has ex-panded starting from the old medina till the west and south boundaries of Si Ali Boucheta marshes. On the other hand, the south-west direction starts from the old medina’s west boundary till the highway in the south. An important gap is located between the first and second directions. It can be explained by two rea-sons: the forest protection status (Kenitra Urban forest), as well as the elevation of the area (80 m), compared to the south-east and south-west extensions (20 - 30 m). The creation and expansion of industrial zones, which can have a direct effect on directions of expansion, such as the creation of the Bir Rami industrial zone in 1984 in the extreme southwest of the city. the expansion in 1982 of the former industrial zone created in colonial times since 1912, northeast of marshes Si Ali Boucheta. The third evolution direction, which occurs along the military airport till Mehdia city, can be explained by the touristic and economic attrac-tiveness of the Atlantic coast.
DOI: 10.4236/jgis.2019.115034 560 Journal of Geographic Information System 4.2.2. Change in Shrub and Forest Land
The forest domain of the study area shows enormous damage, with a loss of 75% of its area between 1985 and 2017 illustrated in the map below (Figure 7). The results obtained from the change detection statistics show that the greatest damage was recorded in the period 1985-2004 with a loss of 192.6 km2 while during the period between 2004 and 2017 the losses were not significant (43.8 km2) (Figure 5).
According to the map of change of the shrub and forest land category, it can be seen that the major part of the class is located in the south of the Sebou River. This area is the northwestern limit of the Mamora forest considered to be the largest continuous plain cork oak forests in the world. It covered 133,000 ha at the beginning of the 20th century [33] [34]. The main forest species are cork oaks, eucalyptus, acacias and pines according to the High Commissariat of Wa-ter and Forests. Morocco experienced between 1993 and 2004 the most severe periods of drought [35], hence, cork exploitation exploded during this period as a result of the increased demand for wood for socio-economic needs (the de-limbing). Consequently, a loss of more than two thirds of the shrubs and forest land classes was reported between 1985 and 2017.
[image:10.595.210.536.450.710.2]Despite the efforts made by the state to preserve the forest, it still suffers from a severe dysfunction. According to the technical report of the Food and Agri-culture Organization of the United Nations FAO carried out in 2015 [36], the agents and causes of deforestation in the Mamora forest are: livestock farming, the creation of agricultural land, domestic and commercial firewood harvesting, coal production, urbanization, industrial and road infrastructure, and forest fires.
DOI: 10.4236/jgis.2019.115034 561 Journal of Geographic Information System 4.2.3. Change in Agricultural Land
The agricultural sector is one of the major assets of the economic activity in the study area. It benefits from different local factors such as a diverse range of high-quality soils, abundant water resources, availability of labor and proximity to Europe and major consumption centers. All these factors make agriculture the leading activity in the region.
The agricultural lands experienced a general evolution between 1985 and 2017 with a spread of 135.6 km2, knowing that between 1985 and 2002 this category reached 163.7 km2 before it decreased by 23.7 km2 between 2002 and 2017 (Figure 5).
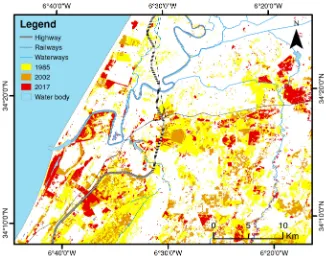
Since 1985, the agricultural land has occupied the north part of Kenitra city and the Sebou river lowlands as shown on the map of agricultural land change
(Figure 8). From 1985 to 2002 the expansion followed a south-eastern direction
[image:11.595.213.532.315.568.2]and occupies especially the valleys of the dry wadis. Between 2004 and 2017 the agricultural land reached the Atlantic coast occupying the largest part of the coastal band.
Figure 8. Spatial variation of agricultural land area in 1985, 2002 and 2017.
4.2.4. Change Detection Map
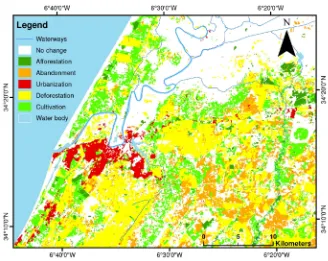
DOI: 10.4236/jgis.2019.115034 562 Journal of Geographic Information System Figure 9. Land Use change trajectories between 1985 and 2017.
into spears vegetation and bare land. On the other hand, the no change cluster shows the areas that have not undergone any transformation (e.g. built-up to built-up, agricultural land to agricultural land, etc.).
It is clear that the study area has undergone enormous changes in LULC, those changes due mainly to human activity given the increase in the population, which implies land needs for the expansion of the city in wood and building materials as well as an expansion and search for new agricultural lands [34]. This has perfectly led to an imbalance in the fragile ecosystems of the Sebou estuary. This evolution implies, in addition to changes in LULC, chemical pollution of the estuary’s water and soil [37] [38].
5. Conclusions
DOI: 10.4236/jgis.2019.115034 563 Journal of Geographic Information System The phenomenal evolution of the built-up areas, the degradation of the forest as well as the green spaces in the study area, the expansion and creation of agri-cultural land are leading to a degradation of environmental quality throughout the study area.
Over the last 32 years, Kenitra city and its surroundings have become more and more a large urban region. We recognize that urban development may be beneficial for a variety of social and economic reasons in a region, such as Keni-tra. However, it seems necessary to take into consideration the environmental and landscape concerns more seriously in order to achieve sustainable develop-ment.
LULC mapping and documentation may not provide the ultimate explanation for all the problems associated with environmental degradation. They can pro-vide a descriptive overview of the evolution of the causes of anthropogenic ex-pansion, but the impact of this evolution cannot be assessed without several biogeochemical studies on sediments and estuarine waters. However, it is one of the most important steps for better understanding of trends and possible causes of this degradation.
Acknowledgements
This research was supported by LGMSS-URAC45 Laboratory in the Faculty of Sciences El Jadida. The authors would like to thank the anonymous reviewers for their helpful and precious suggestions that largely improved the original version of the manuscript.
Author Contributions
All the authors contributed extensively to this paper. Ayoub El Adnani con-ceived and designed the research, processed and analyzed the data, and wrote the manuscript draft. Adnane Habib helped conceive the research and review the manuscript. Additional reviews and edits were done by Khalid El Khalidi. Ben-dahhou Zourarah supervised the research and validated the manuscript.
Conflicts of Interest
The authors declare no conflict of interest.
References
[1] Livi-Bacci, M. (2017) A Concise History of World Population. https://doi.org/10.1002/9781119406822
[2] World Population Prospect (2007) World Population Prospects: The 2006 Revision Volume II: Sex and Age Distribution of the World Population.
[3] Cohen, B. (2006) Urbanization in Developing Countries: Current Trends, Future Projections, and Key Challenges for Sustainability. Technology in Society, 28, 63-80. https://doi.org/10.1016/j.techsoc.2005.10.005
DOI: 10.4236/jgis.2019.115034 564 Journal of Geographic Information System [5] CERED (2005) Démographie Marocaine : Tendances passées et perspectives d
’ave-nir.
[6] Shi, Z.H., Chen, L.D., Hao, J.P., Wang, T.W. and Cai, C.F. (2009) The Effects of Land Use Change on Environmental Quality in the Red Soil Hilly Region, China: A Case Study in Xianning County. Environmental Monitoring and Assessment, 150, 295-306. https://doi.org/10.1007/s10661-008-0231-8
[7] Dale, V.H. (1997) The Relationship between Land-Use Change and Climate Change. Ecological Applications, 7, 753-769.
https://doi.org/10.1890/1051-0761(1997)007[0753:TRBLUC]2.0.CO;2
[8] Imbernon, J. (1999) Pattern and Development of Land-Use Changes in the Kenyan Highlands Since the 1950s. Agriculture, Ecosystems & Environment, 76, 67-73. https://doi.org/10.1016/S0167-8809(99)00061-4
[9] Meyer, W.B. and Turner, B.L. (1994) Changes in Land Use and Land Cover: A Global Perspective.
[10] Jain, M., Dawa, D., Mehta, R., Dimri, A.P. and Pandit, M.K. (2016) Monitoring Land Use Change and Its Drivers in Delhi, India Using Multi-Temporal Satellite Data. Modeling Earth Systems and Environment, 2, 19.
https://doi.org/10.1007/s40808-016-0075-0
[11] Chen, L., Wang, J., Fu, B. and Qiu, Y. (2001) Land-Use Change in a Small Catch-ment of Northern Loess Plateau, China. Agriculture, Ecosystems & Environment, 86, 163-172. https://doi.org/10.1016/S0167-8809(00)00271-1
[12] Kilic, S., Evrendilek, F., Berberoglu, S. and Demirkesen, A.C. (2006) Environmental Monitoring of Land-Use and Land-Cover Changes in a Mediterranean Region of Turkey. Environmental Monitoring and Assessment, 114, 157-168.
https://doi.org/10.1007/s10661-006-2525-z
[13] Turner, A.B.L., Meyer, W.B. and Skole, D.L. (1994) Global Land-Use/Land-Cover Change: Towards an Integrated Study. Ambio, 23, 91-95.
[14] Choudhury, D., Das, K. and Das, A. (2018) Assessment of Land Use Land Cover Changes and Its Impact on Variations of Land Surface Temperature in Asan-sol-Durgapur Development Region. The Egyptian Journal of Remote Sensing and
Space Science, 22, 203-218. https://doi.org/10.1016/j.ejrs.2018.05.004
[15] Güler, M., Yomralioǧu, T. and Reis, S. (2007) Using Landsat Data to Determine Land Use/Land Cover Changes in Samsun, Turkey. Environmental Monitoring and
Assessment, 127, 155-167. https://doi.org/10.1007/s10661-006-9270-1
[16] Mundia, C.N. andAniya, M. (2005) Analysis of Land Use/Cover Changes and Urban Expansion of Nairobi City Using Remote Sensing and GIS. International Journal of
Remote Sensing, 26, 2831-2849.https://doi.org/10.1080/01431160500117865
[17] Yuan, F., Sawaya, K.E., Loeffelholz, B.C. and Bauer, M.E. (2005) Land Cover Classi-fication and Change Analysis of the Twin Cities (Minnesota) Metropolitan Area by Multitemporal Landsat Remote Sensing. Remote Sensing of Environment, 98, 317-328. https://doi.org/10.1016/j.rse.2005.08.006
[18] Yildirim, H., Alparslan, E. and Ozel, M.E. (1995) Temporal Change Detection by Principal Component Transformation on Satellite Imagery. 1995 International
Geoscience and Remote Sensing Symposium, Firenze, Italy, 10-14 July 1995,
1227-1229.
DOI: 10.4236/jgis.2019.115034 565 Journal of Geographic Information System
Earth Systems and Environment, 3, 1285-1301.
https://doi.org/10.1007/s40808-017-0375-z
[20] Mergaoui, L., Fekhaoui, M., Bouya, D., Gheït, A. and Stambouli, A. (2003) Qualité des eaux et macrofaune benthique d’un milieu estuarien du Maroc : Cas de l’estuaire de Sebou. Bulletin de l’Institut Scientifique, section Sciences de la Vie, No. 25, 67-75.
[21] ORMVAG (2014) Données des stations météorologiques de la zone de l’Office Régional de Mise en Valeur Agricole du Gharb (ORMVAG). Kénitra.
[22] El Jihad, M.-D., Peyrusaubes, D. and El Bouzidi, A. (2014) Sécheresses saisonnières et changement climatique dans le Gharb (Maroc). Rur @lités, 4, 14-25.
[23] Young, N.E., Anderson, R.S., Chignell, S.M., Vorster, A.G., Lawrence, R. and Evan-gelista, P.H. (2017) A Survival Guide to Landsat Preprocessing. Ecology, 98, 920-932.https://doi.org/10.1002/ecy.1730
[24] Abreu, L.W. and Anderson, G.P. (1996) The MODTRAN 2/3 Report and LOWTRAN 7 MODEL.
[25] Berk, A., Feldeb, A.J.R.G.W., Anderson, G.P., Hoke, M.L. and Cooky, T. (2002) Ex-ploiting Atmospheric Correction : The FLAASH Algorithm. Proceedings of 5th
In-ternational Conference on Information Fusion, FUSION 2002, Annapolis, MD,
8-11 July 2002, 798-803.
[26] Chi, M., Feng, R. and Bruzzone, L. (2008) Classification of Hyperspectral Re-mote-Sensing Data with Primal SVM for Small-Sized Training Dataset Problem.
Advances in Space Research, 41, 1793-1799.
https://doi.org/10.1016/j.asr.2008.02.012
[27] Mountrakis, G., Im, J. and Ogole, C. (2010) Support Vector Machines in Remote Sensing : A Review. I ISPRS Journal of Photogrammetry and Remote Sensing, 1, 1-13.
[28] Fernandez-Delgado, M., Cernadas, E. and Barro, S. (2014) Transboundary Flows of Western Entertainment across the Iron Curtain. Journal of Machine Learning
Re-search, 15, 3133-3181.
[29] Melgani, F. and Bruzzone, L. (2004) Classification of Hyperspectral Remote Sensing Images with Support Vector Machines. IEEE Transactions on Geoscience and
Re-mote Sensing, 42, 1778-1790.https://doi.org/10.1109/TGRS.2004.831865
[30] Conglaton, R.G. (1991) A Review of Assessing the Accuracy of Classifications of Remotely Sensed Data. Remote Sensing of Environment, 37, 35-46.
https://doi.org/10.1016/0034-4257(91)90048-B
[31] RGPH and HCP (2014) Caracteristiques socio-économique et démographique de la population de la province de Kénitra.
[32] RGPH and HCP (2004) Caracteristiques demographiques et socio-economiques : Region de Gharb-Chrarda-Beni Hssen.
[33] FFEM, FAO, ONFInternational, and HCEFLCD (2015) Caractérisation des agents et causes la déforestation et de la dégradation forestière dans le site de la Maâmora au Maroc.
[34] Noumonvi, K.D., Mounir, F. and Belghazi, B. (2017) Spatial Multi-Criteria Based Analysis to Assess Dynamics and Vulnerability of Forest Ecosystems to Global Changes: Case of Maamora Forest-Morocco. OALib: A New Open Access Journal, 4, 1-16.
(Trans-DOI: 10.4236/jgis.2019.115034 566 Journal of Geographic Information System lated by Author). Hydroécologie Appliquée, 16, 215-232.
https://doi.org/10.1051/hydro/2009003
[36] FAO (2015) Agents et causes de la déforestation et dégradation dans les sites pilotes du projet.
[37] Cheggour, M., Chafik, A., Fisher, N.S. and Benbrahim, S. (2005) Metal Concentra-tions in Sediments and Clams in Four Moroccan Estuaries. Marine Environmental
Research, 59, 119-137.https://doi.org/10.1016/j.marenvres.2004.04.002
[38] Loukili, A. and Belghyti, D. (2007) The Dynamics of the Nematode Anguillicola
crassus, Kuvahara 1974 in Eel Anguilla anguilla (L. 1758) in the Sebou estuary