Measuring Server QoS in Open Virtual Worlds
Relating QoS to QoE for OpenSim Servers on the Hyper-GRID
Fahad Usman, Alan Miller, Iain Oliver, John McCaffery, Lisa Dow and Colin Allison
School of Computer ScienceUniversity of St Andrews
[email protected],{alan.miller,iao,jm726,lisa.dow,ca}@st-andrews.ac.uk
Abstract—To understand the performance of networked com-puter systems it is necessary to consider client, server and network components. Virtual Worlds are resource intensive interactive systems. As such they are liable to degradations in system performance which have a negative impact upon users’ Quality of Experience (QoE). To efficiently use system resources it is necessary to understand when and how changes in Quality of Service (QoS) impact upon the QoE. This study investigates the factors that affect the performance of Open Virtual World Servers and how these impact upon users. It presents quantitative experimental results that establish factors which affect QoS performance and qualitative results of user QoE. The central research question asks ’to what extent can we identify easily measurable system properties that will enable us to make efficient use of server resources whilst preserving QoE?
This paper identifies the Server Frame Time (SFT), the time taken by the server to create a frame, and Server Frames per Second (SFPS), the number of frames created by a server in a second, as key metrics which are easy to measure and relate directly to QoE. Most virtual world servers are allocated resources manually and this allocation is independent of the actual work load. As a result, server resources are under utilised due to variations in load. This approach causes a higher provisioning cost than is necessary. The study in this project establishes a way to determine the usability threshold. Based on this server resources can be tuned to provide appropriate QoE for users while making sure that they are utilised to their full potential.
Keywords: Virtual Worlds, QoS, QoE, Traffic Measurement
I. INTRODUCTION
Neal Stephenson envisioned the Internet transitioning into something called the Metaverse [1]. The term virtual world can be traced back to 1970s in the context of virtual reality and computer games [2]. The scientific community has presented many definitions of virtual worlds [3], [4], [5], [6]. How-ever, The OECD (Organisation for Economic Co-operation and Development) defines the virtual world as ”a persistent computer-simulated environment where large number of users are represented by avatars to interact with each other and the simulated environment in real time.” Based on this definition, gaming applications such as Grand Theft Auto (GTA) are not considered to be virtual environments because they are single user open world games. Other applications such as Google street view or social networking sites are not virtual worlds because they do not allow interaction through avatars [7].
[image:1.612.313.570.176.324.2]Progression in immersive technologies such as the Oculus Rift and developing computing and communication infrastruc-tures are making 3D immersive multi-user environments and virtual worlds both feasible to host and attractive to use.
Fig. 1. Scene with Avatars in St Andrews Cathedral Reconstruction.
Second Life (SL) is an online simulated, multi-user, virtual world hosted by Linden Labs since 2003. It offers free regis-tration, client software, exploration and user generated content. Linden Labs open-sourced the client software in January 2007 which led to the creation of the OpenSim project. OpenSim is an alternative multi-platform, multi-user 3D application server, which enables individuals and organisations to host their own virtual world services. For example the apollo open virtual world GRID (openvirtualworlds.org) hosts some 400 regions across 10 servers [8]. It is used to support applications in education [9], [10], [11], research [12], [13] and heritage [14], [15].
An OpenSim Open Virtual World system, is made up of several components. On the server side: a GRID server: provides login and asset management services; one or more Simulators host regions; Region: is a piece of land with (x, y, z) coordinates and its own connection port in the grid; Scene: is a representation of the objects or the contents within a region and also can be used to manage the objects within a particular region; Agent: client’s representation in a region that contains a circuit referring to a connection. Agent has a root agent in the current view of the region and a child in the neighbouring regions. The viewer is a client application for visualising the simulation and receiving user input.
Fig. 2. Sequence of load generation events, used in the automatic creation of avatars and measurement of system performance.
II. EXPERIMENTALDESIGN
For each active region an OpenSim server hosts it generates frames. Each frame represents a cycle of work, which ends with a self consistent region state being communicated to clients for visualisation. The time that it takes for a server to complete this frame cycle we call Server Frame Time (SFT) and the rate of frame generation is quantified as Server Frames per Second (SFPS) [16].
Our central hypothesis is that SFPS and SFT provide system metrics which are measurable and directly correlated to users QoE. The system caps the SFPS at 55. A short SFT indicates unused system resources but once the SFT rises above the threshold of 18 ms SFPS is reduced and time dilation applied. To improve QoE requires monitoring the SFT and limiting the access or increasing resource once this threshold is reached. This study varies the following factors: Number of Avatars, Characteristics of the Region, Server Systems and Number of Regions Loaded. Fair tests are used changing one variable at a time. The investigation is in three areas:
1) System measurement: Discover and compare the system performance of physical and virtual server configura-tions.
2) System Loads: investigating systems performance under different types of load.
3) Correlating Results: The relationship between SFPS and SFT with user experience.
Before each experiment, the following methodology is em-ployed: hypothesis, define the avatar actions to generate traffic,
select OpenSIM regions/Zones to visit, setup experiment/mea-surement environment, gather data, visualise and analyse data.
1) Avatar Actions: Studies of network traffic aimed at quantifying the bandwidth required by virtual worlds focused on the activity of a single avatar and measured traffic for the following avatar actions [17]: Standing Avatar remains still (no movement either from mouse or keyboard),Walking
Avatar moves in straight line, in a random direction and with a constant speed,FlyingAvatar flies in random directions within a zone at a constant speed, and Running Avatar runs in a straight line, in a random direction and with constant speed.
In this study we focus on measuring the impact of the numbers of avatars on server performance. Automated bots are used. Each bot spends time walking, turning and standing. The bots workload is designed to emulate the activities of real users. In [16] the system load generated by automated users with the workloads we use is shown to closely approximate the load generated by real users.
2) OpenSim Regions: There is great variety in the char-acteristics of OpenSim zones, where a zone contains one or more contiguous regions. Some are nearly empty spaces used for prototyping builds or collaborative learning, others may be filled with scripts, prims and objects in varying proportions. In this study we use zones currently hosted on the apollo server. The range of islands selected for the experiments is are divided into the following three categories: Empty Region (Island) with no objects/buildings or prims available;Cathedral Region
Fig. 3. Measurement Environment.
(50,000), objects (17,000) and scripts (820), and a selection of zones with characteristics between these two extremes. This helped to evaluate and compare the number of objects on each island against the number of avatars present on the region(s). The classification of these islands is summarised in Table I.
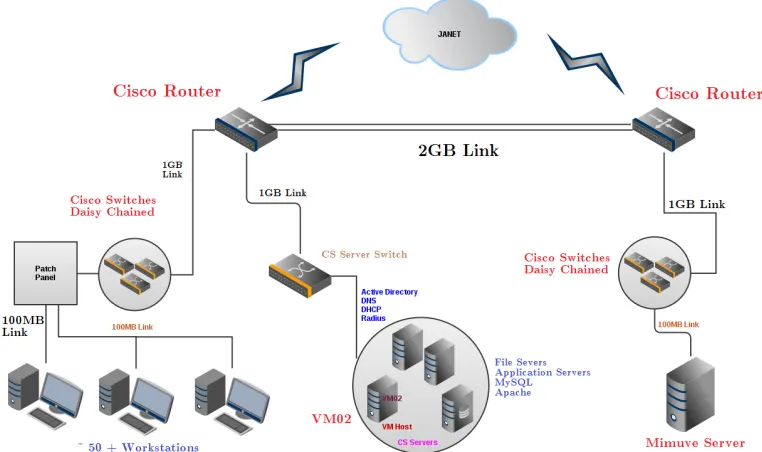
3) Measurement Environment: Experiments were carried out in sequenced processes performed under a controlled environment as shown in Fig. 3.
The experimental set up is shown in Fig. 3, which also shows the network layout. The three server systems evaluated were: Mimuve an Ivy Briidge commodity computer, VM02 a Xeon server, and a virtual machine running on VM02. They have the following specifications.
Mimuve specifications: Intel Core i7-3770K CPU @ 3.50GHz and 16 GB of RAM; Ubuntu operating system.VM02 host machines specifications: Intel Xeon CPU E5-2620 @ 2.0 GHz, dual six Core processors with hyper threading, 128 GB RAM, 1.36 TB of SAS Disk Storage organised in a four disk array; Windows 8 Server operating system.VM02 virtual machines resource specifications: four Core Dedicated CPU processor, 16 GB RAM; Scientific Linux operating system.
The eight client machines’ specifications are: Model SH61R,
Zone Regions Objects Prims Active Scripts
Empty 1 0 0 0
Cathedral 6 17461 51482 820 Timespan 9 3732 22822 91 Central Hub 1 564 2437 90 Mosfell 9 1480 25264 5 Salt Pan 2 2180 3901 159 Virtual Harlem 1 3986 13938 30 Virtual Montmartre 1 1 3000 11980 308
TABLE I
CHARACTERISTICS OF DIFFERENTZONESUSED IN THE EXPERIMENTS
Intel Core i5-3470S CPU @ 2.90 GHz, 2901 MHz, four Core(s) processor with 8GB of RAM memory and Intel HD Graphics; Scientific Linux OS.
All the traffic between the servers and clients is contained within the local network. These servers are connected to the network via 100MB links (Fig 3). The experimental setup supports client, network and server side performance measurements. Each of the servers can be loaded with regions using archive files. An example is the reconstruction of St Andrews Cathedral which consists of over 50,000 prims and comprising of 768m*512m (Fig. 2). The client environment is configurable with respect to visibility, time of day, mist, colour, texture, clothes and lighting. A viewer has default settings for these dependent on a clients capabilities [18].
4) Running the experiments and Data Collection: The measurement infrastructure was developed using Libopen-metaverse. Load was generated on the servers by creating programmable Bot avatars which were used to simulate real human users. Shell scripts on the Linux operating system were used to execute the experiments sequentially. The sequence diagram which describes the experiment process from start to end is shown in Fig. 2.
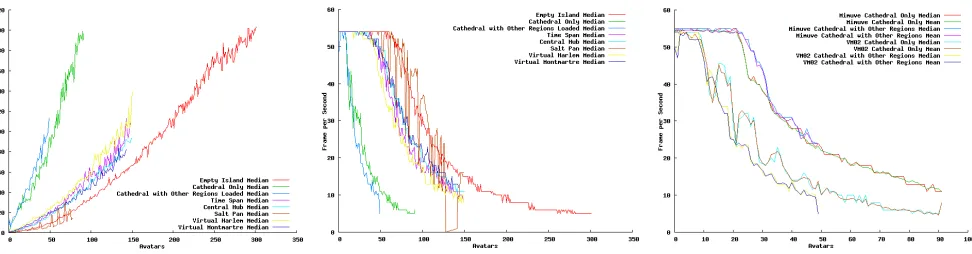
Fig. 4. Spread of SFT for different regions. Fig. 5. Server Frames per Second on VM02 Fig. 6. Passive loaded regions and performance.
experimental infrastructure was calibrated by comparing real user activities driving thirty avatars, with those of Bots [16]. There was found to be a close correlation between the load generated by properly configured bots and real users.
A Linux loop shell script was created to perform continuous experiments for obtaining reliable data. The script controls three runs of an experiment to collect data at different times of the day and records the system readings in log files. It adds one avatar per client machine to the previous experiment on the server. Eight client machines can effectively support two hundred avatars on the region i.e. 25 avatars per machine. To simulate a real world scenario, an ssh connection is made into the next available machine after landing the bot, it then creates an avatar from the new machine and moves to the next, until the maximum number of avatars required is reached. This facilitates the execution of multiple experimental runs while ensuring that the maximum parameter space was accurately probed. Generated Bot avatars have the ability to move from region to region. This in turn affects the SFPS and the SFT. Furthermore, the SFPS is related to the smoothness of motion. At the end of the experiment, the log file is moved into an appropriate folder and renamed as run files. These run files were then processed by a bespoke Java program called avatars-Graph.java. This application generates appropriate plain text data files. These are used by an open source program called gnuplot to create graphs to visualise the results. Automation of the experiments enables repeatability and exploration of the paramater space.
III. SYSTEM ANDUSERMEASURMENTS
This section presents quantitative results evaluating factors effecting server performance and qualitative results correlating user experience with SFT. Quantitative results include: the
Avatars Mimuve Native VM02
Virtual VM02
Mimuve / Native
Mimuve / Virtual
Native / Virtual
FPS FPS FPS % % % 10 55 48 50 13 9 -4 20 55 48 32 13 42 33 30 45 35 23 20 48 34 40 32 28 13 13 59 54 50 28 21 10 25 64 52
TABLE II
THREE WAY COMPARISON OF SERVER CAPABILITIES
effect on SFPS and SFT of increasing numbers of avatars, for both simple and complex regions, a comparison of the performance of three different server configurations, the effect of having passive regions loaded on a server and the effect of having regions loaded with active avatars.
1) Impact of Avatars on Server Frame Time and Server Frames Per Second: The time it takes for the server to create a frame is shown in Fig. 4 for the eight regions described in Table II hosted on the virtual server. It rises linearly with the number of avatars, however the rate of increase is markedly different for each of the regions measured. The frames a server produces per second are shown in Fig. 5. At first the increase in SFT has no efffect on the SFPS, which starts at the maximum of 55. As the number of avatars increases each region reaches a threshold after which the SFPS begins to drops. The threshold position is affected by, number of objects, prims and scripts and ranges between 15 and 200 avatars for this server.
This demonstrates that system load can not be directly from the number of avatars on a region.
2) Comparison of Ivybridge, Virtual and E5 Server Sys-tems: Here a three-way comparison between Mimuve, Virtual VM02 and the Xeon server is conducted. In each case the region (St Andrews Cathedral) and load are the same. The percentage performance differences are shown in Table II. It is interesting to note that the six core dual processor system with 128GB of RAM costing around 5K does not obtain as good a performance as the Mimuve server which cost around 1K, a huge 80% difference in cost. Mimuve performs 25% better than Native VM02 and approximately 65% better than virtual server VM02. As a consequence of these results we suggest that hosting virtual world simulations servers built round Xeon Ivybridge and Haswell processors will enable
Avatars VM02 Without Avatars on Other Regions
VM02 With Avatars on other Regions
Percentage differ-ence
FPS FPS
10 55 26 53
20 31 18 42
30 21 8 62
40 13 6 54
50 11 Crashed TABLE III
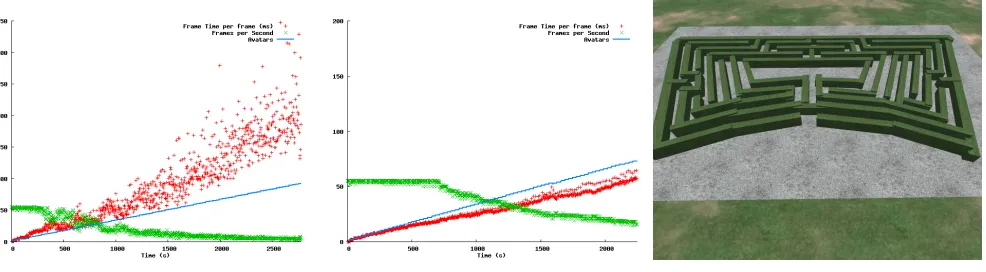
Fig. 7. SFT spread with the virtual server . Fig. 8. SFT spread with mimuve. Fig. 9. Maze used to test usability.
good performance at high load. Where it is desirable to host a large number of regions at low load a single machine multi processor E5 systems may be appropriate. Using virtualisation is appropriate when the virtual world services need to share a machine with other services or a cloud infrastructure is being used to satisfy peaks in demand.
3) Single active region with multiple passive regions:
The hypothesis under test is that performance changes when passive regions are loaded alongside the active region. Sep-arate experiments were conducted on Cathedral region and Cathedral region with Central Hub, TimeSpan, Mosfell and Salt Pan regions loaded, but with no active avatars. The results are given in Fig. 6. These show that loading passive regions may not have an impact on performance. When the Cathedral Region is loaded alone, Mimuve supported 50 avatars at 24 SFPS and when other regions are loaded with Cathedral, the same number of avatars were supported at the same SFPS. VM02, on the other hand supported 50 avatars at 14 SFPS but when other regions were loaded, for the same number of avatars, the SFPS dropped below 10. This suggests that servers can support a limited number of passive regions, without negatively impacting performance on an active region. However, if too many passive regions are loaded performance suffers.
4) Avatars and Other Regions: These experiments inves-tigated the effect of having avatars active on another region in the same simulator. In this case a constant twenty active avatars. The results for the virtual server are shown in Table III. These show that active avatars on other regions do have a significant impact on performance. At ten avatars the virtual server could provide the full frame rate of 55 SFPS for the Cathedral Island alone. when there were twenty avatars on another region, this dropped to 26 SFPS. When the more powerful Mimuve server was used the drop in framerate was less and by distributing avatars across multiple regions the server was able to provide a better service than when all the avatars were present on the same region.
5) Variation in Server Frame Time: So far the discussion has focused on the mean and median values for SFT and SFPS. Figures 7 and 8 show scatter plots of SFT and SFPS for the virtual server and Mimuve with the Cathedral region loaded. As load increases so does the variance of the SFT for the
virtual server. The variance for the Cathedral is much less both at the same absolute load and at the same mean SFT. This suggests that the use of virtualisation adds considerable variance to system performance. The spread in SFPS is much less marked. This is in part because each reading is itself an average of the frame rate each second. Variance is bad for real time interactive systems because it delivers to the user an inconsistent Quality of Experience.
A. User Quality of Experience Trials
To test the hypothesis SFT and variation in SFT have a strong correlation with QoE Hampton Court Maze was built on the Cathedral region and users were asked to carry out a series of activities and tasks. The SFPS and SFT were continuously recorded and then matched with users accounts of QoE arranged into five categories as shown in Fig. 11, 10 and 12.
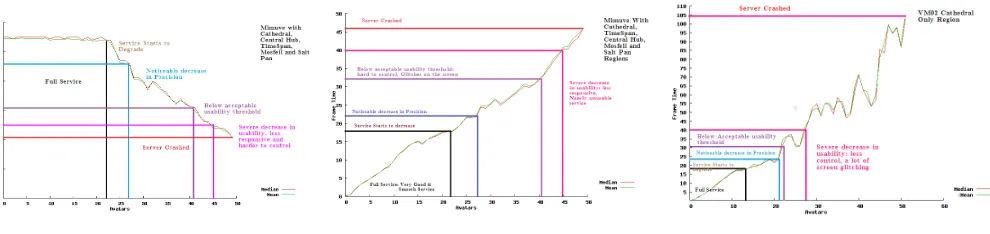
1) Full Service. At this stage, SFT is less than 18 and SFPS is at 55. User enjoys a very good, smooth and responsive service and would like to rate the service 10 out of 10. 2) Noticeable decrease in precision. The avatar becomes a bit slower and harder to control; textures are sometimes out of place and there is flickering in dense areas. 3) Below acceptable usability threshold. A lot of jittering
on the screen; avatar movement very slow; running was almost at walking speed; objects appearing and disappearing in dense areas.
4) Severe decrease in usability. Running becomes slower than walking and as a user stated you have to have a good reason to use the system at this point.
5) System is not usable.
In Fig. 10 shows the SFPS for Mimuve, running the St Andrews Cathedral region, with the user navigating a model of the Hampton Court maze. As the SFPS decreases users report a deterioration in usability. Anoticeable decrease in precision
[image:5.612.65.558.59.195.2]Fig. 10. Mimuve SFPS QoE Benchmarking. Fig. 11. Mimuve SFT and QoE Benchmarking Fig. 12. VM02 Server Frame Time and QoE
SFT in both cases is 18 ms and the matches between the other thresholds are also close. These experiments show that Server Frame Time is a better predictor of user Quality of Experience than avatar load.
IV. CONCLUSION
Open Virtual Worlds offer the ability for institutions to deploy immersive applications, which are of particular use in education and heritage. For this to be done efficiently without compromising service it is important to understand the relationship between load and performance. This paper has quantified the effects of: increasing avatar numbers, the complexity of models, type of server, passive regions being loaded and of active avatars on other regions. We have concluded that the effect of increasing avatar numbers varies considerably depending on the complexity of virtual world regions, that visualisation does not work well with virtual worlds but that servers based around Ivybridge and Haswell Xeon processors offer good performance. A moderate number of passive regions has little effect on an active region and while more avatars can be supported by distributing them across regions, avatars active on a different region but in the same simulation will cause the performance threshold to be lowered for other regions.
Each virtual world system measured for this paper has a reflex point, which is reached as load is increased. Below an SFT of around 20ms changes in load do not have a noticeable impact upon the user experience. However, beyond that point the decrease in SFPS and reduction in responsiveness reduce the quality of user experience. Whilst number of avatars, prims and objects all contribute to load non are a consistent indicator of where this reflection point is. However, the amount of time the system takes creating each frame is a good indicator. This is easy to measure, relates directly to QoE and has a threshold, consistent across heterogeneous regions, beyond which user experience is degraded. The SFT therefore provides a generic metric which is suitable for use in resource management.
The results presented in this paper are of use to system administrators planning to set up or expand an Open Virtual World Grid and for configuring resources within a live Grid.
REFERENCES
[1] N. Stephenson,Snow Crash. Bantan Books, 1992.
[2] P. Grigora and C. Burdea,Virtual Reality Technology. John Wiley and Sons Inc., 2003.
[3] E. Castronova, Synthetic Worlds. The University of Chicago Press, 2005.
[4] M. W. Bell, “Toward a definition of “virtual worlds”,” Journal of Virtual Worlds Research, vol. 1, no. 1, pp. 1–5, 2008. [Online]. Available: http://lar.me/soci221-6
[5] R. Koster and W. Wright,A Theory of Fun for Game Design. Paraglyph Press, 2004.
[6] B. Reeves and J. Read, Total Engagement: How Games and Virtual Worlds Are Changing the Way People Work and Businesses Compete. Harvard Business Review Press, 2013. [Online]. Available: http://books.google.co.uk/books?id=hbFSia7bdUoC
[7] O. for Economic Co-operation and Development, Virtual Worlds: Immersive Online Platforms for Collaboration, Creativity and Learning, ser. OECD digital economy working papers. OECD, 2011. [Online]. Available: http://books.google.co.uk/books?id=C1dBMwEACAAJ [8] S. Kennedy, I. Oliver, and A. Miller. (2014, 05) Apollo open virtual
world server. Virtual World Server. Centre for Archaeology Technology and Cultural Heritage, University of St Andrews. apollo.cs.st-andrews.ac.uk:8002. [Online]. Available: openvirtualworlds.org [9] K. Getchell, A. Miller, R. Nicoll, R. Sweetman, and C. Allison,
“Games methodologies and immersive environments for virtual field-work,”Learning Technologies, IEEE Transactions on, vol. 3, no. 4, pp. 281–293, 2010.
[10] I. Duncan, A. Miller, and S. Jiang, “A taxonomy of virtual worlds usage in education,”British Journal of Educational Technology, vol. 43, no. 6, pp. 949–964, 2012.
[11] C. Allison, A. Miller, T. Sturgeon, I. Perera, and J. McCaffrey, “The third dimension in open learning,” in2013 IEEE Frontiers in Education Conference (FIE), vol. 0. Los Alamitos, CA, USA: IEEE Computer Society, 2011, pp. T2E–1–T2E–6.
[12] C. J. Davies, A. H. D. Miller, and C. Allison, “Mobile cross reality for cultural heritage,” inProceedings of UNESCO Congress on Digital HEritage. IEEE, 2013.
[13] I. Oliver, A. Miller, and C. Allison, “Mongoose: throughput redis-tributing virtual world,” in Computer Communications and Networks (ICCCN), 2012 21st International Conference on. IEEE, July 2012, pp. 1–9.
[14] J. P. McCaffery, A. H. D. Miller, S. E. Kennedy, A. Vermehren, C. Lefley, and K. Strickland, “Exploring heritage through time and space: supporting community reflection on the highland clearances,” in
Proceedings of UNESCO Congress on Digital Heritage. IEEE, 2013. [15] S. E. Kennedy, R. Fawcett, A. H. D. Miller, R. J. Sweetman, L. Dow, A. Campbell, I. A. Oliver, J. P. McCaffery, and C. Allison, “Exploring canons and cathedrals with open virtual worlds: The recreation of st andrews cathedral, st andrews day, 1318,” inProceedings of UNESCO Congress on Digital Heritage. IEEE, 2013.
[16] A. Sanatinia, I. A. Oliver, A. H. D. Miller, and C. Allison, “Virtual machines for virtual worlds,” inCLOSER 2012. SciTePress, 2012. [17] I. A. Oliver, A. H. Miller, and C. Allison, “Virtual worlds, real
traffic: Interaction and adaptation,” inProceedings of the First Annual ACM SIGMM Conference on Multimedia Systems, ser. MMSys ’10. New York, NY, USA: ACM, 2010, pp. 305–316. [Online]. Available: http://doi.acm.org/10.1145/1730836.1730873
[image:6.612.61.556.57.174.2]