Journal of Geophysical Research: Space Physics
Average field-aligned current configuration parameterized
by solar wind conditions
J. A. Carter1, S. E. Milan1, J. C. Coxon1,2, M.-T. Walach1, and B. J. Anderson3
1Department of Physics and Astronomy, University of Leicester, Leicester, UK,2Now at School of Physics and Astronomy,
University of Southampton, Southampton, UK,3The John Hopkins University Applied Physics Laboratory, Laurel,
Maryland, USA
Abstract
We present the first large-scale comparison of the spatial distribution of field-aligned currents as measured by the Active Magnetosphere and Planetary Electrodynamics Response Experiment, with the location and brightness of the average auroral oval, determined from the Imager forMagnetopause-to-Aurora Global Exploration far ultraviolet instrument. These distributions are compared under the same interplanetary magnetic field magnitude and clock angle conditions. The field-aligned currents and auroral oval drop to lower latitudes, as the interplanetary magnetic field becomes both increasingly stronger in magnitude and increasingly southward. We find that the region 2 currents are more closely aligned with the distribution of auroral UV emission, whether that be in the discrete auroral zone about dusk or in the postmidnight diffuse aurora sector. The lack of coincidence between the region 1 field-aligned currents with the auroral oval in the dusk sector is contrary to expectation.
1. Introduction
The traditional viewpoint is that upward field-aligned currents (FACs, also known as Birkeland currents) are coincident with discrete aurora [Elphic et al., 1998]. We compare the location and brightness of the auroral oval, obtained from the Imager for Magnetopause-to-Aurora Global Exploration (IMAGE) far ultraviolet (FUV) cameras, with the distribution of FACs, obtained from the Active Magnetosphere and Planetary Electrody-namics Response Experiment (AMPERE) data set. There are currently no high-altitude, polar orbit imagers of the auroral zone, so the data sets we use were not obtained simultaneously. The data as a whole spans two solar cycles. However, by binning the data under the same solar wind and geophysical conditions we are able to compare the distributions of the auroral oval with that of the FACs. This paper presents the first large-scale statistical comparison of the auroral oval UV emission, for both the electron and proton aurora, with the distribution of the Birkeland currents.
Previous space missions have imaged the polar regions from high-altitude vantage points afforded by orbital trajectories with large apogees in highly inclined orbital planes. These missions have taken measurements over time periods of less than a solar cycle but have nonetheless provided large databases of images of the polar regions under many different input solar wind conditions. Missions such as Polar [Torr et al., 1995] (operational between 1996 and 2008) and IMAGE [Mende et al., 2000a, 2000b] (operational between 2000 and 2005) have imaged either the Northern Hemisphere or Southern Hemisphere polar cap at ultraviolet wave-lengths during their operational lifetimes. For both Polar and IMAGE the hemisphere wholly visible to the spacecraft at one time changed during the lifetime of the mission due to precession of the apogee, so both hemispheres were sampled.
Milan et al.[2010] investigated the differences in the location and intensity of the main auroral oval, as observed by the IMAGE FUV instrument suite, under a variety of different solar wind and geophysical conditions. They found that geomagnetic activity as measured by theKpindex, and auroral dynamics are closely associated, but that solar wind parameters, such as the solar wind speed or density, were less impor-tant in regulating the auroral oval. The interplanetary magnetic field (IMF) magnitude and orientation also plays an important role in modulating the auroral dynamics, in particular, with regards to the spatial config-uration of the auroral oval and the appearance of the cusp spot under IMF northward conditions.Milan et al.
[2010] compared the locations of the auroras produced by precipitating protons and electrons. The dawn
RESEARCH ARTICLE
10.1002/2015JA021567
Key Points:
• FACs and the auroral oval drop to lower latitudes with increasingly stronger and more southward IMF • Region 2 currents are more closely
aligned with the auroral UV emissions than region 1
• The lack of coincidence between the dusk region 1 currents and the auroral oval is surprising
Correspondence to:
J. A. Carter, [email protected]
Citation:
Carter, J. A., S. E. Milan, J. C. Coxon, M.-T. Walach, and B. J. Anderson (2016), Average field-aligned cur-rent configuration parameterized by solar wind conditions,J. Geophys. Res. Space Physics,121, 1294–1307, doi:10.1002/2015JA021567.
Received 11 JUN 2015 Accepted 20 JAN 2016
Accepted article online 25 JAN 2016 Published online 15 FEB 2016
©2016. The Authors.
Journal of Geophysical Research: Space Physics
10.1002/2015JA021567
Figure 1.The global layout of the magnetospheric current systems of the
Earth (Northern Hemisphere only). The region 1 and 2 currents are shown, along with the magnetopause (Chapman-Ferraro, black), partial ring current (black dashed), and the Pedersen currents (green) that flow across the polar cap. Upward/downward current regions in the polar region and the region 1 and 2 currents are colored red/blue. Illustration adapted from Clausen et al.[2012] andCoxon et al.[2014a].
sector is brighter for electrons, whereas the dusk sector is brighter for protons. In addition, the proton aurora is found at lower latitudes than the electrons in the dusk sector and at higher latitudes in the dawn sector.
The global distribution of the FACs was first demonstrated using 1 year worth of data from the TRIAD satellite that measured transverse magnetic perturbations [Iijima and Potemra, 1976a, 1976b]. These currents are broadly distributed into two concen-tric areas [Iijima and Potemra, 1978], known as the region 1 and 2 currents, found at higher and lower latitudes, respectively. The large-scale distribu-tion of these currents is depicted in Figure 1 (adapted from similar figures inClausen et al.[2012] andCoxon et al.
[2014a]). The region 1 and 2 currents close in the polar cap ionosphere via Pedersen currents and connect with the current at the magnetopause (Chapman-Ferraro) on the dayside and the partial ring current on the nightside. A third current system, known as region 0, is occasionally present on the dayside polar cap poleward of the large-scale region 1 currents and is associated with the auroral cusp [Iijima and Potemra, 1976b] (not shown in the figure). The polar cap is a region of open magnetic flux, whose size is governed by the balance between the rates of magnetic reconnection at the dayside magne-topause and in the nightside magnetotail [Milan et al., 2012, and references therein]. The region 1 currents are believed to flow in part inside the boundary layer that separates the open polar cap and closed magnetic flux regions [Clausen et al., 2012], whereas the region 2 currents exist at lower latitudes and close via the westward nightside partial ring current.
Recently, data from the AMPERE project have been made available to the community. AMPERE data are col-lated from the commercial IridiumⓇsatellites. The Iridium constellation comprises 66 spacecraft orbiting in six polar orbital planes, each with a period of 104 min at an altitude of 780 km. Each satellite uses a set of engi-neering fluxgate magnetometers for attitude keeping. The local current density, across all local time sectors, is found via a least squares fit of a set of spherical harmonic functions to the cross-track magnetic perturbations as measured by the Iridium magnetometers [Anderson et al., 2008;Waters et al., 2001]. At high latitudes (>60∘), the current density will be dominated by the distribution of the FACs.Coxon et al.[2014b] made a statistical analysis of the available AMPERE data set to quantify the magnitudes of the region 1 and 2 currents, under the driving influence of the dayside reconnection rate. They found that the strengths of the currents are strongly correlated with the dayside reconnection rate. The currents generally exhibited magnitudes of between 1 and 4 MA, rising to∼6 MA at the most geomagnetically active times. Region 1 and 2 currents are of approximately the same magnitude until a threshold of∼4 MA is reached, whereby the region 1 currents dominate the region 2 currents by an average factor of∼1.15. Using the same data set,Coxon et al.[2014a] observed the Birkeland current ovals move equatorward with increased dayside reconnection, later moving poleward after substorm onset, consistent with the Expanding/Contracting Polar Cap Paradigm (ECPC) [Cowley and Lockwood, 1992;
Milan et al., 2012, and references therein].
Journal of Geophysical Research: Space Physics
10.1002/2015JA021567
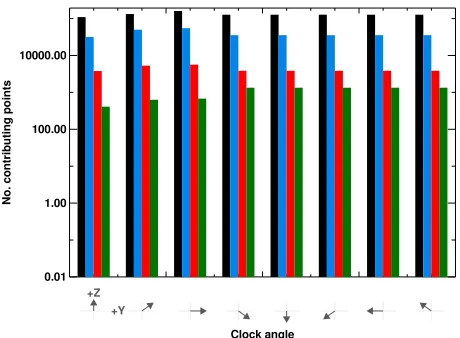
Figure 2.Histogram of the distribution of AMPERE data used in this study, parameterized by clock angle as shown by
thexaxis dials. Each clock angle is split into an IMF magnitude bin: 0 to 5 nT (black), 5 to 10 nT (blue), 10 to 15 nT (red), and 15 to 20 nT (green).
2. Data Analysis
The IMAGE FUV imaging suite comprised the Spectrographic Imager (SI) and Wideband Imaging Camera (WIC). WIC is sensitive in the range 140 nm to 190 nm and observes the aurora resulting from precipitating electrons in this band. The SI12 channel measured Doppler-shifted Lyman-𝛼emission and therefore observes the aurora resulting from precipitating protons. WIC images are sensitive to dayglow, which we consider fur-ther in section 3. The Norfur-thern Hemisphere data set from theMilan et al.[2010] study comprised 350,000 images from SI12 taken during the period June 2000 to May 2002 and 150,000 images from WIC taken from the winter months from October through to February from late 2000 to early 2002. Average auroral images were produced under different solar wind and geophysical conditions, and these form the basis of our comparative study.
In this study, solar wind data were obtained via the OMNI database [King and Papitashvili, 2005], whereby the interplanetary magnetic field (IMF) parameters have been adjusted in time for propagation to the dayside bow shock.
Using the time stamps of the 1 min resolution OMNI data, we are able to bin the 10 min cadence AMPERE data to make maps of average current density under different solar wind and geomagnetic conditions, for the period January 2010 to 5 September 2013. From the OMNI data we extract information regarding the IMF magnetic field strength and direction, from which we calculate the IMF clock angles and IMF field mag-nitudes. The AMPERE data were binned by the same IMF clock angles and IMF magnitude in four bins. Any magnetic local time and magnetic latitude map segment with current densities with a magnitudes less than 0.1μA m−2were rejected (Clausen et al.[2012] andAnderson et al.[2014] used the more conservative
thresh-olds of 0.2μA m−2and 0.16μA m−2, respectively). The eight clock angle bins have a width of 45∘, and the first
bin was centered on 0∘(northward IMF). The IMF magnitude ( √
B2 Y+B
2
Z, from the dayside coupling
parame-ters as expressed inMilan et al.[2012]) bins cover 0 nT to 5 nT, 5 nT to 10 nT, 10 nT to 15 nT, and 15 nT to 20 nT. The relative coverage for the parameterization is shown in Figure 2 (note that there are bins with data higher than 20 nT, but we restrict our analysis to ranges given above for direct comparison with theMilan et al.[2010] result). In the following sections we discuss the results in terms of the average current density distributions.
3. Results
Journal of Geophysical Research: Space Physics
10.1002/2015JA021567
Figure 3.Average Northern Hemisphere FAC distributions parameterized by IMF magnitude and clock angle, plotted
on a 1 h MLT and 10∘colatitude grid (gray). Noon is to the top, and we note the number of contributing AMPERE and IMAGE data points in each panel. We overplot average electron auroral oval contours (green) from IMAGE WIC data, from 1000 until 2000 counts at 250 counts intervals and at intervals of 1000 counts thereafter. The FACs color bar has been saturated to increase clarity. Additional lines in Figure 3h.i indicate the meridians used for Figures 5 and 7: 15–03 h MLT (magenta) and 21–09 h MLT (light blue).
IMAGE WIC data have a 1∘resolution, whereas IMAGE SI12 data are presented at 2∘resolution. In Figures 3h.i and 4h.i, representative lines are shown in magenta and light blue. These indicate the local time sectors used in the meridinal profiles, as described later on in this section.
Journal of Geophysical Research: Space Physics
10.1002/2015JA021567
Figure 4.As for Figure 3, but with average proton auroral oval contours (green) constructed from IMAGE SI12 data.
Contours are shown at 100 count intervals from 200 counts. Meridian slices are shown in Figure 4h.i: 15–03 h MLT (magenta) and 21–09 h MLT (light blue) as used for Figures 6 and 8.
We have saturated the color scale for Figures 3 and 4 so that global distributions of region 1 and 2 currents are more easily visible.
Journal of Geophysical Research: Space Physics
10.1002/2015JA021567
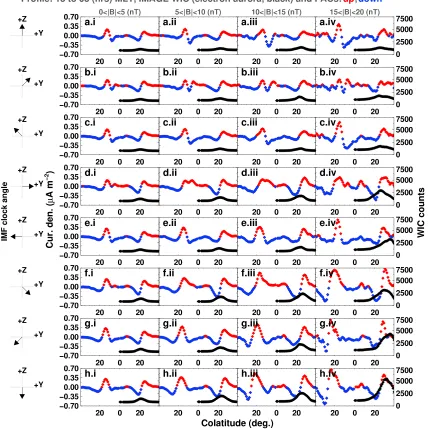
Figure 5.Average FAC (red/blue for upward/downward FACs, respectively) and average electron auroral profiles (black), obtained from Figure 3, across the 15 h
to 03 h MLT meridian, as parameterized by IMF magnitude and clock angle. The profiles run from 15 h MLT on the left of each panel to 03 h MLT on the right.
weak (<0.2μA m−2) for northward and weak IMF (e.g., panel a.i). The region 1 currents also extend into the
nightside polar cap, and the region 2 currents extend further into dayside MLT sectors, as the clock angle and IMF magnitude increase. Both the region 1 and 2 current systems become broader in latitudinal extent and move to lower latitudes, as the clock angle becomes increasingly southward, and the IMF magnitude increases (compatible with the ECPC paradigm and as investigated byCoxon et al.[2014a]). The effect of the IMFBY ori-entation on the distribution is most notable on the dayside for northward IMF (rows a to c), in particular, for the high-latitude NB2 current system, which is not the focus of this study and which we do not consider further. Auroral oval contours between conjugate IMFBYdirections are similar (e.g., rows d and e), with larger dif-ferences observed for the higher IMF magnitude bins. This is most probably due to the low number of contributing images in these bins.
Journal of Geophysical Research: Space Physics
10.1002/2015JA021567
Figure 6.Average FAC (red/blue for upward/downward FACs, respectively) and average proton auroral profiles (black), obtained from Figure 4, across the 15 h to
03 h MLT meridian, in the same format as Figure 5.
and 8 we plot a profile along the 21 h to 09 h MLT meridian and include a profile along the same meridian for the IMAGE WIC or SI12 auroral counts, respectively.
Journal of Geophysical Research: Space Physics
10.1002/2015JA021567
Figure 7.Average FAC (red/blue for upward/downward FACs, respectively) and average electon auroral profiles (black), obtained from Figure 3, across the 21 h to
09 h MLT meridian, in the same format as Figure 5. The profiles run from 21 h MLT on the left of each panel to 09 h MLT on the right.
least squares linear fit to each data set in Figure 9 (magenta dashed line). A representative one-to-one linear relationship between the parameters for each panel is shown by a gray dashed line.
4. Discussion
The overall current distribution, organized by IMF magnitude as shown in Figures 3 and 4, shows behavior consistent with the the ECPC paradigm, in that as the IMF becomes increasing southward, the currents move to lower latitudes and become broader in extent [Coxon et al., 2014b]. In this section we discuss the current profiles in more detail, with respect to previous results in the literature using other observations of auroral emissions.
Journal of Geophysical Research: Space Physics
10.1002/2015JA021567
Figure 8.Average FAC (red/blue for upward/downward FACs, respectively) and average proton auroral profiles (black), obtained from Figure 4, across the 21 h to
09 h MLT meridian, in the same format as Figure 7.
Journal of Geophysical Research: Space Physics
10.1002/2015JA021567
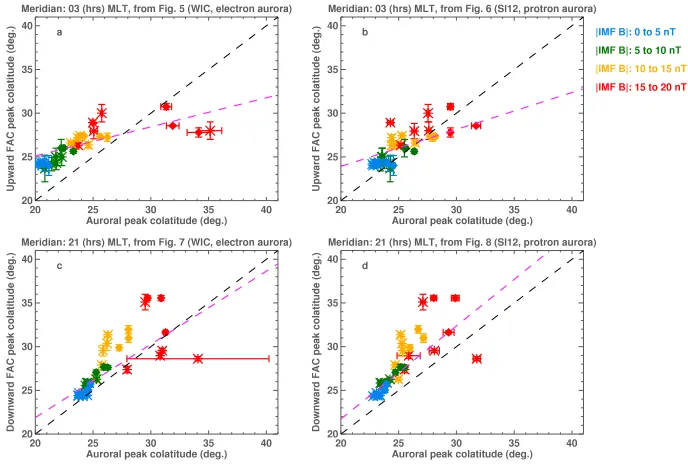
Figure 9.Colatitude locations of the peak average FAC versus the peak average auroral intensity, obtained from the
profiles of Figure 5–8. Figures 9a and 9b are for the upward FAC versus the electron/proton aurora colatitude along the 03 h MLT meridian. Figures 9c and 9d are for the downward FAC versus the electron/proton aurora colatitude along the 21 h MLT meridian. The dashed gray line represents a linear one-to-one relationship between the values. The magenta dashed line represents a linear fit to the data. Each point and error bar is color coded by IMF strength, as shown in the legend. Points under IMF southward/northward conditions are plotted as diamonds/crosses.
Korth et al.[2014] found a close association between region 1 upward currents at dusk with regions of intense electron precipitation, in the discrete auroral region, and attribute this correspondence to precipitation due to field-aligned acceleration in this sector [Newell et al., 2009]. Little association between the precipitat-ing electrons and upward FACs was found in the postmidnight to dawn sector. This is consistent with the notion that pitch angle scattering of eastward drifting plasma sheet electrons into the loss cone by whistler mode waves dominates the precipitation within this region without the need for a large contribution of precipitating particles accelerated by a field-aligned potential drop, resulting in the diffuse aurora observed [Korth et al., 2014].
It is clear from Figure 3 that the largest average upward current densities and the largest average IMAGE WIC contours are approximately colocated in the postmidnight sector (region 2). In a comparison of data obtained by Polar UVI and the AMPERE during a 1 h period,Waters et al.[2001] noted that postmidnight auroral emis-sions may have a weak region 2 upward FAC associated with them and comment that diffuse aurora in this sector is not necessarily produced solely by precipitating electrons. Diffuse aurora is brighter in the FUV (which shows the distribution of the proton aurora) relative to the discrete aurora region, as shown inWaters et al.
[2001] and the results ofMilan et al.[2010].Murphy et al.[2013] found that aurora was largely coincident with the upward FAC regions in the midnight sector under substorm conditions.Murphy et al.[2013] also noted that downward FAC typically occurs in regions of diffuse aurora. We find that average auroral emissions from statistical distributions of downward precipitating electrons (e.g., for southward IMF and an IMF magnitude
Journal of Geophysical Research: Space Physics
10.1002/2015JA021567
aurora shown inMilan et al.[2010]. Region 2 FACs occur in closed field line regions, whereas the region 1 FACs close via the magnetopause and are open to the solar wind. Region 1 and 2 FACs therefore sample plasma populations with different origins and by consequence different energies.
For any panel in Figure 3 the most prominent IMAGE contours and the strongest upward currents are not coin-cident in the dusk or evening sectors. For the statistical downward currents, best shown in Figure 4, overlaid with contours from parameterized average IMAGE SI12 data (sensitive to emission from proton aurora, from precipitating protons), the strongest auroral emissions maximize around 21 h MLT, which are superimposed on a region of increased region 2 downward current density, for all IMF magnitudes>10 nT (Figures 4a.iii, 4b.iii, 4c.iii, 4d.iii, 4e.iii, 4f.iii, 4g.iii, 4h.iii, 4a.iv, 4b.iv, 4c.iv, 4d.iv, 4e.iv, 4f.iv, 4g.iv, and 4h.iv), and most readily seen for southward IMF (Figures 4f–4h). In their single case study,Waters et al.[2001] found that discrete electron aurora in the dusk sector is associated with region 1 upward currents and therefore downward precipitating electrons, consistent with previous expectations [Elphic et al., 1998], but in contrast with our result. In addition,
Waters et al.[2001] found a lack of FUV emission coincident with the region 2 downward current in the dusk sector.Korth et al.[2014] also found region 1 upward currents and precipitating electrons closely coincident in the dusk sector for southward IMF conditions, resulting in the discrete aurora excited by monoenergetic field-aligned electrons [Newell et al., 2009]. The data ofKorth et al.[2014] show electron fluxes, for southward IMF conditions, over a broad range of latitudes. The peak in electron-excited emissions is seen at around 75∘ latitude; however, emissions are observed down to approximately 60∘latitude. Although the peak in electron fluxes is found within the boundaries of the region 1 upward current region at dusk, the latitude of these peak emissions is high given the prevailing southward IMF. The high latitude of the electron fluxes contrasts with the peak auroral emissions as shown inMilan et al.[2010], which are found at slightly below 65∘latitude post-dusk but premidnight (see the contours in Figure 3 for the strongest and most southerly IMF conditions, e.g., Figures 3h.iii and 3h.iv). TheKorth et al.[2014] study parameterized the data by IMF orientation only, whereas theMilan et al.[2010] result parameterized the data by both IMF orientation and magnitude. TheMilan et al.
[2010] result clearly shows the peak auroral emissions dropping to lower latitudes with increasingly south-ward IMF, consistent with the ECPC paradigm [Cowley and Lockwood, 1992;Milan et al., 2012, and references therein], whereby the polar cap open-closed field line boundary expands to lower latitudes, as open flux is added to the polar cap following reconnection at the dayside magnetopause. Future studies that analyze the energy of the precipitating particles in the vicinity of the region 2 FACs, under the same geophysical con-ditions as presented here, will investigate the location and nature of the acceleration of the particles in this sector, with the aim to understand the discrepancy of the result presented in this paper with previous studies.
A comparison between the peak fitting results in Figures 9a–9d shows that as the IMF strength increases (points for when the IMF magnitude is between 15 nT and 20 nT are colored red), the peaks of the measured currents drop to lower latitudes (increasing colatitudes).Clausen et al.[2012] found that the spatial locations of region 1 FACs could be used as a proxy for the area of the polar cap open field line region. The change in latitude of the region 1 FACs for periods of enhanced geomagnetic activity was consistent with the ECPC paradigm. The general proxy of the region 1 current equatorward latitudinal displacement with increased IMF magnitude [rather than with increased geomagnetic activity in the case ofClausen et al.[2012] is shown in Figures 9a and 9b, and the same general behavior is observed for the (lower latitude) region 2 currents in Figures 9c and 9d.
For the upward region 2 currents along the 03 h MLT meridian (Figure 9a), all upward FAC peaks are found at lower latitudes than the electron auroral emission peaks (IMAGE WIC) in the same sector, except for a few cases, when the IMF magnitude is strongest. This latitudinal shift, at all but the largest IMF magnitudes, is consistent with the results ofKorth et al.[2014], who observed a poleward shift of the auroral precipitation with respect to the peak in the upward FAC that peaked at approximately 5∘. As previously described,Korth et al.[2014] attribute this poleward shift to the dominating contribution of diffuse precipitating electrons over any field-aligned acceleration in the postmidnight sector.
Journal of Geophysical Research: Space Physics
10.1002/2015JA021567
the peak in the auroral emissions, for a given band of IMF magnitude, in particular, for the largest IMF magni-tudes. Data points at lower IMF magnitudes, in general, sit closer to the one-to-one relationship.Waters et al.
[2001] comment that the diffuse aurora, found in the postmidnight sector, is not necessarily produced solely by electrons, and the FACs associated with diffuse aurora in this sector are not necessarily carried by precipi-tating electrons, and this could explain the coincidence of the precipiprecipi-tating protons with the auroral oval in the 03 MLT sector. The results of Figures 9a and 9b would suggest that at smaller IMF magnitudes downward FACs (downward precipitating protons) and the proton aurora is coincident. At higher IMF magnitudes, the proton aurora is not predominately fed by the region 2 FACs.
Region 2 downward current peaks versus the peaks in average auroral emission (IMAGE WIC) along the 21 h MLT meridian are shown in Figure 9c. Although downward precipitating electrons resulting in the region of discrete electron aurora premidnight are not expected to coincide with downward FACs, we note that the peaks in the average auroral emissions of Figure 7 are approximately aligned with the maximum average downward currents in each profile. Again, the general expansion to lower latitudes, following the ECPC, is seen along with this meridian, with greater IMF magnitudes resulting in lower latitudes. We have already seen that the peak in electron auroral emissions occurs postmidnight (Figure 3), and it is probable that the relationship here is simply a result of a general expansion of the region 1 and 2 current systems. The largest error bar occurs for the highest magnitude bins for when the IMF is northward with negativeBY, but the number of contributing IMAGE WIC points for this bin is low, and the auroral contours are not well defined.
For the downward region 2 currents along the 21 h MLT meridian (Figure 9d, resulting from the fitting of the profiles seen in Figure 8), all downward FAC peaks except one are found at lower latitudes (higher colatitudes) than the proton auroral emission peaks in the same sector. The offset, as represented by the linear fit (magenta dashed line) increases with increasing IMF magnitude. As mentioned previously, the linear relationship in this sector (dusk and premidnight) of the downward region 2 FACs with the proton auroral oval is surprising. Previous studies [e.g.,Korth et al., 2014] have observed discrete auroral forms from precipitating electrons that were coaligned with region 1 upward FACs in the dusk sector. Electrons in this sector have been shown to be monoenergetic, which have undergone field-aligned acceleration to produce the discrete aurora [Newell et al., 2009]. Our images of the electron aurora (Figure 3) in this sector are hampered by considerable dayglow. However,Korth et al.[2014] note an alignment of region 1 upward FACs and precipitating electrons in this sector that extends considerably postdusk, which is not reflected in our data. Instead, the average IMAGE WIC contours peak in the postmidnight region, as discussed previously. The average electron aurora, as shown by the WIC contours, span a reasonably wide latitude band, with the largest width in the contours observed in the postmidnight sector. The postmidnight peak emission is found at approximately 60∘for the largest magnitude and most southerly IMF. Only low levels of average electron aurora are seen at dusk for southerly IMF conditions, with the peak of emissions occurring at region 2 downward FAC latitudes.
Journal of Geophysical Research: Space Physics
10.1002/2015JA021567
10∘colatitude equatorward with increasing dayside reconnection, the auroral oval also moves equatorward in colatitude to the same extent; therefore, the region 2 FAC association with the UV emissions is unlikely due to large-scale averaging performed in this study, given that the data were binned under the same incoming IMF conditions parameters.
5. Conclusions
In this paper we have compared the global average distribution of the FACs with the average distributions of the proton and electron auroras, parameterized by IMF magnitude and clock angle. We leave the comparison with other solar wind parameters to future studies.
The FAC maps presented in this paper show the combined average global distribution of the FACs and the net flow of charge in the polar region. The large-scale FAC distribution into region 1 and 2 areas is a simpli-fication of a complicated system that includes other minor current systems. By averaging under similar IMF conditions, we are able to compare the FAC maps with similar maps of average proton and electron aurora, from a data set that is not contiguous with the AMPERE archive. The auroral maps show the average distribu-tions of precipitating ions (SI12) and electrons (WIC). Electron auroras are usually expected to be associated with upward FACs, carried by precipitating electrons. We would therefore expect to find a close spatial cor-respondence between the electron aurora and region 1 upward currents in the dusk sector and the region 2 upward currents in the dawn sector.
However, we find that region 2 current systems are associated with the spatial distribution of both the proton and electron auroras, with only a weak association between the auroras and region 1 FACs on average. This is in contrast with existing expectations, especially in the dusk sector. Both electron and proton auroras are dis-tributed throughout the region 2 FAC system; however, electron auroras dominate in the postmidnight sector where upward currents are seen, and proton auroras dominate premidnight where downward currents are seen. The statistical results presented in this paper indicate that the location of the auroras is not necessarily a good gauge of the location of the FACs.
References
Anderson, B. J., K. Takahashi, and B. A. Toth (2000), Sensing global Birkeland currents with iridiumⓇengineering magnetometer data,
Geophys. Res. Lett.,27, 4045–4048, doi:10.1029/2000GL000094.
Anderson, B. J., H. Korth, C. L. Waters, D. L. Green, and P. Stauning (2008), Statistical Birkeland current distributions from magnetic field observations by the Iridium constellation,Ann. Geophys.,26, 671–687, doi:10.5194/angeo-26-671-2008.
Anderson, B. J., H. Korth, C. L. Waters, D. L. Green, V. G. Merkin, R. J. Barnes, and L. P. Dyrud (2014), Development of large-scale Birkeland currents determined from the active magnetosphere and planetary electrodynamics response experiment,Geophys. Res. Lett.,41, 3017–3025, doi:10.1002/2014GL059941.
Clausen, L. B. N., J. B. H. Baker, J. M. Ruohoniemi, S. E. Milan, and B. J. Anderson (2012), Dynamics of the region 1 Birkeland current oval derived from the Active Magnetosphere and Planetary Electrodynamics Response Experiment (AMPERE),J. Geophys. Res.,117, A06233, doi:10.1029/2012JA017666.
Cowley, S. W. H., and M. Lockwood (1992), Excitation and decay of solar wind-driven flows in the magnetosphere-ionosphere system,
Ann. Geophys.,10, 103–115.
Coxon, J., S. Milan, L. Clausen, B. Anderson, and H. Korth (2014a), The magnitudes of the regions 1 and 2 Birkeland currents observed by ampere and their role in solar wind-magnetosphere-ionosphere coupling,J. Geophys. Res. Space Physics,119, 9804–9815, doi:10.1002/2014JA020138.
Coxon, J., S. Milan, L. Clausen, B. Anderson, and H. Korth (2014b), A superposed epoch analysis of the regions 1 and 2 Birkeland currents observed by AMPERE during substorms,J. Geophys. Res. Space Physics,119, 9834–9846, doi:10.1002/2014JA020500.
Elphic, R. C., et al. (1998), The auroral current circuit and field-aligned currents observed by FAST,Geophys. Res. Lett.,25, 2033–2036, doi:10.1029/98GL01158.
Humm, D. C., et al. (1998), Design and performance of the Global Ultraviolet Imager (GUVI), inEUV, X-Ray, and Gamma-Ray Instrumentation for Astronomy IX, Society of Photo-Optical Instrumentation Engineers (SPIE) Conf. Ser., vol. 3445, edited by O. H. Siegmund and M. A. Gummin, pp. 2–12, SPIE.
Iijima, T., and T. A. Potemra (1976a), The amplitude distribution of field-aligned currents at northern high latitudes observed by TRIAD,
J. Geophys. Res.,81, 2165–2174, doi:10.1029/JA081i013p02165.
Iijima, T., and T. A. Potemra (1976b), Field-aligned currents in the dayside cusp observed by TRIAD,J. Geophys. Res.,81, 5971–5979, doi:10.1029/JA081i034p05971.
Iijima, T., and T. A. Potemra (1978), Large-scale characteristics of field-aligned currents associated with substorms,J. Geophys. Res.,83, 599–615, doi:10.1029/JA083iA02p00599.
Imber, S. M., S. E. Milan, and M. Lester (2013), Solar cycle variations in polar cap area measured by the superDARN radars,J. Geophys. Res. Space Physics,118, 6188–6196, doi:10.1002/jgra.50509.
King, J. H., and N. E. Papitashvili (2005), Solar wind spatial scales in and comparisons of hourly Wind and ACE plasma and magnetic field data,J. Geophys. Res.,110, A02104, doi:10.1029/2004JA010649.
Korth, H., Y. Zhang, B. J. Anderson, T. Sotirelis, and C. L. Waters (2014), Statistical relationship between large-scale upward field-aligned currents and electron precipitation,J. Geophys. Res. Space Physics,119, 6715–6731, doi:10.1002/2014JA019961.
Acknowledgments
Journal of Geophysical Research: Space Physics
10.1002/2015JA021567
Markwardt, C. B. (2009), Non-linear least-squares fitting in IDL with MPFIT, inAstronomical Data Analysis Software and Systems XVIII, Astron. Soc. of the Pac. Conf. Ser., vol. 411, edited by D. A. Bohlender, D. Durand, and P. Dowler, pp. 251–254, Astron. Soc. of the Pac., San Francisco, Calif.
Mende, S. B., et al. (2000a), Far ultraviolet imaging from the IMAGE spacecraft. 2. Wideband FUV imaging,Space Sci. Rev.,91, 271–285. Mende, S. B., et al. (2000b), Far ultraviolet imaging from the IMAGE spacecraft. 1. System design,Space Sci. Rev.,91, 243–270. Milan, S. E., T. A. Evans, and B. Hubert (2010), Average auroral configuration parameterized by geomagnetic activity and solar wind
conditions,Ann. Geophys.,28, 1003–1012, doi:10.5194/angeo-28-1003-2010.
Milan, S. E., J. S. Gosling, and B. Hubert (2012), Relationship between interplanetary parameters and the magnetopause reconnection rate quantified from observations of the expanding polar cap,J. Geophys. Res.,117, A03226, doi:10.1029/2011JA017082.
Murphy, K. R., I. R. Mann, I. J. Rae, C. L. Waters, H. U. Frey, A. Kale, H. J. Singer, B. J. Anderson, and H. Korth (2013), The detailed spatial structure of field-aligned currents comprising the substorm current wedge,J. Geophys. Res. Space Physics,118, 7714–7727, doi:10.1002/2013JA018979.
Newell, P. T., T. Sotirelis, and S. Wing (2009), Diffuse, monoenergetic, and broadband aurora: The global precipitation budget,
J. Geophys. Res.,114, A09207, doi:10.1029/2009JA014326.
Torr, M. R., et al. (1995), A far ultraviolet imager for the international solar-terrestrial physics mission,Space Sci. Rev.,71, 329–383, doi:10.1007/BF00751335.
Waters, C. L., B. J. Anderson, and K. Liou (2001), Estimation of global field aligned currents using the iridiumⓇsystem magnetometer data,
![Figure 1., 1976b] (not shown in the figure). The polar cap is a region of open magnetic flux,Milan et al., 2012, and references therein]](https://thumb-us.123doks.com/thumbv2/123dok_us/9414632.442876/2.612.178.418.88.270/figure-shown-gure-polar-region-magnetic-milan-references.webp)