© 2019, IRJET | Impact Factor value: 7.211 | ISO 9001:2008 Certified Journal | Page 1141
Advanced Cell – Averaging Constant False Alarm Rate Method in
Homogeneous and Multiple Target Environment
Mrs. Charishma
1, Shrivathsa V. S
21
Assistant Professor, Dept. of Electronics and Communication Engineering, NMAM Institute of Technology,
Nitte – 574110, Karkala, Karnataka, India.
2
Student, Dept. of Electronics and Communication Engineering, NMAM Institute of Technology, Nitte – 574110,
Karkala, Karnataka, India.
---***---Abstract –
Constant False Alarm Rate (CFAR) Detectionis an adaptive algorithm used in Radar systems to detect the target echoes against a background of noise and clutter. The role of the constant false alarm rate circuit is to determine the threshold above which any returning signal or echo can be considered probably to be originated from a target. In most radar systems, the threshold is set to achieve a required false alarm rate. The Cell Averaging CFAR (CA CFAR) works very well in homogeneous environment and single target situations. However, its performance is limited to isolated targets and homogeneous environment. But the targets are not always isolated. Two or more targets may be present in the same reference window. In this paper a modified form of CA CFAR detector is discussed. The threshold behaviour of CA CFAR in multi-target case, and the detection performance of modified CA CFAR are also discussed. Simulations are carried out using MATLAB for analyzing target masking and detection probability.
Key Words: CFAR, CA-CFAR, SO-CFAR, Radar threshold
detection, Target masking
1. INTRODUCTION
Radar return is often a mixture of noise, clutter and targets. A key component in RADAR processing is the setting of detection thresholds. These thresholds differentiate between targets of interest and unwanted radar returns. As the operating environments and conditions change, the amount and nature of noise and also change. For accurate and reliable detection, the threshold must self‐adjust dynamically and intelligently.
Constant False Alarm Rate (CFAR) represents a key technique in adaptively setting target detection threshold [1]. Employing a moving window, across range bins of data, CFAR algorithms look at neighbourhoods of power returns to estimate the noise or clutter mean. By scaling the estimated mean with a pre‐calculated multiplier, the
threshold is set so as to limit the false alarms to a tolerable and desired rate.
CFAR algorithms are assessed for their abilities to maintain desired probabilities of detections ( ) and their probabilities of false alarms ( ). The probability of
detection describes the chances of successfully declaring a target, when a target is actually present. The probability of false alarm describes the odds of incorrectly declaring a target, when the signal is actually noise.
CFAR algorithms must be able to operate in a variety of environments such as homogeneous, multiple targets, and clutter wall. In homogeneous environment, a single target exists in a sea of noise. In multiple target environment, several targets exist in close proximity to one another. In clutter wall environment, noise or clutter power experiences sudden, discontinuous increase or decrease. The areas discussed in this paper are the homogeneous environment and the multiple target environment.
Constant False Alarm Rate (CFAR) is a critical component in radar detection. Through the judicial setting of detection threshold, CFAR algorithms allow radar systems to set detection thresholds and reliably differentiate between targets of interest and interfering noise.
In many operating conditions, noise and clutter distributions may be highly heterogeneous with sudden jumps in clutter power or with the presence of multiple targets in close proximity. A good CFAR algorithm must reliably operate in these conditions without prohibitively high implementation costs.
© 2019, IRJET | Impact Factor value: 7.211 | ISO 9001:2008 Certified Journal | Page 1142
proximity of one another. CA CFAR algorithm suffersserious decline in performance in multiple target cases. When the targets are within half a window length of one another, their high powers, improperly elevates the estimated mean of the background noise. When the resulting thresholds are set, they are higher than they need to be, and that results in losses in probability of detection (PD).
In order to demonstrate the advantages of modified algorithm, it is necessary to recall the original CA CFAR algorithm.
1.1 Cell-Averaging CFAR Principle
[image:2.595.333.532.236.388.2]Cell-Averaging CFAR algorithm was first developed by Howard Finn [2]. CA CFAR, of all the CFAR algorithms available, works best in homogeneous environment. But when the assumptions of homogeneous environment are violated, the performance of CA CFAR reduces severely.
Figure 1.1: Cell – Averaging CFAR Principle
Figure 1.1 shows the principle of CA CFAR. The center cell is the Cell-Under-Test (CUT), the cross-hatched cells immediately adjacent to the CUT are the guard cells, and the cells adjacent to the guard cells are known as the reference cells. The combination of these three types of cells is collectively called as the CFAR window. In CA CFAR, each and every reference cell is added together to form an estimate of the samples in them. This estimate is then multiplied with an appropriate multiplier to obtain the detection threshold. The detection decisions are made based on this threshold.
For Gaussian and homogeneous noise, the threshold multiplier is given by:
(1.1)
where, is the threshold multiplier, N is the total number of reference cells and is the probability of false alarm.
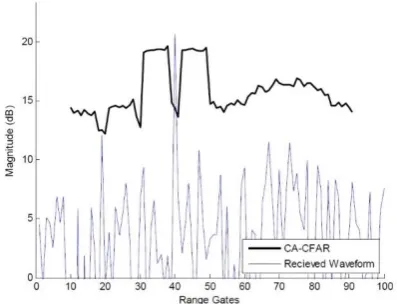
Figure 1.2 shows the CA CFAR threshold behaviour in homogeneous environment. A single target is present at range bin 37 in a homogeneous background. As it can be seen, from Figure 1.2, the CA CFAR threshold rejects all the noise and successfully detects the target.
However, in multiple target environment, when another target is close to the primary target CA CFAR threshold fails to detect the primary target and detects the interfering target. This phenomenon is called as “target masking”.
Figure 1.2: CA CFAR Threshold in Homogeneous Environment
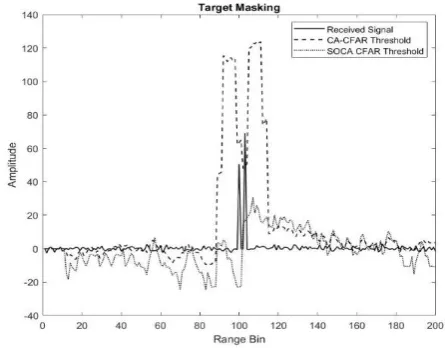
[image:2.595.62.257.371.487.2]Target masking occurs when two or more targets are present such that, when one target is in the test cell, one or more targets are located among the reference cells. Assuming that the power of the target in the reference cell exceeds that of the surrounding interference, its presence will raise the estimate of power and thus CFAR threshold also increases. The target in the reference window can mask the target in the test cell because the increased threshold causes a reduction in the probability of detection, i.e., the detection is more likely to be missed.
[image:2.595.320.540.583.746.2]© 2019, IRJET | Impact Factor value: 7.211 | ISO 9001:2008 Certified Journal | Page 1143
Figure 1.3 shows the phenomenon of target masking. Theinterference power is 20 dB, the target in range bin 100 has an SNR of 15 dB, and the threshold is computed using 20 reference cells and a desired false alarm probability of 10-6.
However, a second target with an SNR of 20 dB in range bin 103 elevates the estimated interference power when the first target is in the test cell. This increase in threshold is sufficient to prevent the detection of the first target in this case. On the other hand, the 15 dB target does not affect the threshold enough to prevent the detection of the second target.
2. Modification to the CA CFAR
The performance limitation of CA CFAR caused by interfering targets led to numerous extensions to the CA CFAR concept, each designed to combat one or more effects. These techniques could be difficult to analyze exhaustively due to the many variations in clutter non-homogeneity, target and interfering target Signal to Noise Ratio (SNR), CFAR reference window size and CFAR detection logic. One such extension is the “Smallest-of Cell-Averaging CFAR”.
2.1 The Smallest–Of Cell-Averaging (SOCA) CFAR
Algorithm
One of the extensions to CA CFAR is the Smallest – Of Cell – Averaging CFAR (SOCA CFAR). SOCA CFAR was developed to remedy the deficiencies of CA CFAR in multiple target situations. When one target is contained in the CUT and another target appears in the reference cells at the same time, the SOCA CFAR suppresses the presence of the target in the reference cells by estimating both the lagging and the leading window samples and selects the smaller of the two average estimations. The architecture of SOCA CFAR is shown in Figure 2.1. If a secondary target intolerably increases the average power of the leading or lagging window, then SOCA CFAR simply takes the smaller of the two [3]. This technique is intended to combat the target masking effect caused by an interfering target present in the CFAR reference cells.
Figure 2.1: Architecture of SOCA CFAR Processor
In an N – cell SOCA approach, the leading and lagging windows are averaged separately to create two independent estimates and , each based on reference cells. The threshold is then computed from the smaller of the two estimates.
(2.1)
If an interfering target is present in one of the two windows, it will raise the interference power estimate in that window. Thus, the lesser of the two estimates is more likely to be representative of the true interference level and thus it is used to set the threshold.
Because the interference power is estimated from cells instead of cells, the threshold multiplier required for a given design value of increases. So it could be
concluded that the threshold multiplier for SOCA
CFAR could be calculated using the Equation (2.2)
(2.2)
However, a more careful analysis shows that the required multiplier is the solution of the Equation (2.3) as given in [3].
( )
{
∑ ( ) (
)
}
(2.3)
This Equation (2.3) is solved iteratively. For example, for
and , =11.276, and the CA CFAR
multiplier is for the same conditions.
© 2019, IRJET | Impact Factor value: 7.211 | ISO 9001:2008 Certified Journal | Page 1144
Figure 2.2 compares the behaviour of conventional CACFAR and SOCA CFAR on simulated data containing two closely-spaced targets of 15 dB and 20 dB. The leading and lagging windows are both 10 ( =20), and there is one guard cell to each side of the CUT. The CA CFAR masks the weaker of the two closely spaced targets. The SOCA CFAR threshold, however, easily allows the detection of both targets.
3. Simulation Results
Simulations are carried out using MATLAB to plot the effect of interfering target on cell averaging CFAR, detection performance of cell averaging CFAR, smallest – of cell averaging CFAR and the comparison of detection performances of cell averaging and smallest – of cell averaging CFAR approaches.
3.1 Effect of interfering target
Considering a single interfering target with power that contaminates only one of the CFAR reference cells. The SNR of this interfering target is
(3.1)
The expected value of the new threshold will be
{ } { ( ∑
)}
( ) (3.2)
Thus, { } is again a multiple of the interference power according to , but with a new threshold multiplier given by
( ) (3.3)
The elevated threshold decreases both the probability of detection ( ) and the probability of false alarm ( ). So
the new value of the detection probability in terms of the original design value of is
* ( ) (
)+
(3.4)
In Equation (3.4), if (no interfering target) or (target influence becomes negligible), then
.
Another way to characterize the effect of an interfering target is by the increase in SNR required to maintain the original value of . Let be the value of SNR required to attain the original using the elevated threshold . Then Equation (3.5) below expresses in terms of the original value of and the threshold multiplier .
(
)
(3.5)
Approximately, the same relationship can be applied to determine the probability of detection with the threshold multiplier and SNR .
Thus, equals if
(3.6)
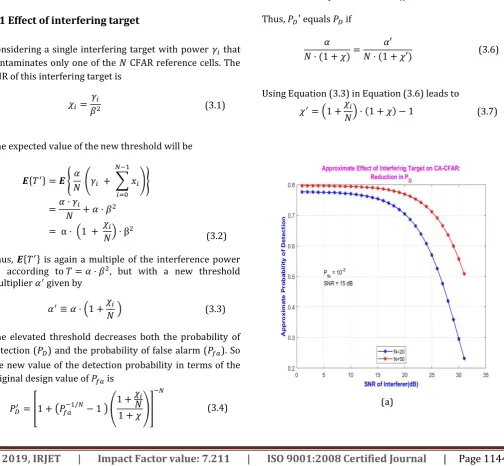
Using Equation (3.3) in Equation (3.6) leads to
( ) (3.7)
[image:4.595.46.551.328.794.2]© 2019, IRJET | Impact Factor value: 7.211 | ISO 9001:2008 Certified Journal | Page 1145
(b)Figure 3.1: Approximate Effect of Interfering Target on CA CFAR. Threshold Set for : (a) Reduction in ;
(b) Equivalent Masking Loss.
Figure 3.1 is based on the Equation (3.7). The equation is simulated in MATLAB for and N = 20 and N =
50 cells. Figure 3.1(a) shows the effect of interfering target on CA CFAR performance. The plot shows that the probability of detection reduces with interfering target.
Figure 3.1(b) plots the approximate target masking loss for the same conditions as in Figure 3.1(a), and it shows that the masking loss increases with SNR of interfering target, but with more range cells, the loss can be reduced.
3.2 Detection Performance
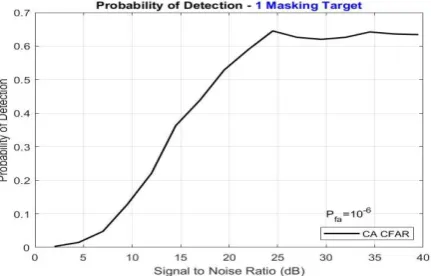
Figure 3.2 shows the probability of detection versus Signal-to-Noise Ratio curve of CA CFAR in multiple target situation. Figure 3.3 shows the probability of detection versus Signal-to-Noise Ratio curve of SOCA CFAR in multiple target situation.
Figure 3.2: Detection Performance of CA CFAR in Multiple Target Case
Figure 3.3 Detection Performance of SOCA CFAR in Multiple Target Case
Figure 3.4: Comparison of Detection Performance of CA CFAR and SOCA CFAR in Multiple Target Case
Figure 3.4 compares the probability of detection versus Signal-to-Noise Ratio curve for cell averaging CFAR and smallest – of cell averaging CFAR in multiple target case. Both the curves are obtained for a same probability of false alarm of .
[image:5.595.51.267.587.725.2]© 2019, IRJET | Impact Factor value: 7.211 | ISO 9001:2008 Certified Journal | Page 1146
4. CONCLUSIONS
The Cell – Averaging CFAR (CA CFAR) approach proves to be good in homogeneous and single target situations. But when adjacent targets are present in the reference window, the noise level estimation leads to an increase in the detection threshold and degradation in detection performance. All of these problems are studied and simulated in MATLAB to obtain the respective plots.
To tackle these problems with the CA CFAR approach a modified approach, called as the Smallest – Of Cell – Averaging CFAR (SOCA CFAR) approach, is used. This approach successfully tackles the multiple target problems found in CA CFAR. The performance of SOCA CFAR is plot using MATLAB and it is concluded that the SOCA CFAR performs much better than the CA CFAR in multiple target situations.
REFERENCES
[1] H. M. Finn and R. S. Johnson” Adaptive detection mode
with threshold control as a function of spatially sampled clutter estimates”, RCA Review, vol.29, no.3, pp. 414–464, 1968,
[2] Hermann Rohling, “RADAR CFAR Thresholding in
Clutter and Multiple Target Situations”, IEEE Transactions on aerospace and electronic systems, vol. AES-19, no. 4, pp. 608-620, July 1983.
[3] https://in.mathworks.com/help/phased/examples/c
onstant-false-alarm-rate-cfar-detection.html.
[4] M. A. Richards, “Fundamentals of Radar Signal
Processing”, Professional Engineering, McGraw-Hill, 2005
[5] D. K. Barton, “Modern Radar System Analysis”, Artech