© 2019, IRJET | Impact Factor value: 7.211 | ISO 9001:2008 Certified Journal | Page 5178
Disease Prediction System
Sarthak Khurana
1, Atishay Jain
2, Shikhar Kataria
3,
Kunal Bhasin
4, Sunny Arora
51,2,3,4
Students, IT Department, Dr. Akhilesh Das Gupta Institute of Technology & Management, Delhi, India
5
Assistant Professor, IT Department, Dr. Akhilesh Das Gupta Institute of Technology & Management, Delhi, India
---***---Abstract -
The world is moving with a fast speed and in Order to keep up ourselves with the whole world we tend to ignore the
symptoms of disease which can affect our health at a large extent. Many working professional’s get heart attack, bad cholesterol, eye disease and they are unable treat it at right time as they are busy coping up with progressive world. God has granted each and every individual a beautiful gift called life, so it is our responsibility to live our life to fullest and try to stay safe from the dangers of the world. So we have developed a logistic regression model with the help of machine learning algorithms like decision tree, random forest and naïve Bayes which take into account the symptoms felt by person and according to that symptoms it predicts the disease which the person can be suffering from. It saves time as well as makes it easy to get a warning about your health before it’s too late.Key Words: Logistic Regression, Decision tree, Random Forest, Naive Bayes Algorithm, Python
1. INTRODUCTION
Our project is based on disease prediction according to the symptoms shown by the patient. This model which we have built comes under the umbrella of data analysis. For this we are using python as a platform to run our machine learning algorithms. The first step to any analysis is to decide the problem we want to solve. Then getting the dataset to work on .Then we visualize our data with the help of scatter plot or any different plot and see it on an excel file by doing this we can the redundancy in our data i.e. outliers, missing values etc. Then we treat our data by replacing the missing values, as python is a case sensitive programing language we transform all the letters into capital. Creating dummy variables to sort our data into mutually exclusive categories also the no of dummy variables should be less than the no of categories of a qualitative variable. Also many people do the mistake of replacing the missing values with mean of that variable but by doing so you can miss very important variations in the data.
2. LITERATURE SURVEY
2.1 Comparative Analysis
In the paper “Disease Prediction System using data mining techniques”[1] the author has discussed about the data mining techniques like association rule mining, classification, clustering to analyse the different kinds of heart based problems. The database used contain collection of records, each with a single class label, a classifier performs a brief and clear definition for each class that can be used to classify successive records. The data classification depends on MAFIA algorithms that cause accuracy, the info is calculable exploitation entropy primarily based cross validations and partition techniques and also the results are compared. C4.5 algorithmic rule is employed because the coaching algorithmic rule to indicate rank of attack with the choice tree. The heart unwellness information is clustered mistreatment the K-means clump algorithmic rule, which will remove the data applicable to heart attack from the database. Some limitations square measure faced by the system like, time complexity is more due to DFS traversal, C4.5- Time complexity increases while searching for insignificant branches and lastly no precautions are defined.
© 2019, IRJET | Impact Factor value: 7.211 | ISO 9001:2008 Certified Journal | Page 5179
The paper “Predicting Disease by Using Data Mining Based on Healthcare Information System” [4] applies the information mining process to predict high blood pressure from patient medical records with eight alternative diseases. The data was extracted from a true world health care system info containing medical records. Under- sampling technique has been applied to come up with coaching knowledge sets, and data processing tool wood hen has been wont to generate the Naive Bayesian and J-48 classifiers created to improve the prediction performance, and rough set tools were wont to scale back the ensemble supported the concept of second- order approximation. Experimental results showed a bit improvement of the ensemble approach over pure Naive Bayesian and J-48 in accuracy, sensitivity and F-measure. Initially they'd a classification and so ensemble the classifiers and so the reduction of Ensemble Classifiers is employed. But the choice trees generated by J-48 is typically lacking within the leveling therefore the overall improvement of victimization ensemble approach is a smaller amount.The paper “An approach to devise an Interactive software solution for smart health prediction using data mining” [5] aims in developing a computerized system to check and maintain your health by knowing the symptoms. It has a symptom checker module which actually defines our body structure and gives us liability to select the affected area and checkout the symptoms. Technologies implemented in this paper are: The front end is designed with help of HTML, Java Script and CSS. The back end is designed using MySQL which is used to design the databases. This paper also contains the information of testing like Alpha testing which is done at server side or we can say at the developer's end, this is an actual testing done with potential users or as an independent testing process at server end. And Beta testing is done after performing alpha testing, versions of a system or software known as beta versions are given to a specific audience outside the programming team. Only the limitation of this paper is it suggests only the award winning doctors and not the nearby doctors to the patient.
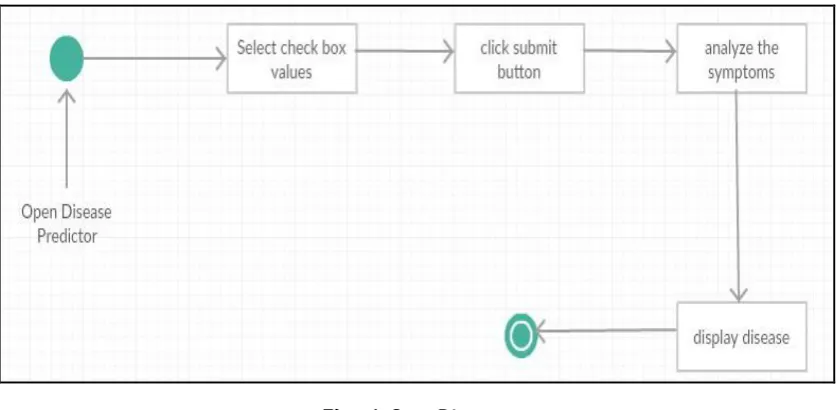
[image:2.595.89.509.351.556.2]3. PROPOSED WORK
Fig – 1: State Diagram
We are predicting a disease which a person is suffering from depending upon the symptoms he or she is suffering. Here we take five symptoms from the patient and evaluate them by using algorithms such as Random Forest , Decision Tree, Naïve Bayes.
Steps of model building:
i. Objective
We want to predict the disease suffered by a patient depending upon the symptoms.
ii. Collecting data
© 2019, IRJET | Impact Factor value: 7.211 | ISO 9001:2008 Certified Journal | Page 5180
iii. Preparing the dataAny analytical process thrives on the quality of the data used. One needs to spend time determining the quality of data and then taking steps for fixing issues such as missing data and treatment of outliers. Exploratory analysis is perhaps one method to study the nuances of the data in details thereby burgeoning the nutritional content.
iv. Training a model
This step involves choosing the appropriate algorithm and representation of data in the form of the model. The cleaned data is split into two parts – train and test (proportion depending on the prerequisites); the first part (training data) is used for developing the model. The second part (test data), is used as a reference.
v. Evaluating the model
To test the accuracy, the second part of the data (holdout / test data) is used. This step determines the precision in the choice of the algorithm based on the outcome. A better test to check accuracy of model is to see its performance on data which was not used at all during model build.
vi. Improving the performance
This step might involve choosing a different model altogether or introducing more variables to augment the efficiency. That’s why significant amount of time needs to be spent in data collection and preparation.
3.1 Model Validation
Accuracy= (TP+TN)/ Total n
Miss Classification = (FP+FN)/n
True positive rate = TP/ (FN+TP)
False positive rate =FP/ (TN+FP)
TN FP
FN TP
Confusion matrix
Actual values vs. Predicted values
0 1
0
© 2019, IRJET | Impact Factor value: 7.211 | ISO 9001:2008 Certified Journal | Page 5181
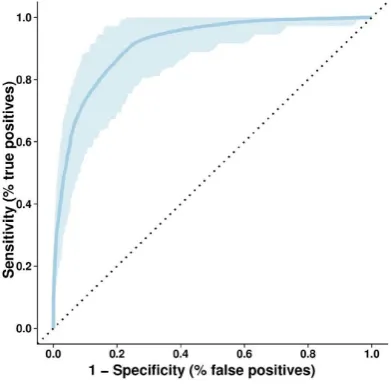
3.2 ROC Curve
Fig – 2: ROC Curve
4. METHODOLOGY
4.1 Decision Tree
It is a sort of supervised learning algorithmic program that's largely used for classification issues. Surprisingly, it works for each categorical and continuous dependent variable. In this algorithmic program, we tend to split the population into 2 or a lot of homogenized sets. This is done supported most vital attributes/ freelance variables to form as distinct teams as attainable. A tree has several analogies in real world, and seems that it's influenced a large space of machine learning, covering each classification and regression. In call analysis, a choice tree is wont to visually and expressly represent selections and higher cognitive process. As the name goes, it uses a tree-like model of decisions. Though a commonly used tool in data mining for deriving a strategy to reach a particular goal, it’s also widely used in machine learning. Once we completed modelling the Decision Tree classifier, we will use the trained model to predict whether the balance scale tip to the right or tip to the left or be balanced.
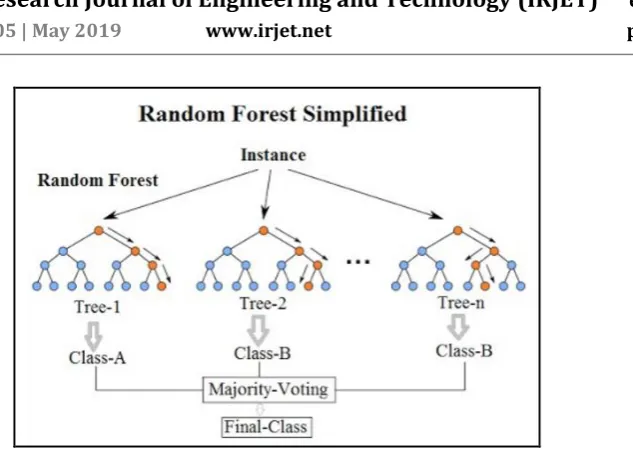
4.2 Random Forest
© 2019, IRJET | Impact Factor value: 7.211 | ISO 9001:2008 Certified Journal | Page 5182
Fig – 3: Random Forest4.3 Naive Bayes Algorithm
Naive Bayes algorithm is the algorithm that learns the probability of an object with certain features belonging to a particular group/class. For instance, if you are trying to identify a fruit based on its color, shape and taste, then an orange colored, spherical, and tangy fruit would most likely be an orange. All these properties individually contribute to the probability that this fruit is an orange and that is why it is known as “naive”. As for the “Bayes” part ,it refers to statistician and philosopher, Thomas Bayes and the theorem named after him , Bayes’ theorem , which is the base for Naïve Bayes Algorithm. More formally, Bayes ‘Theorem is stated as the following equation:
P(A/B) = (P(B/A)*P(A)) / P(B)
5. RESULTS
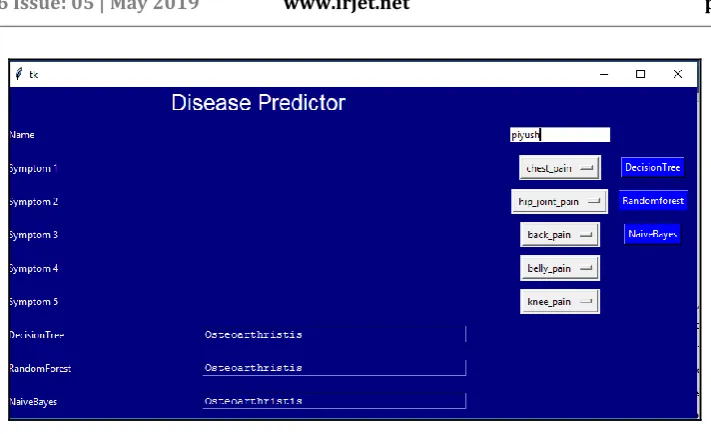
[image:5.595.123.477.458.644.2]© 2019, IRJET | Impact Factor value: 7.211 | ISO 9001:2008 Certified Journal | Page 5183
Fig – 5: Result Page6. CONCLUSION
The ultimate goal is to facilitate coordinated and well-informed health care systems capable of ensuring maximum patient satisfaction. In developing nations, predictive analytics are the next big idea in medicine –the next evolution in statistics – and roles will change as a result. Patients can get to become higher knowing and can get to assume a lot of responsibility for his or her own care, if they are to make use of the information derived. Physician roles can probably modification to a lot of an advisor than head, who will advise, warn and help individual patients. Physicians might notice a lot of joy in apply as positive outcomes increase and negative outcomes decrease. Perhaps time with individual patients can increase and physicians will another time have the time to create positive and lasting relationships with their patients. Time to assume, to interact, and to really help people; relationship formation is one of the reasons physicians say they went into medicine, and when these diminish, so does their satisfaction with their profession. Hospitals, pharmaceutical corporations and insurance suppliers can see changes furthermore. These changes which will virtually revolutionize the manner drugs are practiced for higher health and unwellness reduction.
FUTURE WORK
Every one of us would like to have a good medical care system and physicians are expected to be medical experts and take good decisions all the time. But it’s highly unlikely to memorize all the knowledge, patient history, records needed for every situation. Although they have all the massive amount of data and information; it’s difficult to compare and analyse the symptoms of all the diseases and predict the outcome. So, integrating information into patient’s personalized profile and performing an in-depth research is beyond the scope a physician. So the solution is ever heard of a personalized healthcare plan – exclusively crafted for an individual. Predictive analytics is the process to make predictions about the future by analyzing historical data. For health care, it would be convenient to make best decisions in case of every individual. Predictive modeling uses artificial intelligence to create a prediction from past records, trends, individuals, diseases and the model is deployed so that a new individual can get a prediction instantly. Health and Medicare units can use these predictive models to accurately assess when a patient can safely be released.
REFERENCES
[1] Aditya Tomar, “Disease Prediction System using data mining techniques”, in International Journal of Advanced Research in computer and Communication Engineering, ISO 3297, July 2016.
[2] Dr. B.Srinivasan, K.Pavya, “A study on data mining prediction techniques in healthcare sector”, in International Research Journal of Engineering and Technology (IRJET), March-2016.
[3] Megha Rathi, Vikas Pareek, “An integrated hybrid data mining approach for healthcare” , in IRACST - International Journal of Computer Science and Information Technology Security (IJCSITS), ISSN: 2249-9555 , Vol.6, No.6,Nov-Dec 2016.
© 2019, IRJET | Impact Factor value: 7.211 | ISO 9001:2008 Certified Journal | Page 5184
[5] M.A. Nishara Banu,B Gomathy, “An approach to devise an Interactive software solution for smart health prediction using data mining, in International Journal of Technical Research and Applications , eISSN, Nov-Dec 2013.[6] Al-Aidaroos, K., Bakar, A., & Othman, Z. (2012). Medical Data Classification with Naive Bayes Approach. Information Technology Journal.