of JUnit Tests in Seven Open Source Systems
Jean Petrić
University of HertfordshireHatfield, United Kingdom [email protected]
Tracy Hall
Brunel University London Uxbridge, United KingdomDavid Bowes
University of HertfordshireHatfield, United Kingdom [email protected]
ABSTRACT
Background:Newspaper headlines still regularly report latent software defects. Such defects have often evaded testing for many years. It remains difficult to identify how well a system has been tested. It also remains difficult to assess how successful at finding defects particular tests are. Coverage and mutation testing are fre-quently used to asses test effectiveness. We look more deeply at the performance of commonly used JUnit testing by assessing how much JUnit testing was done and how effective that testing was at detecting defects in seven open source systems.
Aim:We aim to identify whether defective code has been effectively tested by JUnit tests as non-defective code. We also aim to identify the characteristics of JUnit tests that are related to identifying defects.
Methodology:We first extract the defects from seven open source projects using the SZZ algorithm. We match those defects with JUnit tests to identify the proportion of defects that were covered by JUnit tests. We also do the same for non-defective code. We then use Principal Component Analysis and machine learning to investigate the characteristics of JUnit tests that were successful in identifying defects.
Results:Our findings suggest that most of the open source systems we investigated are under-tested. On average over 66% of defective methods were not linked to any JUnit tests. We show that the number of methods touched by a JUnit test is strongly related to that test uncovering a defect.
Conclusion:More JUnit tests need to be produced for the seven open source systems that we investigate. JUnit tests need to be relatively sophisticated, in particular they should touch more than just one method during the test.
KEYWORDS
Software testing, test effectiveness, JUnit tests
Permission to make digital or hard copies of all or part of this work for personal or classroom use is granted without fee provided that copies are not made or distributed for profit or commercial advantage and that copies bear this notice and the full citation on the first page. Copyrights for components of this work owned by others than the author(s) must be honored. Abstracting with credit is permitted. To copy otherwise, or republish, to post on servers or to redistribute to lists, requires prior specific permission and/or a fee. Request permissions from [email protected].
PROMISE’18, October 10, 2018, Oulu, Finland
© 2018 Copyright held by the owner/author(s). Publication rights licensed to Associa-tion for Computing Machinery.
ACM ISBN 978-1-4503-6593-2/18/10. . . $15.00 https://doi.org/10.1145/3273934.3273939
ACM Reference Format:
Jean Petrić, Tracy Hall, and David Bowes. 2018. How Effectively Is Defective Code Actually Tested? An Analysis of JUnit Tests in Seven Open Source Sys-tems. InThe 14th International Conference on Predictive Models and Data An-alytics in Software Engineering (PROMISE’18), October 10, 2018, Oulu, Finland. ACM, New York, NY, USA, 10 pages. https://doi.org/10.1145/3273934.3273939
1
INTRODUCTION
Effectively testing software remains problematic. Latent defects often evade testing and can remain dormant in the system for many years. A good example of this is the shut down of London airspace on a Friday afternoon in the run up to Christmas 2014. This shutdown affected some 240,000 passengers and was caused by a latent defect which had been in the code since the system was deployed in 1994. Testing had not uncover this defect.
In this paper we investigate the effectiveness of JUnit testing in seven open source Java systems. JUnit testing is a very common approach to generating tests for Java code. We divide our analysis into looking at the Java methods in each system in terms of four quadrants: 1) Defective methods that have not been JUnit tested 2) Defective methods that have been JUnit tested 3) Non-defective methods that have been JUnit tested 4) Non-defective methods that have not been JUnit tested. Using these quadrants we investigate whether there is any relationship between the JUnit testing of code and defects in that code. We then identify the features of successful JUnit tests.
establish the usefulness of each metric in terms of distinguishing effective from non-effective JUnit tests.
This study addresses two research questions:
RQ1.Are fewer defects found in code that has associated JUnit tests?
RQ2.What are the characteristics of effective JUnit tests?
Our contributions are as follows. We reveal that large numbers of defects are never covered by JUnit tests. No JUnit tests seem to have been run on large amounts of defective code. More JUnit testing is needed in the seven systems that we investigate.
We also report that the most influential characteristic of a JUnit test likely to detect a defect is the number of methods that test touches. More JUnit tests that touch multiple methods may be needed.
The rest of the paper is organised as follows. The next section discusses previous work in software testing, with a particular focus on test effectiveness. We then describe our methodology in Section 3, followed by reporting our results in Section 4 and discussion in Section 5. Finally threats to validity, and conclusions and future work are presented in Sections 6 and 7, respectively.
2
BACKGROUND
Software testing is an essential activity for ensuring software qual-ity. Substantial effort is expended on a variety of testing activities, such as the development and maintenance of test code [43]. eX-treme Programming, amongst other agile software development approaches, has put an growing emphasis on the importance of testing, “as a desirable and effective way to develop software” [29]. The importance of unit testing has meant the development of tools that can assist practitioners in the automated generation of unit tests [12]. Several studies have shown optimistic results using those test tools to improve test quality [13, 14]. However, detecting com-plex defects [2], and achieving effective automatically generated tests [32] remain challenges. These challenges may be mitigated by understanding what characteristics underpin those unit tests that are effective at detecting defects.
In software testing, a common approach to measuring test qual-ity is by calculating test suite effectiveness. Test effectiveness has traditionally been determined using the following process [19]. First, defective versions of programs get seeded into the system. This step is followed by creating test suites composed of available test cases. In the third stage, coverage of each test suite is measured based on a set of test goals. Finally, effectiveness is determined as the number of defective versions of subject programs that can be detected by a test suite [27]. Test cases that uncover these defective subject programs contribute to the positive effectiveness of test suites [18]. To be effective, therefore, test suites should be success-ful at identifying as many defective versions of covered subject programs as possible.
Two cornerstone techniques have been used for establishing test effectiveness: coverage and mutation testing. Traditionally, studies that use coverage usually aim to find a link between the amount of covered code and the number of detected defects [19, 42]. The underlying assumption is that tested code should be less prone to defects. Despite many efforts to determine whether coverage is a useful metric for effectiveness, consensus has not yet been reached.
Ahmed et al. found a weak but significant correlation between code coverage and the number of defects [1]. When looking at the correlation between code coverage and the probability of defects impacting a product unit, Mockus et al. showed that an increase in coverage proportionally reduces the number of defects [26]. However, other studies suggest that high coverage values do not necessarily correlate to test effectiveness. Inozemtseva and Holmes observed that many studies were done with adequate test suite sizes, which are rare in practice, and may lead to results that are not generalisable [19]. In addition, many studies used small subject programs that do not reflect systems in the real world (e.g. [11, 16]). By taking these shortcomings into account, and performing an experiment on large systems, they concluded that coverage is not a good proxy for effectiveness. Another large scale study, including 100 Java projects by Kochhar et al., established that coverage has an insignificant correlation with post-release defects [24]. Wei et al.’s empirical study also demonstrated that branch coverage is not a useful indicator of test effectiveness [40], whilst Tengeri et al. established that code coverage is rarely an indicator of the project’s defect density [36].
Mutation testing has also played a substantial role in assessing test effectiveness. Mutation testing relies on mutants that are auto-matically inserted into code. Mutants are created by making minor syntactical modifications to the subject program [44]. Good test cases should be capable of detecting such modifications. Although the process is usually automatic, some concerns have been raised about its usefulness to replace real world defects [15], and the risks to external validity when used incautiously [28]. Other researchers have been in favour of mutants as a suitable replacement for real defects [3, 21].
More recent studies have started analysing other factors that could influence test effectiveness. For example, the size of test suite has been shown to correlate with test suite effectiveness [27], where the size is measured by the number of tests in the test suite. Each added test increases the chance that a test will detect a new defect. Namin et al. showed that both, coverage and size, independently contribute to a test suite’s effectiveness with a non-liner relation-ship. Schwartz and Hetzel used over 20 different defect types to investigate if all have the same chance of being discovered. Evalu-ating six open source datasets, they found a subset of defect types being consistently missed by test suites [31].
The quality of test code itself has been shown to have an impact on test effectiveness. Waterloo et al. found several test code patterns can detect defects in tests with high precision [39]. Several studies have used test smells, which are poorly designed tests [38], and showed their negative impact on test maintenance, comprehension, and ultimately effectiveness. For example, some test smells influence code smells to appear in production code [37]. Bavota et al. did a large empirical study including over 20 systems to investigate the effect of test smells on test maintainability [6]. They found that some test smells pose a potential risk to test maintenance. Athanasiou et al. also empirically demonstrated that the quality of test code has a negative impact on production code [4].
covered code is related to fewer defect-fixes compared to non-covered code [5]. Bach et al. report that the distribution of defects in covered versus non-covered code is not uniform, and that more defects appear in code which has not been tested. However, it remained unclear how many “out of reach” defects remain in the non-tested code.
A priori knowledge about the characteristics of tests which are more likely to detect a defect is useful for test case prioritisation. In regression testing, test case prioritisation determines which tests should be executed first to potentially improve the defect detection rate [8]. Various prioritisation techniques have been proposed in the literature [20, 41], one of which is total function coverage. Total function coverage prioritises test cases by sorting them from the test invoking most to least number of functions [10]. The empirical study by Elbaum et al. demonstrated that total function coverage in some cases performs well [9].
3
EXPERIMENTAL DESIGN
3.1
Selection of Datasets
For this study we systematically selected seven Java open source projects from the GitHub repository. GitHub is one of the largest open source repositories commonly used in software engineering studies. We detail the steps for selecting the open source datasets used in this study:
(1) We identified an initial list of 5508 GitHub Java project candi-dates by selecting: a) Java project; b) with git version control system; c) has defect linking commits; d) has a defect track-ing system; e) has at least 100 fixed defects (we adopted this selection from [34]);
(2) From that initial list of 5508 projects, we selected the first 150 projects with the highest number of issues;
(3) Out of these 150 projects, we selected only Maven projects that have compilable test sets (since our tool operates on byte code); 22 projects remained after this step;
(4) Out of the 22 projects, we tried to collect JHawk data for each (needed to calculate our test metrics). JHawk was able to calculate metrics for 15 out of the 22 projects1;
(5) Three out of the 15 projects that JHawk could calculate were very small (less than 20 Java source code files), so we ignored those projects, ending up with 12 projects in this step; (6) Five out of the 12 remaining projects had less than three
[image:3.612.319.556.349.554.2]test methods which found defects. We ignored these projects which left 7 projects;
Table 1: OSS datasets selected for this analysis
Repo Commit MetCnt TestCnt MetDef
reddeer 3060878 4395 1159 426
gephi acf94e5 6750 238 163
nutz bb802d0 4818 1167 86
graylog2-server 3767534 5128 1612 79
OpenTripPlanner c53497a 4391 420 41
k 8ba6f16 3702 247 13
rultor b719e3e 353 164 7
1As JHawk is a proprietary software we could not fix the root cause of the problem.
Table 1 shows the seven datasets we selected. TheRepocolumn is the name of a GitHub project,Commitrepresents a snapshot commit,MetCntis a method count,TesCntis a test method count,
andMetDef is the number of defective methods. A snapshot commit
is a point in time at which all data was collected. In our study, each snapshot commit maps to a certain git commit of a project. For every project, we selected the first commit after the 1stof July 2017. We chose recent commits for snapshots as from our experience those are more likely to compile. The method and test counts were obtained with our in-house developed tool.
3.2
Data Extraction for Code Covered by JUnit
tests
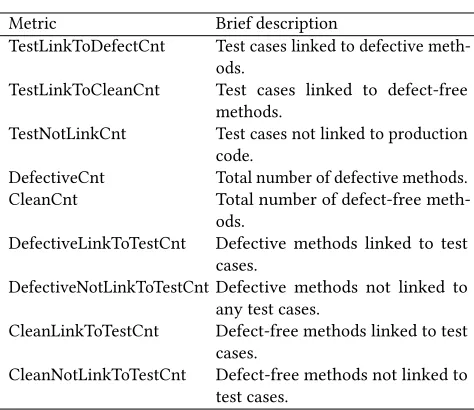
For each git project in Table 1 we first cloned a local copy to our machine. We then checkout the appropriate commit set in Table 1 before compiling each project. Each project was compiled by invoking ‘mvn test-compile’. The maven command compiles all production and test code, turning it into byte code. By using our in-house developed tool, we then extracted information about defects and how well JUnit tests links to production code. Table 2 contains the metrics we collected for answering the first research question.
Table 2: Test code metrics used in this study
Metric Brief description
TestLinkToDefectCnt Test cases linked to defective meth-ods.
TestLinkToCleanCnt Test cases linked to defect-free methods.
TestNotLinkCnt Test cases not linked to production code.
DefectiveCnt Total number of defective methods. CleanCnt Total number of defect-free
meth-ods.
DefectiveLinkToTestCnt Defective methods linked to test cases.
DefectiveNotLinkToTestCnt Defective methods not linked to any test cases.
CleanLinkToTestCnt Defect-free methods linked to test cases.
CleanNotLinkToTestCnt Defect-free methods not linked to test cases.
In this study we used the method level of granularity: a method in production code, and a test case in JUnit test code. A test case is a single Java method. We define covered defects as production methods that have been defective and have at least one test case invoking that method. We allowed the invocation of a production method from a test case to be transitive. In other words, any test case calling a defective method directly or indirectly counts as a test which covers that defective method. The transitive approach is similar to Kochhar et al. as they consider cases where a method is invoked either directly or indirectly by a test case [24].
[image:3.612.57.289.602.694.2]those production methods have been defective in the past, how-ever at the snapshot point they were defect-free. Other tests are never linked to any production methods. For example,tearDown()
or helper methods that appear in test code may never link to pro-duction code. We excluded empty methods from our analysis.
A single test case can invoke multiple methods. However, the same is true for a method, which can be linked to multiple tests. For this reason we recorded which production methods are associated with which tests. For example, if a defective method is called by a test(s), we record it as a defective method linked to a test. If the same was true for a defect-free method, then it would be a clean method linked to a test.
[image:4.612.57.296.370.552.2]3.3
Data Extraction for Test Effectiveness
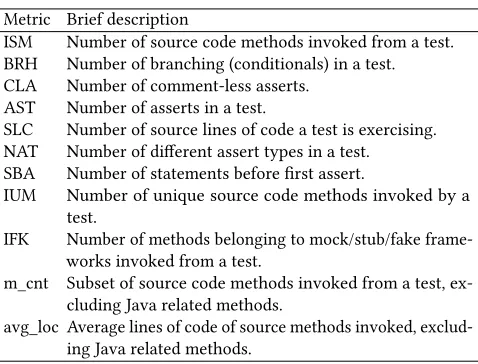
In this study we assessed test effectiveness in the following way. We ran our in-house developed tool over a previously compiled copy of each project, for the commits specified in Table 1. Table 3 shows the metrics which our tool recorded. We adapted these metrics from the testing principles defined in our previous work [7]. These metrics capture multiple facets of test quality and have been repeatedly used in the literature for the purpose of determining test quality. For that reason, we used them as independent predictors of test effectiveness in this work.Table 3: JUnit test metrics used in this study
Metric Brief description
ISM Number of source code methods invoked from a test. BRH Number of branching (conditionals) in a test. CLA Number of comment-less asserts.
AST Number of asserts in a test.
SLC Number of source lines of code a test is exercising. NAT Number of different assert types in a test.
SBA Number of statements before first assert.
IUM Number of unique source code methods invoked by a test.
IFK Number of methods belonging to mock/stub/fake frame-works invoked from a test.
m_cnt Subset of source code methods invoked from a test, ex-cluding Java related methods.
avg_loc Average lines of code of source methods invoked, exclud-ing Java related methods.
Our tool generated the following data: methods, tests invoking those methods, and the metrics described in Table 3. This data was then transformed into the following: We grouped every test by the number of production methods it invokes, and recorded this metric asm_cnt.m_cntdiffers from the ISM and IUM metrics described in Table 3 in respect thatm_cntis a subset of the two metrics.m_cnt
excludes method calls to Java library, such assize()andsort(). To calculate the effectiveness of tests, we then extracted defects from the subject systems using the SZZ algorithm (described in the next Section) and assigned ‘1’ to those methods that have been defective, and ‘0’ otherwise. For each test the effectiveness was calculated as a ratio between the number of defective and the total number of methods invoked. To distinguish between effective and
non-effective tests we used the Pareto principle [30]. We first sorted all tests by their effectiveness, classifying the top 20% of the tests as effective, and the bottom 80% as non-effective.
3.4
Extracting Defects
We determined defective methods by the defect insertion and fix points. To identify both, we used the SZZ approach [35] used in many previous studies. The SZZ algorithm matches the fix described in the bug tracking system with the corresponding commit in the version control system that removed the defect. By backtracking through the version control records, it is possible to identify earlier code changes which ended up being fixed. It is assumed that the earlier code changes inserted the defect if it occurred before the fault was reported. The module of code is therefore labelled as defective between the time the fault was inserted and the time it was fixed. Using this technique it is possible to identify, for a particular snapshot of the code, which methods were faulty and which are not. For each project we used GitHub’s issue tracking system.
3.5
Classification
We used machine learning to demonstrate the usefulness of the metrics listed in Table 3. We defined a classification problem with the metrics as independent variables, and effectiveness as a depen-dent variable. Effectiveness is a nominal dependepen-dent variable, where ‘1’ indicates a test in the top 20% of effectiveness, and ‘0’ for all other tests.
In this study we used three classifiers: Logistic Regression, Naïve Bayes and Random Forest. Logistic Regression is a simple classifier which does not require a linear relationship between the dependant and independent variables. This type of classifier finds the best weights for each independent variable to predict the dependent variable. Naïve Bayes is a commonly used classifier in machine learning which uses probabilities to make final predictions. Random Forest is an ensemble technique that combines several tree-based classifiers and uses their outputs to make final decisions. We chose these three classifiers as they work on different principles, and are commonly used in software engineering tasks that require machine learning algorithms.
We used the WEKA machine learning tool to perform our pre-dictions. For each dataset and learner we repeated the experiment 100 times using 10-fold cross validation. Repeating experiments 100 times and using cross validation should help reduce performance variance in different experimental runs.
To evaluate the usefulness of our models we used precision, recall, F-measure, and Matthews Correlation Coefficient (MCC) as performance indicators. All these performance measures are based on the confusion matrix shown in Table 4. Precision and recall
Table 4: Confusion matrix
Predicted effective Predicted non-effective Observed
effective
True Positive (TP)
False Negative (FN)
Observed non-effective
False Positive (FP)
are commonly used metrics in machine learning to interpret the usefulness of a prediction model:
Precision= T P
T P+F P
Recall= T P
T P+F N
F-measure represents the harmonic mean between precision and recall:
F−measure=2×Recall×Precision
Recall+Precision
In addition we used MCC as it takes all four quadrants of the confusion matrix into consideration:
MCC=p T P×T N−F P×F N
(T P+F P)(T P+F N)(T N+F P)(T N +F N)
MCC is a suitable performance measure when datasets are imbal-anced [33], as is the case in this study.
4
RESULTS
Overall our results show that a large number of defective methods are not covered by JUnit tests. For all systems we analysed, with the exception of reddeer, more than half of the defective methods were not covered by JUnit tests. In three out of the seven systems, the proportion of non-JUnit tested defective methods goes beyond 70%. In terms of the effectiveness of tests, our results suggest that the most successful tests to reveal defective methods are those which touch many methods.
RQ1. Are fewer defects found in code that has associated JU-nit tests?
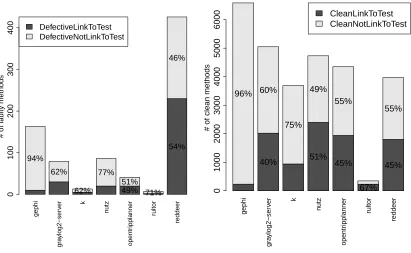
The left-hand side of Figure 1 shows the proportion of defective methods which are either covered or not covered by JUnit tests. Each stacked bar plot represents one project, whilst they-axis holds the absolute number of defective methods. The top part of each bar plot shows the proportion of defective methods not covered by tests, whilst the bottom part indicates those defective methods covered by a single or multiple tests. In all projects (exceptreddeer) the majority of defective methods were not covered by automated tests. The
gephisystem has a particularly low number of defective methods
that were covered (6%).Gephiis the project with the second highest number of defects (afterreddeer) compared to the other systems in our study (163 defects), which is nearly double the number of defects than the third most defective system in our study,nutz(86 defects). A similar lack of testing is found innutz, as the number of defective methods covered by JUnit tests is the second lowest amongst the analysed systems.
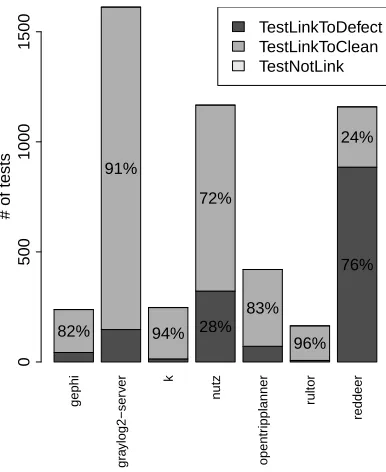
Figure 2 shows the linkage of tests towards production code methods. For all seven systems we did not find any tests not linked with production methods. On the other hand, we did find that the majority of JUnit tests do not cover defective methods. Three sys-tems have more than 90% of JUnit tests that do not cover defective methods. ForgephiandOpenTripPlannerthe percentage of JUnit tests not covering defective methods is above 80%. We acknowledge that JUnit covered non-defective methods may not contain defects as those components have been tested and the defects removed. However, it is concerning that the majority of historical defects never seem to get JUnit covered, as such coverage could decrease
the chance of these defects reappearing. Amongst the analysed projects,reddeeris the only exception where the number of JU-nit tests covering defective code is higher than the non-defective code (76%).Reddeeris also a system with the highest number of discovered defects.
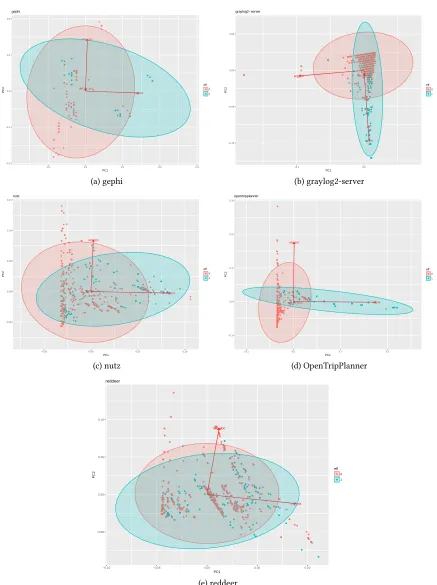
RQ2. What are the characteristics of effective tests? Figure 3 illustrates the first two components of PCA plots for five out of the seven systems. Two systems,kandrultor, were left out as they have less than 10 effective tests making it impossible to perform 10-fold cross validation. Each PCA plot contains two classes. Where blue coloured dots represent the top 20% of tests in terms of their effectiveness to cover defects, red coloured dots are the bottom 80%. Two out of the five systems show an apparent pattern of method count as a proxy for how effective tests are to cover defective methods. InOpenTripPlannerthe most effective tests to cover defects are those that cover a high number of methods, with no exceptions (Figure 3d). Similar is observed for
graylog2-serveras the highest concentration of effective tests follows the
direction of increase in method count (Figure 3b).Gephiseparates effective tests in two groups, where one group follows the trend of increase in method count (Figure 3a).Nutzon the other hand demonstrates mixed results for effective tests, however there is a slight tendency for more effective tests to cover more defective methods (Figure 3c). Finally,reddeeris an exception to the majority of our observations. Figure 3e shows that method count is not a useful indicator to distinguish between effective and non-effective tests. Contrary, amongst tests with the highest number of method calls are those that fit in the bottom 80% of effective tests.
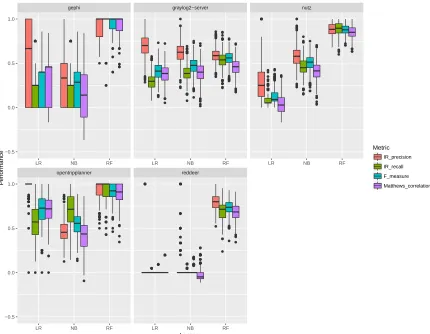
In addition to the PCA plots which show method count as a useful proxy for an effective test, we consider the use of machine learning to demonstrate the power of method count in predicting effective tests. Figure 4 demonstrates the prediction performances of three different machine learners in terms of precision, recall, F-measure, and MCC. The two systems,graylog2-serverand
Open-TripPlanner, which show a reasonable separation between effective
and non-effective tests on PCA, achieve relatively good prediction performances. In particular,OpenTripPlannerachieves a very high 0.725 (±0.134) MCC value when Logistic Regression is used as a predictor. In fact, a perfect precision of 0.988 (±0.058), recall of 0.599 (±0.180), and F-measure that shows the harmonic mean be-tween precision and recall of 0.729 (±0.149) were achieved. For
graylog2-serverthe learners achieved slightly lower results than for
OpenTripPlanner. This was expected asgraylog2-serverhas greater
mixture between the classes in the part where effective tests dom-inate. Nevertheless, all three learners achieved similar results in terms of MCC: 0.377 (±0.103) for Logistic Regression, 0.396 (±
0.101) for Naïve Bayes, and 0.458 (±0.086) for Random Forest. In terms of other datasets, Naïve Bayes achieved similar MCC perfor-mances tograylog2-serverwithnutz: 0.410 (±0.102). It is worth noting that machine learners frequently used in software defect prediction rarely achieve MCC values above 0.400.
gephi
gr
a
ylog2−ser
v
er k
n
utz
opentr
ipplanner
rultor
reddeer
# of f
aulty methods
0
100
200
300
400 DefectiveLinkToTest
DefectiveNotLinkToTest
49%
54% 94%
62%
62% 77%
51% 71%
46%
gephi
gr
a
ylog2−ser
v
er k
n
utz
opentr
ipplanner
rultor
reddeer
# of clean methods
0
1000
2000
3000
4000
5000
6000
CleanLinkToTest CleanNotLinkToTest
40% 51% 45%
67% 45% 96% 60%
75% 49%
55%
[image:6.612.101.512.87.340.2]55%
Figure 1: The proportion of defective and non-defective (clean) methods covered by tests
Table 5: Cross-over test effectiveness prediction with Random Forest
Train Test Precision Recall F-measure MCC
gephi nutz 0.329 0.718 0.451 0.284
gephi OpenTripPlanner 0.345 0.972 0.509 0.412
gephi reddeer 0.168 0.646 0.267 −0.147
nutz gephi 0.842 0.400 0.542 0.521
nutz OpenTripPlanner 0.255 0.194 0.220 0.058
nutz reddeer 0.178 0.469 0.258 −0.060
OpenTripPlanner gephi 0.667 0.150 0.245 0.254 OpenTripPlanner nutz 0.310 0.067 0.110 0.058 OpenTripPlanner reddeer 0.157 0.531 0.242 −0.160
reddeer gephi 0.583 0.175 0.269 0.243
reddeer OpenTripPlanner 0.404 0.958 0.568 0.484
reddeer nutz 0.269 0.487 0.347 0.131
0.376 0.481 0.336 0.173
(±0.215) (±0.304) (±0.147) (±0.232)
the cross-prediction approach, where we trained a learner on one dataset, and validated it on another dataset. For the training pur-poses we selected all four datasets that significantly outperform the other two classifiers:gephi,nutz,OpenTripPlannerandreddeer. As the validation set, we combined all the three remaining datasets. For example, whengephiwas used for the training,nutz,
OpenTrip-Plannerandreddeerwere used for the validation. All learners are
trained and validated under the same conditions.
The results from this cross-over prediction analysis are presented in Table 5 which shows that Whennutzwas used as a training set
andreddeeras a validation set, the prediction was no better than
random (MCC=-0.060). Similar was true whenreddeerserved as the training set, whilstnutz was a validation set (MCC=0.131). In both cases we could establish the likeliness of Random Forest over-fitting the results. On the other hand, Random Forest was exceptionally successful at predictinggephi’s effective tests when
[image:6.612.156.458.403.580.2]gephi
gr
a
ylog2−ser
v
er k
n
utz
opentr
ipplanner
rultor
reddeer
# of tests
0
500
1000
1500
TestLinkToDefect TestLinkToClean TestNotLink
28%
76%
82% 91%
94% 72%
83%
[image:7.612.76.269.86.322.2]96% 24%
Figure 2: The proportion of test cases linking to defective and non-defective methods
achieved when usingreddeeras a training set, and predictinggephi
(MCC=0.243). With the exclusion of the pairs (nutz, gephi) and
(reddeer, OpenTripPlanner), where the projects on the left were used
for training, and projects on the right for validation, Random Forest did not achieve the exceptional results as when the same dataset was used for training and validation. Although each project in our analysis is contextually very different from each other, the tendency of effective tests to cover a greater number of methods is present in multiple datasets. Therefore, we would expect Random Forest to achieve better prediction performances taking into account that it does remarkably well on the same dataset. As it is possible that the results from Random Forest are overinflated, we take a conservative approach by considering the other two learners.
5
DISCUSSION
Traditional unit tests usually cover limited functionality invoking only a small number of methods. This relative simplicity makes unit testing relatively cheap and easy, compared to other types of testing. Our results suggest that there is widespread under using of unit testing. In most of the seven systems that we investigated the majority of code did not have associated unit test code linked to it, which is in alignment with the previous findings by Kochhar et al. [23, 25]. This under testing of code represents a significant risk that systems will fail.
Our analysis also suggests that more defects are discovered when unit tests touch multiple methods. Given that defects are more likely to appear when the complexity of code increases, traditionally designed simple unit tests may be less effective than previously thought at detecting defects. The design of unit tests may need to be reconsidered.
Our results may offer some explanation as to why there is no consensus between studies investigating the effectiveness of code coverage. While covering as much code as possible with tests may be useful, our results suggest that tests should go beyond only coverage. Defects are less likely in simple code units and more likely in complex code units. Tests should be more sophisticated to try and detect defects in complex code. In particular our results suggest that unit tests should touch multiple code units, as defects seem to appear in the gaps between code units. However even simple unit tests are certainly useful as a first line of defence.
Our results suggest that many of the metrics that we use to evaluate the effectiveness of JUnit tests (Table 3) do not explain a test’s ability to detect a defect or not. These metrics may be useful to determine the code quality of unit tests as described in [7], however our analysis suggests that these metrics are not useful in relation to the defect detection capacity of tests. Method count is the only useful metric. This means there remains much work needed to identify the features of JUnit tests that underpin their effectiveness at detecting defects.
6
THREATS TO VALIDITY
Although we have been careful to avoid errors in our experiment, there are some potential threats to validity left in our study. We consider three types of threats to validity: construct, conclusion, and external validity.
To minimise threats imposed by construct validity, a study has “to establish correct operational measures for the concepts being studied” [22]. We mitigated this threat by carefully collecting defect data using the approach described in Section 3.4. For the tool that collects the test metrics described in Table 3 we wrote JUnit tests to validate its core functionalities. To ensure the correctness of links between production and test code, we have considered the links from production to test code and vice versa. Figures 1 and 2 demonstrate this, where Figure 2 shows that all tests have been linked to the production methods. We also acknowledge that some of the Java methods that we classified as clean may have previously contained a defect that had been detected by a unit test.
In relation to conclusion validity, which relies on the ability to draw statistically correct conclusions, we paid special care to properly calculate all performance measures. We also performed ad-ditional checks to establish whether Random Forest truly provides superior results, or whether that could be due to over–fitting.
m_cnt def_m_cnt
avg_loc
−0.2 −0.1 0.0 0.1 0.2
−0.1 0.0 0.1 0.2 0.3
PC1
PC2
eff
0 1
gephi
m_cnt def_m_cnt avg_loc
−0.10 −0.05 0.00 0.05
−0.1 0.0
PC1
PC2
eff
0 1
graylog2−server
(a) gephi (b) graylog2-server
m_cnt def_m_cnt
avg_loc
−0.05 0.00 0.05 0.10 0.15
−0.05 0.00 0.05 0.10
PC1
PC2
eff
0 1
nutz
m_cnt def_m_cnt
avg_loc
−0.1 0.0 0.1 0.2 0.3
−0.1 0.0 0.1 0.2
PC1
PC2
eff
0 1
opentripplanner
(c) nutz (d) OpenTripPlanner
m_cnt avg_loc
−0.05 0.00 0.05 0.10
−0.10 −0.05 0.00 0.05 0.10
PC1
PC2
eff
0 1 reddeer
[image:8.612.88.525.75.660.2](e) reddeer
opentripplanner reddeer
gephi graylog2−server nutz
LR NB RF LR NB RF
LR NB RF LR NB RF LR NB RF
−0.5 0.0 0.5 1.0
−0.5 0.0 0.5 1.0
Learner
P
erf
or
mance
Metric
[image:9.612.90.520.84.418.2]IR_precision IR_recall F_measure Matthews_correlation
Figure 4: Performance values for predicting test effectiveness on six datasets
systems cover different types of domains, and vary in size of tests to methods ratio, as well as by the number of defects.
7
CONCLUSIONS AND FUTURE WORK
We evaluated seven open source systems and found that on average the majority of defective methods never get invoked by JUnit tests. JUnit tests are relatively quick and easy tests to produce and it seems clear that more of these tests are needed in most of these seven systems. This finding is an immediate actionable finding for developers. As without any unit testing code is likely to be highly susceptible to failure.
Our results also suggest that JUnit tests become more effective when they touch a several methods. Such tests may be more likely to detect defects that occur when the complexity of code increases. Most of our models demonstrated good prediction performances when method count and average lines of code metrics are used as independent variables to predict the effectiveness of JUnit tests. This finding is an immediate actionable finding for developers. The design of unit tests should go beyond testing only within the method and additionally touch related methods.
None of the other unit test metrics that we used were good pre-dictors of unit tests detecting defects. There remains work needed
to identify more features of good unit tests. This finding is an im-mediate actionable finding for researchers. Identifying the features of unit tests that effectively detect defects, as well as the associated measures of those features, could make a significant difference to the number of latent defects affecting software.
In the future we plan to expand our analysis to more datasets, including commercial systems. We also intend to investigate alter-native test effectiveness measures to try and identify more metrics than the number of methods touched that we report here. We would also like to look in more detail at whether any relationships exist between defect types and the features of unit tests that detect those defect types.
REFERENCES
[1] Iftekhar Ahmed, Rahul Gopinath, Caius Brindescu, Alex Groce, and Carlos Jensen. 2016. Can Testedness Be Effectively Measured?. InProceedings of the 2016 24th ACM SIGSOFT International Symposium on Foundations of Software Engineering (FSE 2016). ACM, New York, NY, USA, 547–558. https://doi.org/10.1145/2950290. 2950324
[3] J. H. Andrews, L. C. Briand, and Y. Labiche. 2005. Is mutation an appropriate tool for testing experiments? [software testing]. InProceedings. 27th International Conference on Software Engineering, 2005. ICSE 2005.402–411. https://doi.org/10. 1109/ICSE.2005.1553583
[4] D. Athanasiou, A. Nugroho, J. Visser, and A. Zaidman. 2014. Test Code Quality and Its Relation to Issue Handling Performance.IEEE Transactions on Software En-gineering40, 11 (Nov 2014), 1100–1125. https://doi.org/10.1109/TSE.2014.2342227 [5] T. Bach, A. Andrzejak, R. Pannemans, and D. Lo. 2017. The Impact of Coverage on Bug Density in a Large Industrial Software Project. In2017 ACM/IEEE Inter-national Symposium on Empirical Software Engineering and Measurement (ESEM). 307–313. https://doi.org/10.1109/ESEM.2017.44
[6] Gabriele Bavota, Abdallah Qusef, Rocco Oliveto, Andrea De Lucia, and Dave Binkley. 2015. Are test smells really harmful? An empirical study.Empirical Software Engineering20, 4 (01 Aug 2015), 1052–1094. https://doi.org/10.1007/ s10664-014-9313-0
[7] David Bowes, Tracy Hall, Jean Petrić, Thomas Shippey, and Burak Turhan. 2017. How Good Are My Tests?. InProceedings of the 8th Workshop on Emerging Trends in Software Metrics (WETSoM ’17). IEEE Press, Piscataway, NJ, USA, 9–14. https: //doi.org/10.1109/WETSoM.2017..2
[8] H. Do, G. Rothermel, and A. Kinneer. 2004. Empirical studies of test case pri-oritization in a JUnit testing environment. In15th International Symposium on Software Reliability Engineering. 113–124. https://doi.org/10.1109/ISSRE.2004.18 [9] S. Elbaum, A. G. Malishevsky, and G. Rothermel. 2002. Test case prioritization: a family of empirical studies.IEEE Transactions on Software Engineering28, 2 (Feb 2002), 159–182. https://doi.org/10.1109/32.988497
[10] Sebastian Elbaum, Gregg Rothermel, Satya Kanduri, and Alexey G. Malishevsky. 2004. Selecting a Cost-Effective Test Case Prioritization Technique.Software Qual-ity Journal(2004), 185–210. https://doi.org/10.1023/B:SQJO.0000034708.84524.22 [11] P. G. Frankl and S. N. Weiss. 1993. An experimental comparison of the effec-tiveness of branch testing and data flow testing.IEEE Transactions on Software Engineering19, 8 (Aug 1993), 774–787. https://doi.org/10.1109/32.238581 [12] Gordon Fraser and Andrea Arcuri. 2011. EvoSuite: Automatic Test Suite
Gen-eration for Object-oriented Software. InProceedings of the 19th ACM SIGSOFT Symposium and the 13th European Conference on Foundations of Software Engi-neering (ESEC/FSE ’11). ACM, New York, NY, USA, 416–419. https://doi.org/10. 1145/2025113.2025179
[13] Gordon Fraser and Andrea Arcuri. 2014. A Large-Scale Evaluation of Automated Unit Test Generation Using EvoSuite.ACM Trans. Softw. Eng. Methodol.24, 2, Article 8 (Dec. 2014), 42 pages. https://doi.org/10.1145/2685612
[14] Gordon Fraser and Andrea Arcuri. 2015. 1600 faults in 100 projects: automatically finding faults while achieving high coverage with EvoSuite.Empirical Software En-gineering20, 3 (01 Jun 2015), 611–639. https://doi.org/10.1007/s10664-013-9288-2 [15] R. Gopinath, C. Jensen, and A. Groce. 2014. Mutations: How Close are they to Real Faults?. In2014 IEEE 25th International Symposium on Software Reliability Engineering. 189–200. https://doi.org/10.1109/ISSRE.2014.40
[16] Atul Gupta and Pankaj Jalote. 2008. An approach for experimentally evaluating effectiveness and efficiency of coverage criteria for software testing.International Journal on Software Tools for Technology Transfer10, 2 (01 Mar 2008), 145–160. https://doi.org/10.1007/s10009-007-0059-5
[17] Mark Hall, Eibe Frank, Geoffrey Holmes, Bernhard Pfahringer, Peter Reutemann, and Ian H. Witten. 2009. The WEKA Data Mining Software: An Update.SIGKDD Explor. Newsl.11, 1 (Nov. 2009), 10–18. https://doi.org/10.1145/1656274.1656278 [18] Monica Hutchins, Herb Foster, Tarak Goradia, and Thomas Ostrand. 1994. Exper-iments of the Effectiveness of Dataflow- and Controlflow-based Test Adequacy Criteria. InProceedings of the 16th International Conference on Software Engineer-ing (ICSE ’94). IEEE Computer Society Press, Los Alamitos, CA, USA, 191–200. http://dl.acm.org/citation.cfm?id=257734.257766
[19] Laura Inozemtseva and Reid Holmes. 2014. Coverage is Not Strongly Correlated with Test Suite Effectiveness. InProceedings of the 36th International Conference on Software Engineering (ICSE 2014). ACM, New York, NY, USA, 435–445. https: //doi.org/10.1145/2568225.2568271
[20] J. A. Jones and M. J. Harrold. 2003. Test-suite reduction and prioritization for modified condition/decision coverage.IEEE Transactions on Software Engineering
29, 3 (March 2003), 195–209. https://doi.org/10.1109/TSE.2003.1183927 [21] René Just, Darioush Jalali, Laura Inozemtseva, Michael D. Ernst, Reid Holmes, and
Gordon Fraser. 2014. Are Mutants a Valid Substitute for Real Faults in Software Testing?. InProceedings of the 22Nd ACM SIGSOFT International Symposium on Foundations of Software Engineering (FSE 2014). ACM, New York, NY, USA, 654–665. https://doi.org/10.1145/2635868.2635929
[22] B. Kitchenham, L. Pickard, and S. L. Pfleeger. 1995. Case studies for method and tool evaluation.IEEE Software12, 4 (Jul 1995), 52–62. https://doi.org/10.1109/52. 391832
[23] P. S. Kochhar, T. F. Bissyandé, D. Lo, and L. Jiang. 2013. An Empirical Study of Adoption of Software Testing in Open Source Projects. In2013 13th International Conference on Quality Software. 103–112. https://doi.org/10.1109/QSIC.2013.57 [24] P. S. Kochhar, D. Lo, J. Lawall, and N. Nagappan. 2017. Code Coverage and
Postre-lease Defects: A Large-Scale Study on Open Source Projects.IEEE Transactions on Reliability66, 4 (Dec 2017), 1213–1228. https://doi.org/10.1109/TR.2017.2727062
[25] P. S. Kochhar, F. Thung, N. Nagappan, T. Zimmermann, and D. Lo. 2015. Un-derstanding the Test Automation Culture of App Developers. In2015 IEEE 8th International Conference on Software Testing, Verification and Validation (ICST). 1–10. https://doi.org/10.1109/ICST.2015.7102609
[26] A. Mockus, N. Nagappan, and T. T. Dinh-Trong. 2009. Test coverage and post-verification defects: A multiple case study. In3rd International Symposium on Empirical Software Engineering and Measurement. 291–301. https://doi.org/10. 1109/ESEM.2009.5315981
[27] Akbar Siami Namin and James H. Andrews. 2009. The Influence of Size and Coverage on Test Suite Effectiveness. InProceedings of the Eighteenth International Symposium on Software Testing and Analysis (ISSTA ’09). ACM, New York, NY, USA, 57–68. https://doi.org/10.1145/1572272.1572280
[28] Akbar Siami Namin and Sahitya Kakarla. 2011. The Use of Mutation in Testing Experiments and Its Sensitivity to External Threats. InProceedings of the 2011 International Symposium on Software Testing and Analysis (ISSTA ’11). ACM, New York, NY, USA, 342–352. https://doi.org/10.1145/2001420.2001461
[29] Michael Olan. 2003. Unit Testing: Test Early, Test Often.J. Comput. Sci. Coll.19, 2 (Dec. 2003), 319–328. http://dl.acm.org/citation.cfm?id=948785.948830 [30] F John Reh. 2005. Pareto’s principle-The 80-20 rule.BUSINESS CREDIT-NEW
YORK THEN COLUMBIA MD-107, 7 (2005), 76.
[31] A. Schwartz and M. Hetzel. 2016. The Impact of Fault Type on the Relationship between Code Coverage and Fault Detection. In2016 IEEE/ACM 11th International Workshop in Automation of Software Test (AST). 29–35. https://doi.org/10.1109/ AST.2016.013
[32] S. Shamshiri, R. Just, J. M. Rojas, G. Fraser, P. McMinn, and A. Arcuri. 2015. Do Automatically Generated Unit Tests Find Real Faults? An Empirical Study of Effectiveness and Challenges (T). In2015 30th IEEE/ACM International Conference on Automated Software Engineering (ASE). 201–211. https://doi.org/10.1109/ASE. 2015.86
[33] M. Shepperd, D. Bowes, and T. Hall. 2014. Researcher Bias: The Use of Machine Learning in Software Defect Prediction.IEEE Transactions on Software Engineering
40, 6 (June 2014), 603–616. https://doi.org/10.1109/TSE.2014.2322358 [34] Thomas Shippey, Tracy Hall, Steve Counsell, and David Bowes. 2016. So You
Need More Method Level Datasets for Your Software Defect Prediction?: Voilà!. In
Proceedings of the 10th ACM/IEEE International Symposium on Empirical Software Engineering and Measurement (ESEM ’16). ACM, New York, NY, USA, Article 12, 6 pages. https://doi.org/10.1145/2961111.2962620
[35] Jacek Śliwerski, Thomas Zimmermann, and Andreas Zeller. 2005. When Do Changes Induce Fixes?. InProceedings of the 2005 International Workshop on Mining Software Repositories (MSR ’05). ACM, New York, NY, USA, 1–5. https: //doi.org/10.1145/1082983.1083147
[36] D. Tengeri, L. Vidács, Á. Beszédes, J. Jász, G. Balogh, B. Vancsics, and T. Gyimóthy. 2016. Relating Code Coverage, Mutation Score and Test Suite Reducibility to Defect Density. In2016 IEEE Ninth International Conference on Software Testing, Verification and Validation Workshops (ICSTW). 174–179. https://doi.org/10.1109/ ICSTW.2016.25
[37] Michele Tufano, Fabio Palomba, Gabriele Bavota, Massimiliano Di Penta, Rocco Oliveto, Andrea De Lucia, and Denys Poshyvanyk. 2016. An Empirical Inves-tigation into the Nature of Test Smells. InProceedings of the 31st IEEE/ACM International Conference on Automated Software Engineering (ASE 2016). ACM, New York, NY, USA, 4–15. https://doi.org/10.1145/2970276.2970340
[38] Arie Van Deursen, Leon Moonen, Alex van den Bergh, and Gerard Kok. 2001. Refactoring test code. InProceedings of the 2nd international conference on extreme programming and flexible processes in software engineering (XP2001). 92–95. [39] M. Waterloo, S. Person, and S. Elbaum. 2015. Test Analysis: Searching for Faults in
Tests (N). In2015 30th IEEE/ACM International Conference on Automated Software Engineering (ASE). 149–154. https://doi.org/10.1109/ASE.2015.37
[40] Yi Wei, Bertrand Meyer, and Manuel Oriol. 2012. Is Branch Coverage a Good Measure of Testing Effectiveness?Springer Berlin Heidelberg, Berlin, Heidelberg, 194–212. https://doi.org/10.1007/978-3-642-25231-0_5
[41] W. E. Wong, J. R. Horgan, S. London, and H. Agrawal. 1997. A study of effective regression testing in practice. InProceedings The Eighth International Symposium on Software Reliability Engineering. 264–274. https://doi.org/10.1109/ISSRE.1997. 630875
[42] W. E. Wong, J. R. Horgan, S. London, and A. P. Mathur. 1994. Effect of test set size and block coverage on the fault detection effectiveness. InProceedings of 1994 IEEE International Symposium on Software Reliability Engineering. 230–238. https://doi.org/10.1109/ISSRE.1994.341379
[43] Vahid Garousi Yusifoğlu, Yasaman Amannejad, and Aysu Betin Can. 2015. Soft-ware test-code engineering: A systematic mapping.Information and Software Technology58 (2015), 123 – 147. https://doi.org/10.1016/j.infsof.2014.06.009 [44] Lingming Zhang, Darko Marinov, and Sarfraz Khurshid. 2013. Faster Mutation