community composition in a tropical forest
Benita C. Laird-Hopkins1*,Laëtitia M. Bréchet1, Biancolini Castro Trujillo2, and Emma J.
Sayer1,2,3
1 Lancaster Environment Centre, Lancaster University, Lancaster, LA1 4YQ, UK.
2 Smithsonian Tropical Research Institute, P.O. Box 0843-03092, Balboa, Ancon, Panama, Rep.
Panama.
3 School of Environment, Earth and Ecosystems, The Open University, Walton Hall, Milton
Keynes, MK7 6AA, UK.
*Corresponding author; current address: Smithsonian Tropical Research Institute, P.O. Box
0843-03092, Balboa, Ancon, Panama, Rep. Panama; email: [email protected]
Disturbance can alter tree species and functional diversity in tropical forests, which in turn could
2
affect carbon and nutrient cycling via the decomposition of plant litter. However, the influence of
3
tropical tree diversity on forest floor organisms and the processes they mediate are far from clear.
4
We investigated the influence of different litter mixtures on arthropod communities and
5
decomposition processes in a 60-year old lowland tropical forest in Panama, Central America.
6
We used litter mixtures representing pioneer and old-growth tree species in experimental
7
mesocosms to assess the links between litter types, decomposition rates, and litter arthropod
8
communities. Overall, pioneer species litter decomposed most rapidly and old-growth species
9
litter decomposed the slowest but there were clear non-additive effects of litter mixtures
10
containing both functional groups. We observed distinct arthropod communities in different litter
11
mixtures at six months, with greater arthropod diversity and abundance in litter from old-growth
12
forest species. By comparing the decay of different litter mixtures in mesocosms and
13
conventional litterbags, we demonstrated that our mesocosms represent an effective approach to
14
link studies of litter decomposition and arthropod communities. Our results indicate that changes
15
in the functional diversity of litter could have wider implications for arthropod communities and
16
ecosystem functioning in tropical forests.
1
Keywords: soil fauna; pioneer; old-growth; Panama; carbon dynamics; mesocosm; non-additive
18
effects.
2
THE DECOMPOSITION OF PLANT MATERIAL IS CENTRAL TO ECOSYSTEM FUNCTIONING because it
20
underpins the cycling of carbon and nutrients (Swift et al. 1979, Cadish & Giller 1997), which in
21
turn influences plant growth and carbon storage (Wardle 2002, Bardgett 2005). Much research
22
has focused on understanding the interactions between plants and soil microbial communities, as
23
these will be key to determining the effect of anthropogenic change on ecosystem processes
24
(Hättenschwiler et al. 2005). However, soil and litter invertebrate communities also play an
25
important role in litter decomposition but very little is known about how litter diversity and
26
arthropod communities interact during decomposition processes – especially in tropical forests.
27
The activity of soil invertebrates indirectly affects the resources available to
28
microorganisms and plants (Giller 1996, De Deyn et al. 2004, Ashford et al. 2013). The
29
comminution of leaf litter by soil invertebrates stimulates decomposition by increasing leaching
30
and exposing a greater leaf surface area to microbial attack (Ashford et al. 2013). The
31
mineralization of organic matter is enhanced by arthropod species richness (Nielsen et al. 2011,
32
Ashford et al. 2013) and previous work demonstrates that litter arthropod diversity is related to
33
the concentrations of specific nutrients (Sayer et al. 2010, Ashford et al. 2013). However,
34
interactions between arthropods and litter can be highly species-specific (Hättenschwiler &
35
Gasser 2005) and changes in tree species composition or diversity are likely to be accompanied
36
by changes in forest floor arthropod communities (Cole et al. 2016).
37
Disturbance could alter decomposition processes via cascading effects of altered tree
38
species composition on litter and soil fauna. Disturbed or young secondary forests have high
39
abundances of pioneer tree species, which are often characterised by fast growth, lower
40
investment in leaf defences and higher foliar nutrient concentrations (Swaine & Whitmore 1988).
41
In contrast, undisturbed mature forests are dominated by slow-growing shade-tolerant species
3
that invest a greater proportion of resources in belowground biomass, structural stability or
43
defences against herbivores and pathogens (Swaine & Whitmore 1988, Chazdon et al. 2010).
44
Extensive work on leaf herbivory in 41 tropical forest tree species showed that mature leaves of
45
gap-colonising species were much more palatable than shade-tolerant plants (Coley 1983). Leaf
46
traits related to herbivore defences are directly related to the rates of mass loss during litter
47
decomposition (Cornelissen et al. 1999). Consequently, functional changes in tree species
48
communities after disturbance have the potential to modify forest arthropod community
49
composition (Lavelle et al. 1997) and alter decomposition processes. Given that around 50% of
50
tropical forests worldwide are secondary regrowth or have been modified by human activities,
51
we need to determine how the changes in tree functional diversity during secondary succession
52
affect litter fauna and decomposition rates.
53
The rate of litter decomposition is governed by both the physical and chemical traits of leaf
54
litter, which determine the quality of substrate available to decomposer organisms and the
55
available habitat space in the forest floor (Berg et al. 1993, Perez-Harguindeguy et al. 2000).
56
Heterogeneous litter mixtures provide a greater variety of resources and microhabitats, which
57
can increase the diversity of decomposer organisms through niche partitioning (Hansen &
58
Coleman 1998, Hättenschwiler et al. 2005). A number of experiments have demonstrated that
59
litter mixtures decompose at a faster rate than single-species litter (Seastedt 1984, Gartner &
60
Cardon 2004) but the species diversity of the litter does not explain these "non-additive" effects
61
(Hättenschwiler et al. 2011). Decomposers preferentially break down high-quality litter first,
62
resulting in the release of nutrients, particularly nitrogen (Hättenschwiler et al. 2005), which
63
enables the transfer of nutrients to facilitate the decomposition of low-quality litter
4
(Hättenschwiler et al. 2005). Hence, litter functional diversity plays a greater role in
65
decomposition processes than species diversity per se.
66
Despite multiple lines of evidence for links between plant traits and invertebrate diversity,
67
the role of larger soil arthropods in decomposition processes is often overlooked, partly due to
68
methodological artefacts. Many decomposition experiments use mesh litterbags (Hättenschwiler
69
et al. 2005), which often exclude macro-arthropods and can create unnatural conditions by
70
changing the physical environment (Levings & Windsor 1996, Hättenschwiler et al. 2005).
71
Consequently, it is unclear how changes in litter functional types will affect arthropod
72
communities and decomposition rates in secondary tropical forests. We aimed to address this
73
using a new approach to investigate how differences in broad tree functional groups (pioneer vs.
74
old-growth) influence litter decomposition rates and arthropod communities in secondary
75
tropical forests.
76
We used mesocosms to allow access by litter invertebrates during a 6-month
77
decomposition experiment in a semi-deciduous lowland tropical forest in Panama. We compared
78
the decomposition rates of litter mixtures from old-growth and pioneer species, and characterised
79
litter arthropod communities within the mixtures to test the following hypotheses:
80
1. Litter from pioneer tree species represents a higher quality resource and will therefore
81
decompose at a faster rate than litter from old-growth forest trees.
82
2. As a result of functional complementarity, litter mixtures containing both old-growth and
83
pioneer species will decompose faster than expected.
84
3. Arthropod community composition will differ among litter mixtures with distinct chemical
85
and physical properties.
5
In addition, we conducted a litterbag experiment using the same litter mixtures to establish
87
whether the patterns of decomposition were comparable between our mesocosm approach and
88
the conventional litterbag method.
89 90
METHODS
91
STUDY SITE AND LITTER MIXTURES — The study site was in a c. 3200 m2 area of 60-year old 92
secondary semi-deciduous lowland tropical forest on the Gigante Peninsula within the Barro 93
Colorado Nature Monument, Panama. Tree species composition at the site includes both pioneer 94
and old-growth forest species (Dent et al. 2013). The mean annual temperature on nearby Barro 95
Colorado Island is 26ºC and the mean annual rainfall is 2600 mm, with a strong dry season from 96
January to April (Leigh 1999). The soil is moderately fertile but has low concentrations of 97
extractable phosphorus (Cavalier 1992, Sayer et al. 2006) and a pH of c. 5.5 (Cavalier 1992, Sayer et 98
al. 2006). We started the experiment before the onset of the wet season in April 2015 to capture the 99
end of the dry season and the pulse in decomposition at the start of the wet season (Wieder & 100
Wright 1995). Due to the 2015 El Niño event, the dry season lasted longer than expected and there 101
was no significant rainfall until late June; our experiment therefore spanned three months of ‘dry 102
season’ and three months of ‘wet season’. 103
To investigate differences in litter decomposition for broad functional groups of trees, we
104
used litter mixtures containing an equal mass of litter from each of three pioneer species
105
(‘pioneer litter’) or three old-growth species (‘old-growth litter’), and a mixture containing an
106
equal mass of litter from all six species (‘mixed litter’; Table 1). All species were common
107
throughout the forest at the study site (Dent et al. 2013). As a control, we used natural
mixed-108
species litter from the study site (‘control litter’). Leaf litter for the other three mixtures was
109
collected from up to four different individual trees in the same forest type on Barro Colorado
6
Island, c. 2-km from the study site. All litter was collected from litter traps within a week of leaf
111
abscission c. one month before the start of the experiment and dried to constant weight at 35ºC
112
immediately after collection.
113
For all constituent species in the litter mixtures, we measured specific leaf area (SLA)
114
using a leaf area meter (LI-3100C, LiCor Biosciences, Nebraska, USA), and leaf toughness using
115
a Pesola spring scale (Pesola AG, Baar, Switzerland), which measures the maximum force
116
needed to punch through leaves with a 1-mm diameter plunger. We measured total foliar
117
concentrations of carbon and nutrients in the litter of each constituent species, the control litter
118
and the litter mixtures (Table 2). Elemental analyses were carried out at the Smithsonian
119
Tropical Research Institute in Panama, where total carbon (C) and nitrogen (N) were measured
120
on a CN-analyser (FlashEA 1112, Thermo Fisher Scientific, Massachusetts, USA).
121
Concentrations of foliar phosphorus, potassium, calcium, and magnesium were measured by
122
spectrometry (Optima 7300 DV, PerkinEla Inc., Massachusetts, USA).
123 124
MESOCOSM EXPERIMENTS — To test our hypotheses about the decomposition of different litter
125
mixtures, we installed 16 mesocosms in each of five replicate blocks (80 mesocosms in total).
126
We applied the four different litter mixtures (Table 1) to the mesocosms. Within each replicate
127
block, there were four sets of mesocosms for each mixture to allow destructive sampling of two
128
sets after three months; the remaining sets were harvested after six months.
129
The mesocosms consisted of plastic tubes (20-cm diameter; 12-cm height) with four 5-cm
130
diameter holes drilled into the side at equal intervals to allow access by arthropods (Figure 1).
131
The mesocosms were inserted into the soil to c. 2-cm depth so that the access holes for
132
arthropods were at ground level. Leaf litter from inside the mesocosms was removed and the soil
133
gently cleared of debris. A pre-weighed 19-cm diameter mesh disc was placed on the soil surface
7
within each mesocosm, and 16.1g of leaf litter from one of the four mixtures (Table 1) was
135
spread on top of the mesh disc. The mass of litter was chosen to represent the litterfall at the
136
study site in February 2015, which was estimated from existing litter traps.
137
Mesocosms were installed in March 2015 and left undisturbed for at least two weeks. We
138
applied the leaf litter mixtures on the 6th of April 2015 and took initial soil temperature and soil
139
water content measurements for each mesocosm. Mean soil water content at 0-6 cm depth was
140
determined from three measurements taken within a 1-m radius around each mesocosm using a
141
Thetaprobe (Delta-T Devices, Cambridge, UK) and soil temperature was measured at 0-10-cm
142
depth using a soil temperature probe (Fisher Scientific, Leicestershire, UK).
143 144
ARTHROPOD DIVERSITY AND ABUNDANCE — To test whether arthropod communities differed
145
among litter mixtures, we collected arthropods from the litter within the mesocosms of eight
146
mesocosms per block (n = 10 per mixture) after three months and again at the end of the study
147
after six months. The mesh discs with litter were carefully removed from the mesocosms and
148
placed into plastic bags. Immediately upon returning from the field, all litter samples were placed
149
in Berlese funnels lined with 10-mm wire mesh. The litter was moistened regularly to prevent
150
desiccation. Arthropods were extracted during 48 hours and stored in 95% ethanol. Subsamples
151
of litter were taken and examined under a microscope to monitor the efficacy of the extraction.
152
After 48 hours, all litter samples were oven-dried to constant weight at 40ºC and weighed to
153
determine mass loss.
154
To assess whether the presence of mesocosms altered arthropod communities, we also
155
determined the abundance and diversity of litter arthropods at the study site by collecting two
156
samples of the litter standing crop in each block after the first three months. We placed a 20-cm
8
diameter tube on the forest floor, cut around the inside walls of the tube and collected the litter;
158
arthropods were then extracted as described above. We extracted samples from additional control
159
mesocosms to make a direct comparison with the forest floor arthropod communities.
160
Arthropods were identified at least to order following Gibb & Oseto (2006), and body length was
161
measured to the nearest 0.02-mm using a dissecting microscope with an optical micrometer.
162 163
LITTERBAG EXPERIMENT — To compare decomposition rates in the mesocosms with the
164
conventional litterbag method, we installed four litterbags per litter mixture within each block.
165
Litterbags were constructed of 2.5-mm nylon mesh and measured 17.7-cm ´ 17.7-cm, to give the
166
same total area as the mesocosms (314.16 cm2), and each received 16.1 g of litter. The bags were
167
placed on bare soil and, to maintain similar conditions to the litter in the mesocosms, any leaf
168
litter that had fallen onto the litterbags was carefully removed every 2-4 weeks. We collected two
169
bags per litter mixture and block after three and six months and stored them in the fridge until
170
they could be processed. The leaf litter was carefully separated from the bag and washed for 75
171
seconds under a continuous stream of water. All litter samples were oven-dried to constant
172
weight at 40ºC and weighed to determine mass loss.
9
DATA ANALYSIS — All statistical analyses were performed in R version 3.2.2 (R Core Team,
175
2015) using the lme4 package (Bates et al. 2015) for linear mixed effects models and the vegan
176
package (Oksanen et al. 2007) for multivariate analyses. Non-normally distributed data were
log-177
transformed prior to analysis where appropriate and all analyses are based on one mean value per
178
litter mixture, block, and time point.
179
The decay rate k for all litter mixtures in litterbags and mesocosms was calculated from total
180
mass loss at 6 months according to Olson (1963):
181
ln ##
$ = −𝑘𝑡 (Eq. 1)
182
Where t is time (yr), X is litter dry mass (g) at collection and Xo is the litter dry mass at time zero
183
(g).
184
To assess mixture effects on mass loss during decomposition, we used Generalised Linear
185
Models (GLMs) with a quasi-binomial error distribution to account for over-dispersion (Gelman
186
& Hill, 2007). We assessed mixture effects on the litter decay rate (k) using linear models and as
187
preliminary analyses showed that decomposition rates varied among replicate blocks, block was
188
retained as an error term in all models. The maximal models included litter mixture, experiment
189
type (mesocosms or litterbags), and their interaction. The models were simplified by sequentially
190
dropping terms until a minimal adequate model was identified, following procedures
191
recommended by Crawley (2007). To identify patterns in decomposition during the dry season
192
and the wet season, we performed separate analyses for mass loss during the first three months
193
and the final three months of the experiment. To identify potential non-additive effects of the
194
litter mixture containing both functional groups, we calculated the mean decay rate across the
195
pioneer and old-growth litter mixtures (expected decay rate; k) in litterbags and mesocosms after
10
six months and used a paired t-test to compare the expected decay rate to the measured decay
197
rate of the mixed litter.
198
We calculated total arthropod abundance, Shannon's diversity (H), and Simpson's evenness
199
(D) for each sample, and used GLMs as above to model each variable as a function of litter
200
mixture. Changes in arthropod community composition were visualised using non-metric
201
multidimensional scaling (NMDS) based on Jaccard similarity (MetaMDS function); stable
202
solutions with stress scores < 0.2 and r2> 0.95 were used for subsequent analyses. Differences in
203
arthropod community composition among mixtures were assessed by permutational multivariate
204
analysis of variance (PerMANOVA; adonis function) after testing for homogeneity of
205
dispersions among mixtures (betadisper and permutest functions). Models were tested with 999
206
permutations constrained within replicate blocks. Separate analyses were conducted to assess i)
207
the effect of mesocosm installation, by comparing arthropod communities in forest floor samples
208
and control mesocosms (at the three-month collection only), and ii) differences among litter
209
mixtures, collection time, and their interaction.
210 211
RESULTS
212
LITTER DECOMPOSITION AND LITTER PROPERTIES — Litter decay rate (k) was best explained by
213
litter mixture and experiment type. In support of our first hypothesis, k differed significantly
214
among mixtures, whereby k for pioneer litter > control litter > mixed litter > old-growth litter
215
regardless of the type of experiment (Table 2). Although the measured litter properties of
216
individual species showed no consistent pattern within functional groups (Table 2a), the pioneer
217
litter mixture had the lowest C:N:P ratio and the old-growth litter had the highest (Table 2b).
11
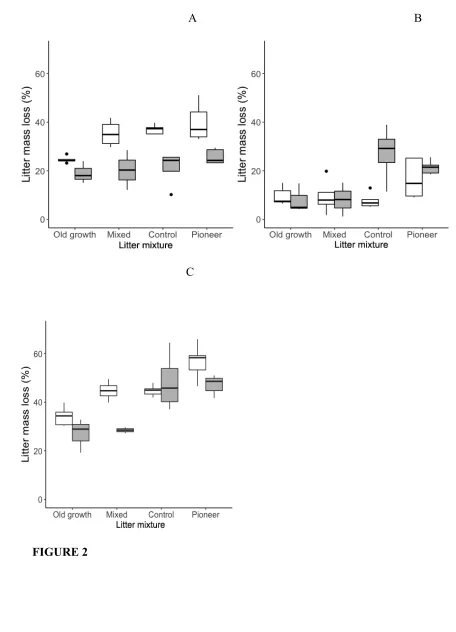
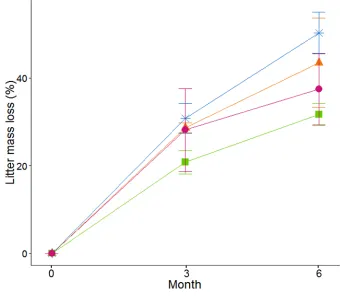
The greatest proportion of mass loss occurred in the first three months, even though this was
219
during the dry season (Figure 3). Mass loss of the old-growth litter mixture was significantly
220
lower than any of the other mixtures during the dry season (0-3 months: t = -3.77, p < 0.001),
221
whereas mass loss of the pioneer litter mixture was significantly greater than the mixed litter and
222
old-growth litter mixtures during the wet season (3-6 months pioneer litter: t = 2.17, p = 0.041;
223
Figures 2 and 3). The pattern of mass loss over time differed between the two types of
224
experiment. In the dry season (months 0-3), litter mass loss from bags was significantly higher
225
compared to mesocosms (t = -7.29, p < 0.001), whereas in the wet season (months 3-6), mass
226
loss was greater in mesocosms (t = 3.72, p = 0.001; Figure 2). Accordingly, k was c. 20% lower
227
for litter mixtures in mesocosms compared to litterbags across all mixtures (F1,28 = 13.3, p =
228
0.001).
229
In partial support of our second hypothesis, we observed a significant non-additive effect
230
of the litter mixture containing pioneer and old-growth species. However, the expected decay
231
rate based on the individual pioneer and old-growth mixtures (1.16 ±0.06) was significantly
232
higher than the decay rate measured in the mixed litter (0.88 ±0.09; t = 2.67, p = 0.02), indicating
233
antagonistic effects of litter mixtures on decomposition processes.
234
ARTHROPOD COMMUNITIES — Arthropod abundance did not differ between samples collected at
235
three months and those collected at six months (Table 3) but the diversity and evenness of the
236
arthropod community was significantly greater at six months than at three months (H: t = -2.06, p 237
= 0.049; D: t = -2.57, p = 0.016). Litter mixture alone had no significant effect on evenness but
238
the diversity and abundance of arthropods was significantly greater in the old-growth litter
239
compared to the other litter mixtures (H: t = -2.11, p = 0.044; abundance: t = 2.26, p = 0.029).
12
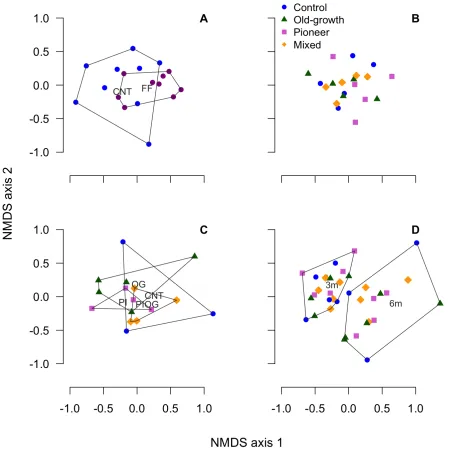
The comparison of arthropods in control mesocosms and forest floor litter samples after
241
three months showed a minor effect of mesocosm installation on community composition
242
(PerMANOVA, main treatment effect: F1,24 = 1.77, p = 0.061; Figure 4A). Arthropod community
243
composition did not differ among litter mixtures at three months (Figure 4B) but there was a
244
significant effect of litter mixture at six months (PerMANOVA, main treatment effect: F3,15 =
245
1.66, p = 0.011; Figure 4C), which partially supports our third hypothesis. Comparison of the
246
arthropod communities in decomposing litter at three and six months showed that community
247
composition differed among mixtures and diverged over time, but the time × mixture
248
interaction was not significant (PerMANOVA, treatment effect: F3,34 = 1.98, p = 0.002; time
249
effect: F1,34 = 7.17, p = 0.001; Figure 4D).
250 251
DISCUSSION
252
Our mesocosm experiments allowed us to study litter decomposition and arthropod communities
253
within the same experimental arena. Our results demonstrate non-additive effects and diverging
254
arthropod communities during the decomposition of mixtures containing litter from broad tree
255
functional types.
256 257
INFLUENCE OF LITTER MIXTURES ON DECOMPOSITION — As hypothesised, the litter from pioneer
258
species decomposed faster than the old-growth forest litter, with the control and mixed litter
259
taking an intermediate position (Figure 2). Litter of pioneer species generallyhas low mass per
260
leaf area, high concentrations of nutrients, and low fibre and lignin contents (Arnone et al. 1995,
261
Hirschel et al. 1997). Thus, it is considered a high-quality resource, which decomposers
262
preferentially break down (Hirschel et al. 1997). By contrast, old-growth species generally have
13
high dry-mass investment per leaf area, low nutrient concentrations and high fibre and lignin
264
contents, and are therefore considered to be a low-quality resource for decomposers
265
(Hättenschwiler et al. 2011). Although, the litter chemical traits of the individual species we
266
measured did not conform to these expected patterns, the C:N:P ratio of the mixtures could
267
explain the decay rates in our study (Table 2b). Other traits such as lignin and polyphenol
268
concentrations are also likely to be important in determining substrate availability or palatability
269
for decomposer organisms (Berg et al. 1993, Perez-Harguindeguy et al. 2000). In our study, leaf
270
toughness was greater in old-growth compared to pioneer species litter (Table 2a) and as leaf
271
toughness represents plant investment in structural carbon and herbivore defences (Westbrook et
272
al. 2011), it is strongly related to litter decomposition rates (Perez-Harguindeguy et al. 2000).
273
Our results suggest antagonistic non-additive effects of litter mixtures because the decay
274
rate for the mixed litter was lower than would be expected from the decay rates of the individual
275
pioneer and old-growth mixtures. A number of studies have demonstrated synergistic
non-276
additive effects during the decomposition of litter mixtures (Hättenschwiler et al. 2005, Gessner
277
et al. 2010), whereby the transfer of nutrients and secondary compounds from high-quality litter
278
can facilitate the decomposition of low-quality litter (Fyles & Fyles 1993). However, the
279
presence of low-quality litter can also decrease the overall decay rate of mixtures (Gartner &
280
Cardol 2004) and increase the immobilization of nutrients (Meier & Bowman 2010), which
281
could be beneficial to nutrient retention in tropical forests, as the gradual release of nutrients
282
from decomposing litter can minimise losses due to leaching (Sayer et al. 2012).
283
Few other studies have investigated non-additive effects of litter mixtures of different
284
functional groups, although non-additive effects were demonstrated in litter mixtures of dicot
285
herbs, grasses and trees (Wardle et al. 1997). Although most studies of non-additive effects have
14
focused on comparing single-species litter to mixtures (Gartner and Cardon 2004), we show that
287
the same considerations apply to mixed litter from broad functional groups, suggesting that
288
complementary litter traits of pioneer and old-growth species alter decomposition processes.
289 290
ARTHROPOD ABUNDANCE AND DIVERSITY IN LITTER MIXTURES — There was a visible separation
291
of arthropod communities in litter from pioneer species compared to old-growth litter at six
292
months and the diversity and abundance of arthropods was greater in old-growth litter by the end
293
of the study (Figure 4), which partially supports our third hypothesis. The differences in
294
arthropod communities may be a result of greater litter mass and habitat structure in the
old-295
growth litter relative to rapidly decomposing litter mixtures (Sayer et al. 2010). Despite this, we
296
found no relationship between litter decay rates and arthropod abundance or diversity. Previous
297
studies show that there is a degree of redundancy in taxonomic richness as decomposition rates
298
plateau at low species richness (Setala & McLean 2004, Hedde et al. 2010). However, the
299
separation of arthropod communities in different mixtures over time could partly result from the
300
differences in chemical and physical properties of the litter, suggesting that certain leaf traits
301
may play a greater role in shaping arthropod community composition during the later stages of
302
decay, once high-quality substrates and labile compounds have been depleted.
303
We had expected greater effects of litter mixtures on arthropod abundance, diversity,
304
evenness, or community composition. Our identification of arthropods to order or family level
305
may not provide sufficient taxonomic resolution to detect changes in arthropod community
306
composition (Walter & Ikonen 1989) but as we found differences among litter mixtures after six
307
months, we propose that the unusually long dry season probably had an overriding effect on
308
arthropod community composition during the first half of the study. Many arthropods are
15
sensitive to dry conditions and a study on nearby Barro Colorado Island found that population
310
levels of only two major arthropod groups increased in the dry season, compared to nine in the
311
wet season (Levings & Windsor 1996). In our study, there was a marked shift in arthropod
312
community composition between the dry and the wet season (Figure 4). Taxa that were only
313
found at the three-month collection during the dry season were all either predators or parasitoids
314
(Dermaptera, Phoridae, Geophilamorpha, Chalicoidae and Scolopendromorpha; Appendix 2),
315
whereas those present only at the six month collection feed on plant material (Isoptera,
316
Gelechiidea, Symphypleona and Gryllidae; Appendix 2, Petersen & Luxton 1982). This could
317
indicate that conditions are more favourable for litter decomposers during the wet season.
318
There was a minor difference in arthropod community composition between forest floor
319
samples and the control litter in the mesocosms at the three-month collection (Figure 4A), which
320
could be attributed to the physical barrier created by mesocosm installation, or because we added
321
a single amount of litter that was much less than the surrounding litter standing crop. However,
322
our ordinations revealed substantial overlap between the arthropod communities in the
323
mesocosms and the forest floor (Figure 4A) and they may more closely resemble the natural
324
forest floor community with a longer installation period and larger or repeated litter inputs.
325 326
COMPARISON OF DECOMPOSITION IN LITTERBAGS AND MESOCOSMS — Our mesocosm approach
327
represents a viable alternative to litterbags, which allowed us to integrate measurements of
328
decomposition and arthropod communities. Our method comparison showed the same pattern of
329
decay among different litter mixtures in litterbags and mesocosms over the six-month study
330
period (Figure 2B,C). Although mass loss from mesocosms was lower than litterbags in the dry
331
season and greater during the wet season, this difference in initial mass loss, and the lower
16
overall decay rate, could be explained by the distinct microenvironments in litterbags and
333
mesocosms. A major critique of the litterbag method is that the bags retain more moisture than
334
the surrounding forest floor (Tanner 1981, Sayer et al. 2006) and as the first three months of the
335
study took place during the dry season, the litterbags could have stayed moister for longer after
336
brief periods of rainfall. In this case, the litterbags would have presented a more favourable
337
environment for decomposers. By contrast, the microenvironment in the mesocosms is more
338
representative of natural litter on the forest floor and was hence more likely to dry out during the
339
dry season. The wet season started approximately halfway through the experiment and here, the
340
mesocosms may have represented the more favourable environment, as the litter was less
341
compressed compared to litterbags.
342
Regardless of season, the initial stages of decomposition are generally rapid as the readily
343
available carbon and nutrients are leached or used by decomposers (Maraun & Scheu 1996a,b).
344
Once most of the labile carbon has been depleted, decay rates tend to decrease (Olson 1963,
345
Wieder & Lang 1982). The litter in bags will have reached this point more rapidly because of the
346
faster decomposition in the first three months, which also partially explains the slower
347
decomposition rates during the remaining three months. Nonetheless, the two methods produced
348
comparable mass loss at six months (Figure 2) and revealed the same distinct patterns of
349
decomposition among litter mixtures.
350 351
CONCLUSIONS
352
Our study highlighted distinct decomposition rates among mixtures of leaf litter from different
353
tree functional groups and changes in the associated litter arthropod communities. We
354
demonstrate antagonistic non-additive effects during the decomposition of mixed litter from
17
broad tree functional groups. As litter represents a major pathway for nutrient cycling in tropical
356
forests, modified decomposition processes due to changes in tree species composition could have
357
wider implications for carbon and nutrient cycling. Further research is needed to determine how
358
non-additive effects could modify nutrient immobilisation and release during decomposition in
359
tropical forests. In our study, the decomposition of different litter mixtures in mesocosms and
360
litterbags was highly comparable. Thus, our mesocosm experiments represent an effective
361
method to measure litter decomposition and arthropod communities in a single system. This
362
approach enables future research into the mechanisms of non-additive effects and the role of
363
arthropod functional diversity during litter decomposition.
364 365
ACKNOWLEDGEMENTS
366
We thank M. Kaspari for the loan of the Berlese funnels, W. Fergusson and C. Morrison for help
367
with arthropod identification; C. Baxendale, J. Crawford, J. Edgerley, L. Lopez-Sangil, E.
368
Medina-Barcenas, and A. Ryan for support with laboratory work. The fieldwork was made
369
possible by the support and facilities of the Smithsonian Tropical Research Institute, for which
370
we are very grateful. The research leading to these results has received funding from the
371
European Research Council under the European Union's Seventh Framework Programme
372
(FP/2007-2013) / ERC Grant Agreement No. 307888.
373 374
AVAILABILITY STATEMENT
375
Data availability: The data used in this study are archived on Dryad (doi supplied upon
376
acceptance).
18
LITERATURE CITED
379
ARNONE, J. A., ZALLER, J. G., ZIEGLER, C., ZANDT, H. & KÖRNER, C. 1995. Leaf quality and
380
insect herbivory in model tropical plant-communitites after long-term exposure to
381
elevated atmospheric CO2. Oecologia, 104, 72-78. 382
ASHFORD, O. S., FOSTER, W. A., TURNER, B. L., SAYER, E. J., SUTCLIFFE, L. & TANNER, E. V. J.
383
2013. Litter manipulation and the soil arthropod community in a lowland tropical
384
rainforest. Soil Biology & Biochemistry, 62, 5-12.
385
BARDGETT, R. G. 2005 Ectomycorrhizal fungi challenged by saprotropic basidiomycetes and soil
386
microfungi under different ammonium regimes in vitro. Mycological Research, 104,
691-387
97.
388
BATES, D., MACHLER, M., BOLKER, B. M. & WALKER, S. C. 2015. Fitting Linear Mixed-Effects
389
Models Using lme4. Journal of Statistical Software, 67, 1-48.
390
BERG, B., BERG, M. P., BOTTNER, P., BOX, E., BREYMEYER, A., DEANTA, R. C., COUTEAUX, M.,
391
ESCUDERO, A., GALLARDO, A., KRATZ, W., MADEIRA, M., MALKONEN, E.,
392
MCCLAUGHERTY, C., MEENTEMEYER, V., MUNOZ, F., PIUSSI, P., REMACLE, J. &
393
DESANTO, A. V. 1993. Litter Mass-Loss Rates in Pine Forests of Europe and Eastern
394
United-States - Some Relationships with Climate and Litter Quality. Biogeochemistry, 395
20, 127-159.
396
CADISH, G. & GILLER, K. E. 1997. Driven by nature: plant litter quality and decomposition.
397
Wallingford: CAB Int. 432 pp.
398
CAVALIER, J. 1992. Fine-root biomass and soil properties in a semi-deciduous and a lower
399
montane rain forest in Panama. Plant and Soil, 142, 187-201.
19
CHAZDON, R. L., FINEGAN, R. S., CAPERS, R. S., SALGADO-NEGRET, B., CASANOVES, F., BOUKILI,
401
V. & NORDEN, N. 2010. Composition and dynamics of functional groups of trees during
402
tropical forest succession in northeastern Costa Rica. Biotropica, 42, 31-40.
403
COLE, R. J., HOLL, K. D., ZAHAWI, R. A., WICKEY, P. & TOWNSEND, A. R. 2016. Leaf litter
404
arthropod responses to tropical forest restoration. Ecology and Evolution, 6, 5158-5168.
405
COLEY, P. D. 1983. Herbivory defensive characteristics of tree species in a lowland tropical
406
forest. Ecological Monographs, 53, 209-234.
407
CORNELISSEN, J. H. C., PÉREZ-HARGUINDEGUY, N., DÍAZ, S., GRIME, J. P., MARZANO, B.,
408
CABIDO, M., VENDRAMINI, F. & CERABOLINI, B. 1999. Leaf structure and defence control
409
litter decomposition rate across species and life forms in regional floras on two
410
continents. New Phytologist, 143, 191-200.
411
CRAWLEY, M. J. 2007. The R book, Chichester, Wiley-Blackwell.
412
DE DEYN, G. B., RAAIJMAKERS, C. E. & VAN DER PUTTEN, W. H. 2004. Plant community
413
development is affected by nutrients and soil biota. Journal of Ecology, 92, 824-834.
414
DENT, D. H., DEWALT, S. J., & DENSLOW, J. S. 2013. Secondary forests of central Panama 415
increase in similarity to old-growth forest over time in shade tolerance but not species
416
composition. Journal of Vegetation Science, 24(3), 530-542.
417
FYLES, J. H. & FYLES, I. H. 1993. Interactions of Douglas-fir with red alder and salal foliage litter
418
during decomposition. Can J For Res, 23, 358-361.
419
GARTNER, T. B. & CARDON, Z. G. 2004. Decomposition dynamics in mixed-species leaf litter.
420
Oikos, 104, 230-246.
421
GELMAN, A. & HILL, J. 2007. Data analysis using regression and hierarchical/multilevel models.
422
Cambridge University Press: Cambridge, UK. 110-118 pp.
20
GESSNER, M. O., SWAN, C. M., DANG, C. K., MCKIE, B. G., BARDGETT, R. D., WALL, D. H. &
424
HATTENSCHWILER, S. 2010. Diversity meets decomposition. Trends in Ecology & 425
Evolution, 25, 372-380.
426
GIBB, T. J. & OSETO, C. Y. 2006. Arthropod collection and identification, Oxford, Academic
427
Press.
428
GILLER, P. S. 1996. The diversity of soil communities, the 'poor man's tropical rainforest'.
429
Biodiversity and Conservation, 5, 135-168.
430
HANSEN, R. A. & COLEMAN, D. C. 1998. Litter complexity and composition are determinants of
431
the diversity and species composition of oribatid mites (Acari: Oribatida) in litterbags.
432
Applied Soil Ecology, 9, 17-23.
433
HATTENSCHWILER, S., COQ, S., BARANTAL, S. & HANDA, I. T. 2011. Leaf traits and
434
decomposition in tropical rainforests: revisiting some commonly held views and towards
435
a new hypothesis. New Phytologist, 189, 950-965.
436
HÄTTENSCHWILER, S. & GASSER, P. 2005. Soil animals alter plant litter diversity effects on
437
decomposition. Proc Natl Acad Sci, 102, 1519-1524. 438
HÄTTENSCHWILER, S., TIUNOV, A. V. & SCHEU, S. 2005. Biodiversity and litter decomposition in
439
terrestrial ecosystems. Annual Review of Ecology Evolution and Systematics. Palo Alto:
440
Annual Reviews, 36, 191-218.
441
HEDDE, M., BUREAU, F., CHAUVAT, M. & DECAENS, T. 2010. Patterns and mechanisms
442
responsible for the relationship between the diversity of litter macro-invertebrates and
443
leaf degradation. Basic and Applied Ecology, 11, 35-44.
21
HIRSCHEL, G., KORNER, C. & ARNONE, J. A. 1997. Will rising atmospheric CO2 affect leaf litter
445
quality and in situ decomposition rates in native plant communities? Oecologia, 110,
446
387-392.
447
LAVELLE, P., BIGNELL, D., LEPAGE, M., WOLTERS, V., ROGER, P., INESON, P., HEAL, O. W. &
448
DHILLION, S. 1997. Soil function in a changing world: the role of invertebrate ecosystem
449
engineers. European Journal of Soil Biology, 33, 159-193.
450
LEIGH, E. G., JR. 1999. Tropical Forest Ecology: A View from Barro Colorado Island, New
451
York, Oxford University Press.
452
LEVINGS, S. C. & WINDSOR, D. M. 1996. Seasonal and annual variation in litter arthropod 453
populations. Smithsonian Institution Press. 355-388 pp.
454
MARAUN, M. & SCHEU, S. 1996a. Changes in microbial biomass, respiration and nutrient status
455
of beech (Fagus sylvatica) leaf litter processed by millipedes (Glomeris marginata).
456
Oecologia, 107, 131-140.
457
MARAUN, M. & SCHEU, S. 1996b. Seasonal changes in microbial biomass and activity in leaf
458
litter layers of beech (Fagus sylvatica) forests on a basalt-limestone gradient.
459
Pedobiologia, 40, 21-31.
460
MEIER, C. L. & BOWMAN, W. D. 2010. Chemical composition and diversity influence
non-461
additive effects of litter mixtures on soil carbon and nitrogen cycling: implications for
462
plant species loss. Soil Biology and Biochemistry, 42, 1447-1454.
463
NIELSEN, U. N., AYRES, E., WALL, D. H. & BARDGETT, R. D. 2011. Soil biodiversity and carbon
464
cycling: a review and synthesis of studies examining diversity-function relationships.
465
European Journal of Soil Science, 62, 105-116.
22
OKSANEN, J. F., BLANCHET, G., KINDT, R. LEGENDRE, P., MINCHIN, P. R., O'HARA, R. B.,
467
SIMPSON, G. L., SOLYMOS, P., STEVENS, M. H. H., AND WAGNER, H. 2015. vegan:
468
Community Ecology Package. R package version 2.3-1.
469
OLSON, J. S. 1963. Energy-Storage and Balance of Producers and Decomposers in
Ecological-470
Systems. Ecology, 44, 322-331.
471
PEREZ-HARGUINDEGUY, N., DIAZ, S., CORNELISSEN, J. H. C., VENDRAMINI, F., CABIDO, M. &
472
CASTELLANOS, A. 2000. Chemistry and toughness predict leaf litter decomposition rates
473
over a wide spectrum of functional types and taxa in central Argentina. Plant and Soil, 474
218, 21-30.
475
PETERSEN, H. & LUXTON, M. 1982. A Comparative-Analysis of Soil Fauna Populations and
476
Their Role in Decomposition Processes. Oikos, 39, 287-388.
477
SAYER, E. J., SUTCLIFFE, L. M. E., ROSS, R. I. C. & TANNER, E. V. J. 2010. Arthropod abundance
478
and diversity in a lowland tropical forest floor in Panama: the role of habitat space vs.
479
nutrient concentrations. Biotropica, 42, 194-200.
480
SAYER, E. J., TANNER, E. V. J. & LACEY, A. L. 2006. Effects of litter manipulation on early-stage
481
decomposition and meso-arthropod abundance in a tropical moist forest. Forest Ecology 482
and Management, 229, 285-293.
483
SAYER, E. J., WRIGHT, S. J., TANNER, E. V., YAYITT, J. B., HARMS, K. E., POWERS, J. S., KASPARI,
484
M., GARCIA, M. N. AND TUNER, B. L. 2012. Variable responses of lowland tropical forest
485
nutrient status to fertilisation and litter manipulation. Ecosystems, 15, 387-400.
486
SEASTEDT, T. R. 1984. The role of microarthropods in decomposition and mineralization process.
487
Annual Review of Entomology, 29, 25-46.
23
SETALA, H. & MCLEAN, M. A. 2004. Decomposition rate of organic substrates in relation to the
489
species diversity of soil saprophytic fungi. Oecologia, 139, 98-107.
490
SWIFT, M. J., HEAL, O. W. & ANDERSON, J. M. 1979. Decomposition in Terrestrial Ecosystems.
491
Berkeley: University of California Press. 509 pp.
492
TANNER, E. V. J. 1981. The decomposition of leaf litter in Jamaican montane rain forests.
493
Journal of Ecology, 69, 263-275.
494
R CORE TEAM 2015. R: A language and environment for statistical computing. Vienna, Austria:
495
R Foundation for Statistical Computing.
496
SWAINE, M.D. & WHITMORE, T. C. 1988. On the definition of ecological species groups in
497
tropical forests. Vegetatio,. 75, 81-86.
498
WALTER, D. E. & IKONEN, E. E. 1989. Life history and behavior of mites in the genus Lasioseius 499
(Acari: Mesostigmata: Ascidae) from grassland soils in Colorado, with taxonomic notes
500
and description of a new species. Canadian Journal of Zoology, 67, 2797-2813.
501
WARDLE, D. A. 2002. Communities and ecosystems: linking the aboveground and belowground
502
components. Princeton, NJ: Princeton University Press 392 pp.
503
WARDLE, D. A., BONER, K. I. & NICHOLSON, K. S. 1997. Biodiversity and plant litter:
504
experimental evidence which does not support the view that enhanced species richness
505
improves ecosystem function. Oikos, 79, 247-58
506
WESTBROOK, J. W., KITAJEMA, K., BURLEIGH, J. G., KRESS, W. J., ERICKSON, D. L & WRIGHT, S.
507
J. 2011. What makes a leaf tough? Patterns of correlated evolution between leaf
508
toughness traits and demographic rates among 197 shade-tolerant woody species in a
509
Neotropical forest. American Naturalist, 177, 800-811.
24
WIEDER, R. K. & LANG, G. E. 1982. A Critique of the Analytical Methods Used in Examining
511
Decomposition Data Obtained from Litter Bags. Ecology, 63, 1636-1642.
512
WEIDER, R. K. & WRIGHT, S. J. 1995. Tropical forest litter dynamics and dry season irrigation on
513
Barro Colorado Island, Panama. Ecology, 76, 1971-1979.
25
[image:27.612.64.499.214.458.2]TABLES
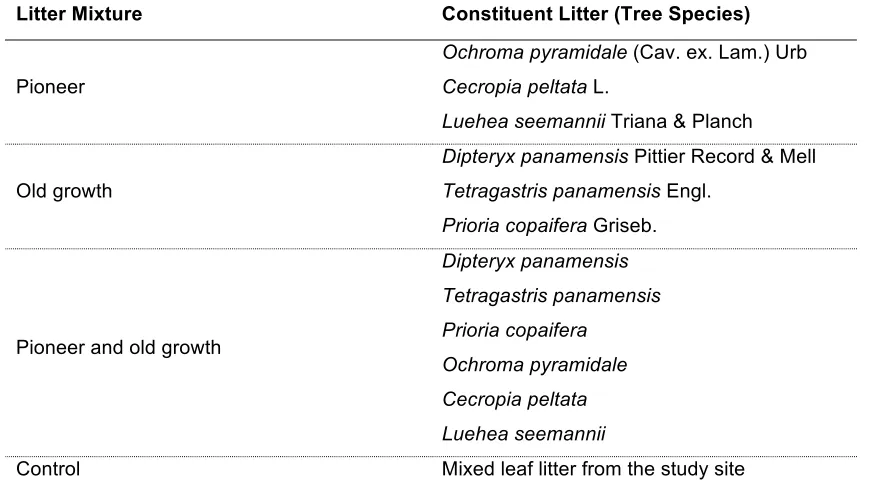
TABLE 1.The four leaf litter mixtures used in a six-month decomposition experiment in
lowland tropical forest in Panama; the mixtures contained an equal mass of litter from
each of the constituent species.
Litter Mixture Constituent Litter (Tree Species)
Pioneer
Ochroma pyramidale (Cav. ex. Lam.) Urb Cecropia peltata L.
Luehea seemannii Triana & Planch
Old growth
Dipteryx panamensis Pittier Record & Mell Tetragastris panamensis Engl.
Prioria copaifera Griseb.
Pioneer and old growth
Dipteryx panamensis Tetragastris panamensis Prioria copaifera
Ochroma pyramidale Cecropia peltata Luehea seemannii
Control Mixed leaf litter from the study site
26
TABLE 2: Litter properties for a) individual species and b) litter mixtures used in a
decomposition study in lowland tropical forest in Panama; in a) mean values of specific
leaf surface area (SLA; n = 9 fresh leaves per species), carbon to nitrogen ratios (C:N; n =
3 litter samples), and leaf toughness (n = 6 fresh leaves) are shown for individual species,
where FG is functional group, OG is old-growth and PI is pioneer species; and in b)values
shown are from one composite sample per mixture for nitrogen (N), phosphorus (P),
potassium (K), calcium (Ca), magnesium (Mg) and C:N:P ratios, and means ± standard
errors are shown for n = 5 litterbags per mixture for decay rates (k).
a) Species FG SLA (mm2 g-1) C:N Toughness (g)
Dipteryx panamensis OG 185.8 36.4 ±0.9 57.85
Tetragastris panamensis OG 72.1 57.1 ± 4.3 202.67
Prioria copaifera OG 95.9 46.7 ± 1.0 122.29
Cecropia peltata PI 72.4 44.6 ± 0.4 21.50
Luehea seemannii PI 145.3 44.1 ± 2.7 55.00
Ochroma pyramidale PI 86.3 76.5 ± 5.2 15.67
N P K Ca Mg C:N:P k
b) Mixture (%) (mg/g)
Pioneer 0.97 0.75 4.20 25.76 4.40 63.3 1.51 ± 0.23
Control 1.23 0.41 3.30 12.64 3.16 88.2 1.21 ± 0.26
Mixed 1.06 0.60 4.38 20.62 3.12 85.8 0.86 ± 0.10
Old growth 1.14 0.44 4.56 15.5 1.84 108.3 0.72 ± 0.16
[image:28.612.70.496.333.666.2]27
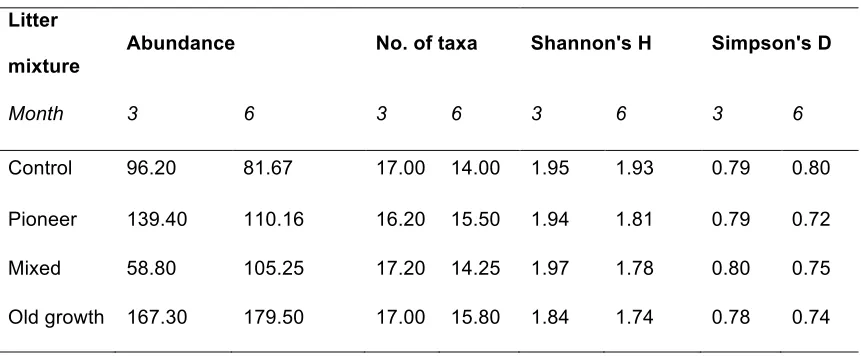
TABLE 3: Arthropod community metrics in different litter mixtures in a decomposition
study in a lowland tropical forest in Panama, showing arthropod abundance, total number
of taxa, Shannon's Diversity (H) and Simpson's Evenness (D) indices in litter samples
collected from mesocosms after three and six months of decomposition; values are means
of n = 5 per mixture at three months and n = 5 for old-growth, n = 3 for controls, and n = 4
for pioneer and mixed litter at six months; the litter mixtures are described in Table 1.
Litter
mixture
Abundance No. of taxa Shannon's H Simpson's D
Month 3 6 3 6 3 6 3 6
Control 96.20 81.67 17.00 14.00 1.95 1.93 0.79 0.80
Pioneer 139.40 110.16 16.20 15.50 1.94 1.81 0.79 0.72
Mixed 58.80 105.25 17.20 14.25 1.97 1.78 0.80 0.75
Old growth 167.30 179.50 17.00 15.80 1.84 1.74 0.78 0.74
[image:29.612.68.499.256.434.2]28
FIGURE LEGENDS:
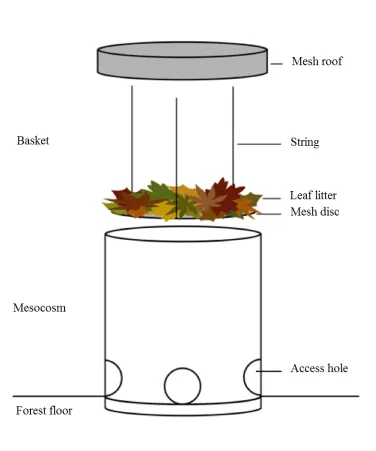
FIGURE 1: Schematic diagram of mesocosms used to measure litter decomposition and
arthropod communities in litter mixtures during a 6-month experiment in a lowland
tropical forest in Panama.
FIGURE 2: Boxplots of mass loss during decomposition in mesocosms (grey) and
litterbags (white) for different litter mixtures in a lowland tropical forest in Panama during
(A) the dry season (months 0-3), (B) the wet season (months 3-6) and (C) the whole
6-month study period.
FIGURE 3: Mean mass loss from litterbags and mesocosms during six months of
decomposition in a lowland tropical forest in Panama; where green squares indicate old
growth, pink circles indicate mixed litter, orange triangles indicate control litter and blue
stars indicate pioneer litter; means and standard deviations are shown for n = 5.
FIGURE 4: Non-metric-mutidimensional scaling (NMDS) ordinations of arthropod
community composition in a decomposition experiment in lowland tropical forest in
Panama showing differences in arthropod communities based on Jaccard similarity for (A)
forest floor and control mesocosms at three months; (B) in mesocosms with different litter
mixtures at three months and (C) at six months, and (D) the comparison between arthropod
communities in mesocosms at three and six months; where purple is forest floor (FF), blue
is control litter (CNT), green is old-growth litter (OG), pink is pioneer litter (PI), and
29
communities in ordination space based on the standard error of the weighted average of
scores.
30
31
A B
524
525
C
526 527
[image:33.612.54.510.61.693.2]528
FIGURE 2
32 530
33
34
SUPPORTING INFORMATION
Mean abundance of identified arthropod taxa in different litter mixtures after three months
(dry season; DS) and six months (wet season; WS) showing all individuals by class,
subclass or order; where identification was possible to a lower taxonomic level than order,
the number of individuals is listed separately; means are given for n = 3 to n = 5
mesocosms per mixture.
Control Pioneer Mixed Old growth
Class/subclass/order
Lowest identified
taxonomic level
DS WS DS WS DS WS DS WS
Acari 14.50 25.00 33.33 55.50 28.00 34.89 47.22 79.10
Acari Oribatidae 30.20 3.50 40.44 2.50 35.70 2.78 29.22 0.00
Annelida 0.00 0.00 0.11 0.25 0.10 0.00 0.22 0.57
Araneae 4.80 6.25 4.78 4.75 7.00 16.33 6.22 20.86
Blattodea Cockroaches 0.00 0.00 0.00 0.00 0.00 0.00 0.00 0.14
Blattodea Isoptera 0.00 0.00 0.00 0.75 0.00 0.00 0.00 0.00
Coleoptera 0.60 1.00 0.33 0.50 0.70 0.11 0.67 4.00
Coleoptera Apenes 0.00 0.00 0.00 0.00 0.00 0.00 0.00 0.00
Coleoptera Cucujiformia 0.00 0.00 0.11 0.00 0.00 0.00 0.00 0.14
Coleoptera Hypothenemus 0.10 0.25 0.22 0.25 0.20 0.00 0.44 0.00
Collembola 1.10 0.25 2.56 0.00 1.80 0.00 3.00 0.00
Collembola Entomobryomorpha 10.40 13.25 20.11 8.50 14.00 14.33 21.22 17.14
Collembola Poduromorpha 3.60 1.00 4.22 11.00 2.40 3.33 1.89 6.00
Collembola Symphypleona 0.00 1.75 0.00 2.25 0.00 2.22 0.00 2.10
Dermaptera Dermaptera 0.00 0.00 0.00 0.00 0.00 0.00 0.00 0.00
35
Diplopoda 1.20 0.00 5.11 0.25 3.30 0.44 2.78 0.00
Diplura 0.40 0.00 0.11 3.25 0.00 0.56 0.00 4.86
Diptera 1.40 3.75 1.78 5.75 3.80 2.11 2.89 8.43
Diptera Phoridae 0.20 0.00 0.00 0.00 0.00 0.00 0.00 0.00
Gastropoda 0.60 0.00 1.11 0.75 0.40 0.78 0.33 1.00
Geophilomorpha 0.00 0.00 0.00 0.00 0.00 0.00 0.00 0.00
Glomerida 0.00 0.00 0.00 0.00 0.00 0.00 0.00 0.00
Haripacticoda 0.00 0.00 0.00 0.00 0.00 0.78 0.00 0.00
Hemiptera 0.40 0.25 0.44 0.00 0.70 0.11 0.89 0.29
Hemiptera Cicadellidae 0.30 0.75 0.11 0.25 0.20 0.00 0.00 0.43
Hemiptera Delphacidae 0.00 0.00 0.44 0.00 0.10 0.00 0.00 0.14
Hemiptera Psyllidae 0.00 0.00 0.00 0.00 0.00 0.00 0.00 0.00
Hymenoptera 0.60 0.25 0.79 0.75 0.60 0.00 1.78 0.71
Hymenoptera Chalicoidae 0.00 0.00 0.00 0.00 0.00 0.00 0.11 0.00
Hymenoptera Formicidae 23.90 27.50 15.78 0.50 14.50 9.44 59.00 36.29
Isopoda 0.80 1.00 1.22 0.75 0.40 1.56 0.22 0.57
Larvae 1.60 1.25 0.89 0.25 0.60 0.78 3.22 4.57
Lepidoptera 0.10 0.00 0.11 0.25 0.30 0.11 0.33 0.43
Lepidoptera Gelechiidea 0.00 0.50 0.00 0.75 0.50 0.11 0.11 0.57
Lepidoptera Limacodidae 0.00 0.00 0.00 0.00 0.00 0.00 0.00 0.00
Megaloptera 0.00 0.00 0.00 0.00 0.00 0.00 0.11 0.00
Megaloptera Corydalidae 0.00 0.00 0.00 0.00 0.00 0.00 0.00 0.00
Mesostigmata 0.00 0.00 0.00 0.00 0.00 0.00 0.00 0.00
Opiliones 0.00 0.50 0.00 0.25 0.00 0.00 0.00 0.14
Orthoptera 0.00 0.00 0.00 0.25 0.00 0.00 0.00 0.14
Orthoptera Gryllidae 0.10 0.00 0.00 0.00 0.00 0.22 0.00 0.14
Polydesmida 0.00 0.00 0.00 0.00 0.00 0.00 0.00 0.00
36
Pseudoscorpionidae 1.70 1.75 2.00 1.25 1.30 1.56 1.00 0.43
Psocoptera 0.80 1.75 0.22 1.00 0.70 0.33 1.11 2.43
Scolopendromorpha Zorotypus 0.10 0.00 0.00 0.00 0.00 0.00 0.11 0.00
Thysanoptera 0.70 0.25 0.33 0.00 0.00 0.00 0.33 0.00
Trichoptera 0.00 0.00 0.00 0.00 0.00 0.00 0.00 0.00
Polyxenida 0.00 0.25 0.00 0.00 0.00 0.00 0.11 0.00
Unknown sp. 14 0.10 0.00 0.00 0.25 0.00 0.00 0.00 0.00
Unknown sp. 15 0.00 0.00 0.00 0.00 0.00 0.11 0.00 0.00