Accepted Manuscript
Title: Team-based Learning for First Year Engineering Students
Author: Vesna Najdanovic-Visak
PII: S1749-7728(16)30022-7
DOI: http://dx.doi.org/doi:10.1016/j.ece.2016.09.001 Reference: ECE 129
To appear in: Education for Chemical Engineers Received date: 22-4-2016
Revised date: 22-8-2016 Accepted date: 6-9-2016
Please cite this article as: Najdanovic-Visak, Vesna, Team-based Learning for First Year Engineering Students.Education for Chemical Engineers http://dx.doi.org/10.1016/j.ece.2016.09.001
Team-based Learning for First Year Engineering Students
Vesna Najdanovic-Visak*
Energy Lancaster, Engineering Department, Lancaster University, Gillow Avenue
Lancaster LA1 4YW, United Kingdom
Highlights
Teams outperformed individuals, suggesting an effective team interaction.
Students’ perception of the team-based learning showed increasing trend as the module progressed, perhaps due to their increasing adaption to working in teams.
The highest scores were observed for the engagement category, showing good team work, mutual respect and contribution as well as high attentiveness.
Abstract
Although it was originally developed for a business school environment to promote the
benefits of small-group teaching in a large group setting, the method of the Team-based
Learning (TBL) has recently been increasingly used within medical education. On the other
hand, the reports on its implementation in engineering and science education are much
scarcer. The aim of this work is to discuss the experience, evaluation and lessons learned
from the implementation of the TBL within a Year 1 engineering module - Process
Engineering Fundamentals, enrolling 115 students, and the TBL method was introduced for
the first time.
To evaluate the acquired knowledge and perception of TBL, a students’ performance analysis
and questionnaire were completed on two occasions. It was observed that the TBL approach
improved student learning, enhanced their integration and sharing of knowledge in class,
supporting the implementation of this method in engineering disciplines.
1.
Introduction
The traditional approach of teaching engineering subjects is efficient in presenting a large
amount of information to large numbers of students. However, the downside of this approach
is that it fosters passive learning where students expect to be told what to learn and how to
learn it (Felder, 2012), without developing the skills and enthusiasm for the course. Evidence
suggests that, relative to traditionally-taught students, the students who had proceeded
through the student-centred methods emerged with more positive attitudes about the quality
of their instruction, higher levels of confidence in their engineering problem solving abilities,
a greater sense of community among themselves, and perhaps a higher level of employability
resulting partly from their extensive experience with team projects (Felder, 1995).
A large body of literature in this area addresses theory, research, practices and faculty
development (Prince, 2004; Prince and Felder, 2006). The most commonly published
methodologies are cooperative/collaborative learning (Cabrera et al., 2001; Maceiras et al.,
2011), problem-based learning – PBL (Hmelo-Silver, 2004; Harris and Briscoe-Andrews,
2008), web-based learning (Chumley-Jones et al., 2002; Brault et al., 2007), team-based
learning – TBL (Thompson et al., 2007; Lamm et al., 2014) and enquiry based learning –
EBL (Levy and Petrulis, 2012; Glassey et al, 2013). Development of strong teamwork
capabilities are highly required by employers in engineering sectors since engineering
graduates are increasingly expected to work in team-based product and process design
projects (Natishan et al., 2000). The recent study published by Zou and Ko 2012
demonstrated enhanced awareness of teamwork concepts among chemical engineering
students through a three-year systematic teamwork development project. Therefore, it is not
surprising that in last few decades, various group based learning methodologies have
undergraduate group design projects were introduced a half century ago in almost all
chemical engineering courses in the world, evolving ever since due to the enormous
commitment from the chemical process industry in terms of efficiency, environmental
impact, safety, sustainability, and flexibility (Pekdemir et al., 2006). On the contrary to this
traditional group work, such as design projects, which typically produce a paper and/or
presentation, groups in TBL, PBL and EBL are more structured and actually do their group
work during class time.
From all above mentioned learning methods, PBL is the most used alternative strategy within
engineering education. Developed in medical education in the late 1960s, problem-based
learning was a major breakthrough in curriculum reform (Frenk et al. 2010), causing many
schools to adopt an alternative to then dominant teacher-centred approach. It has been
described as ‘reflecting the way people learn in real life’ (Biggs and Tang 2007). PBL
presents a spectrum of various different practices, but in general follows the following
sequence: 1) Group analyses a given problem; 2) Group brainstorms possible solutions and
hypotheses and then decides what further information is needed to solve the problem; 3)
Independent study by each member of group; and, 4) Group shares gathered information and
tests previous hypotheses in light of the new information. PBL delivery involves the
supervision of each group by one tutor. A number of publications suggests that
problem-based learning has several clear advantages over the more traditional delivery techniques,
such as increased retention of information, an integrated knowledge base, the development of
lifelong learning skills, an exposure to real-life experience at an earlier stage in the
curriculum, increased student-faculty interactions, and an increase in overall motivation
(Klegeris and Hurren, 2011). The main disadvantage of PBL lays in the fact that each group
large classes such as first-year introductory modules with typically more than one hundred
students.
Another pedagogical approach, Team-Based Learning (TBL) was firstly introduced in the
literature in 1982 as a way to promote the benefits of small-group teaching in a large group
setting, considerably enhancing students’ engagement and their knowledge retention
(Michaelsen et al., 1982). TBL is promoted as a special pedagogical approach comprising
four elements for implementation (Michaelsen et al., 2004): i) strategically forming
permanent teams of 5-7 members (to guarantee sufficient intellectual resources), ii)
Readiness Assurance Process (pre-class individual assignment, e.g. readings, followed by
in-class Individual Readiness Assurance Test, iRAT, and Team Readiness Assurance Test,
tRAT), 3) developing students’ critical thinking skills by using carefully-designed, in-class
activities and assignments; and, 4) creating and administering a peer assessment and feedback
system.
In contrast to PBL which covers many different practices, TBL is a well-defined set of
practices and principles with only few variations. In TBL, one tutor simultaneously facilitates
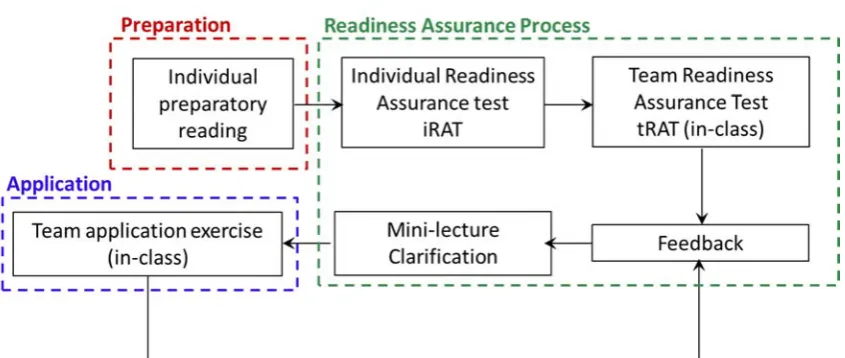
many small teams of 5-7 members, typically 20 or more. Usually material to be covered is
organized into a few major units and for each of them the sequence of activities is
implemented as shown in Figure 1. In the first phase, students are given pre-class individual
assignments (e.g. readings) that are designed to familiarize students with the key concepts of
that unit. Based on this preparation, in the next phase students are expected to take an
Individual Readiness Assurance Test (iRAT), guaranteeing their preparation. After, students
re-take the exact same Readiness Assurance Test as a team (tRAT) by coming to consensus
on their answers. The role of tRAT is two-fold: 1) mutual transfer of knowledge between
teammates; and, 2) motivation through competition with other teams. In the next phase,
to the test questions that students struggled with. The instructor can also provide feedback
(e.g. mini-lecture) which is usually short and always very specific in corrections of any
misperception. In the final stage, the team application assignments are designed for students
to put course content to use by working in teams on progressively more difficult questions. It
is essential to carefully design these application assignments in order to achieve the higher
Bloom’s levels of learning (abilities to analyse, evaluate and create) according to the
so-called ‘4S’ strategy coined by Michaelsen et al., 2008:
1) Significant problem – The application exercise should be meaningful and complex enough
to motivate student to generate fruitful discussions within teams.
2) Same problem – All teams should work on the exact same problem which allows teams to
compare their answers with answers of other teams. In this way, teams get more curious,
assuring that students pay more attention, resulting in enhanced engagement. Mock
3) Specific choice – Although open-ended questions can lead to lively discussions, the
application exercises should be designed as a specific choice questions, such as
multiple-choice, calculating a parameter, creating a list, ordering items, organizing into categories, etc.
Asking students to make a collaborative decision giving a specific answer simulates a read
world situation in professional environment. In this way, teams learn to justify, elaborate,
defend and argue for their chosen decision.
4) Simultaneous reporting – Teams should report their answers simultaneously in order to
encourage accountability and prevent answer drift.
The last essential element of the team-based learning is peer-to-peer assessment, aiming to
hold individuals accountable to their teams and to lessen the likelihood of social loafing.
Three peer evaluation methods have been reported (Michaelsen et al., 2008) for team based
learning: the Michaelsen method which forces students to differentiate among the
divide among team members resulting in a multiplier that is used to adjust the overall course
grade for a particular student; and the Koles method which incorporates both quantitative and
qualitative section. Farland et al., 2013 discussed the best practices and challenges with peer
evaluation.
Recently, Dolmans et al. 2015 examined similarities and differences between problem-based
and team-based learning, concluding that the similarities between PBL and TBL are small
group learning. On the other hand, two main differences were observed: 1) one instructor
supports multiple self-managed teams in TBL, whereas each small group in PBL is facilitated
by one instructor; and, 2) Mandatory pre-reading assignments in TBL with testing versus
students identifying issues for self-study in PBL.
Although it was originally developed as a teaching method suitable for a business school
environment, team-based learning has attracted the interest of educators from various
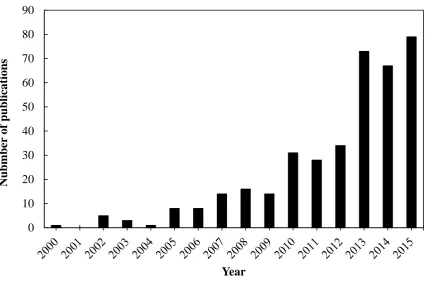
disciplines. This growing attention for the implementation of TBL is represented by the
yearly increase in the number of related publications (Figure 2): starting from two
publications in 2000 to eighty papers published in 2015, while the number of publications per
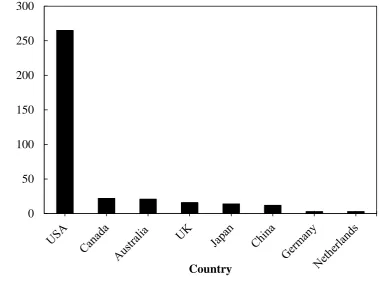
year doubled in the period 2011-2015. It is also interesting to note that TBL was mostly
implemented in the United State of America which is demonstrated also by the number of
publications per country (Figure 3). Again, Web of Science data show that more than 75% of
all the published work is from the USA, followed by Canada (6.2%), Austria (5.9%) and
United Kingdom (4.5%).
The number of students in science and engineering fields is growing faster than in other
fields. Since 2009, science and engineering degrees have increased by 19% in the US,
slightly more than double the 9% growth rate for the other fields (DeWitt and Maciejewski,
the beginning of the 2000s were relatively static, by 2006–2007 an upturn was evident, with
an increase of approximately 23% (AUCC 2011). Just in the last year, the Engineering
Department at Lancaster University (UK) experienced more than 50% growth in the number
of undergraduate students. This phenomenon is usually not accompanied by the increases in
institutional and teaching resources, thus challenging student-teacher relationships as well as
the way of teaching and learning.
Reports on the implementation of TBL in engineering education are still scarce, despite its
potential to be used as an effective instructional strategy for teaching problem-solving skills
in large class formats. Furthermore, working in teams is an essential skill for undergraduate
engineers. Thus, Van der Loos et al. 2009 reported about the TBL approach in design
elements module, evidencing increased in-class discussion, peer-learning and attendance, as
well as an improved course effectiveness based on student evaluation. The same group
described an enhancement in the students' perception of the mechanical module and student
performance on exams (Ostafichuk et al. 2012). Also, Price et al. 2010 from Monash
University carefully engineered team-based learning exercises to develop team work,
collaboration, lateral thinking and problem solving as well as, the often necessary, conflict
resolution.
Thus, the aim of this work is to discuss the experience, evaluation and lessons learned from
the implementation of Team-Based Learning (TBL), within a new Year 1 engineering
module in the Engineering Department at Lancaster University, called Process Engineering
Fundamentals. The Engineering Department has a common first year structure for all
engineering students (chemical, mechanical, sustainable, nuclear and electronic engineering).
The module covers process variables, material balance for processes without and with
students and consisted of three one-hour lectures each week in an amphitheatre and one
2-hour practical session in a computer room (for five weeks).
2. Methodology
The team-based learning (TBL) was implemented within the Process Engineering
Fundamentals (ENGR160), a Year 1 module required for all the engineering students
(courses: chemical, nuclear, mechanical, sustainable, general, mechatronics and electrical
engineering). The module was delivered for the first time at the Engineering Department of
Lancaster University, during 2014-2015, enrolling 115 students. Team-based learning
strategy was implemented according to Michaelsen et al. 2008 and Lamm et al. 2014 with
some modifications.
The module comprised three 50-minute lectures each week in an amphitheatre and one
2-hour practical session in computer room (for five weeks).
2.1. Procedure
Students were divided into 18 groups: 11 groups of 6 students and 7 groups of 7 students. The
module was divided in three units, giving approximately four lecture sessions per unit. As
shown in Figure 1, before each unit, students were asked to individually study the reading
material which was accessible via Moodle, a virtual learning online platform. At the first
session of each unit, students individually took a Readiness Assurance Test (iRAT) to
guarantee their preparation. The iRAT was designed as a multiple choice test, aiming to
confirm that a student understood the main aspects of the material and is fully prepared to
apply this to solve problems in a team group. The duration of iRAT was 20 minutes and it
the same test again as a team, the so-called Team Readiness Assurance Test (tRAT). The test
answers were provided immediately afterwards and tailored feedback on the most difficult
points given as a mini-lecture
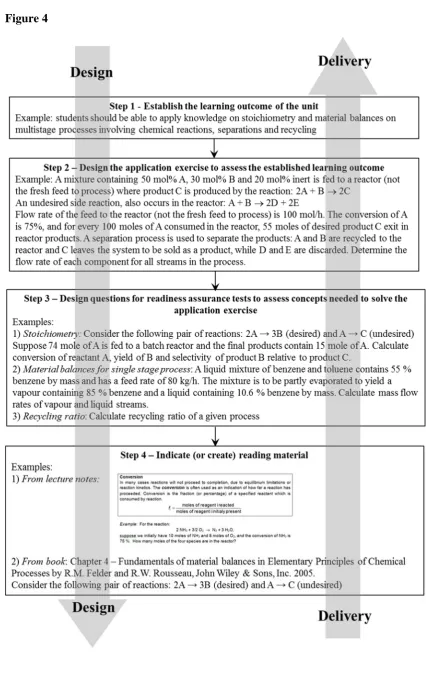
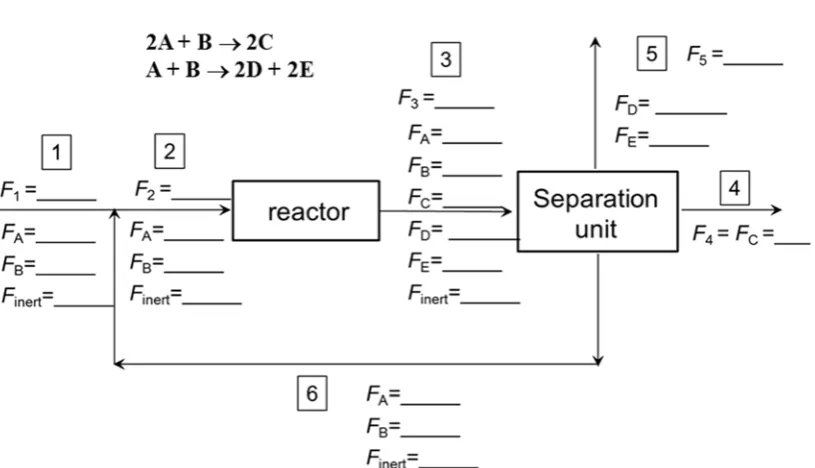
For each unit, students spent the majority of time solving application exercise which were
designed according to the ‘4S’ strategy using backwards design (Wiggins and McTighe 1998)
as shown in Figure 4. In the first stage, intended outcomes of a unit should be established
according to the learning outcomes for the module. In the given example, students should be
able to apply knowledge on stoichiometry and material balances on multistage processes
involving chemical reactions, separations and recycling. In the next stage, the team
application exercise is created in such a way to assess the established learning outcomes
using the 4S strategy. The given application exercise involves material balance calculations
for the process composed of chemical reaction (parallel – desired and undesired reactions),
separation unit and recycling system, laying the foundation for subsequent modules – unit
operations, thermodynamics, reactor design and kinetics. Furthermore, it is difficult to divide
tasks for individuals within the team which would cease fruitful discussions important for
deep learning. Students are requested to make a specific choice by calculating various flow
rates as shown in Figure 5. Depending of the application exercise, students were allowed 10
to 25 minutes to complete calculations which were followed by simultaneous answering
using placards.
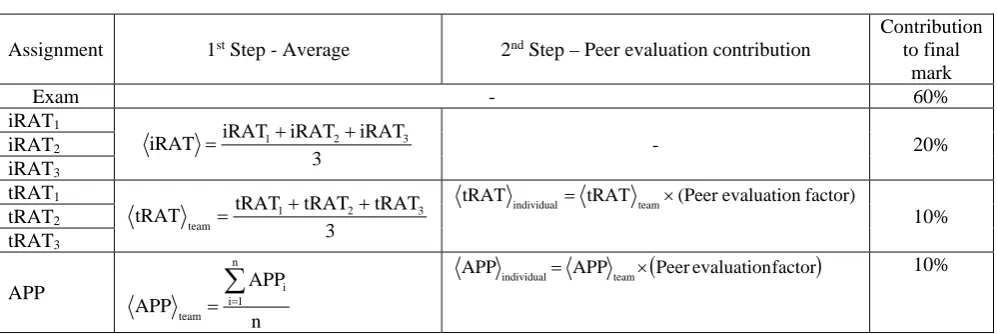
2.2 Assessment
Assessment was performed according to the Department’s rules as presented in Table 1:
Exam 60%; average of three individual readiness assurance tests iRAT 20%; average of
three team readiness assurance tests tRAT 10%; and average application exercises APP
calculate a corresponding marks for each individual member (
individual
tRAT and
individual
APP ) ,
according to:
factor) evaluation (Peer
tRAT
tRAT individual team (1)
Peer evaluationfactor
APPAPPindividual team (2)
The peer evaluation factor was obtained by peer-to-peer assessment using the so-called Fink
method (Michaelsen, Knight and Fink 2004). At the end of the module, all the team members
were asked to assess the contributions that each member of the group made to the work of the
group as a whole, taking into account the level of preparation, contribution, flexibility and
respect for others. Each student distributed 100 points among other team members. All the
members of the team got the “peer evaluation factor”, which is the sum of the points they
were granted from each teammate, divided by 100. The “peer evaluation factor” is used as
presented in equations (1) and (2) to adjust individual scores. An example of the peer-to-peer
assessment is shown in Table 2 for a team composed of eight members. Each of team
members distributed 100 points among others. In the given example, Student 1 distributed
equal number of points, Student 2 gave 10 points to Student 1 and 15 points to others,
Student 6 penalized Student 1 with no points, distributed 10 points to Students 3 and 4 and 20
points to others, etc. The awarded points for each member were summed and divided by 100,
resulting in the peer evaluation factor, which for the given example ranged from 0.55 to 1.27
for Students 1 and 2, respectively. These were used to calculate the individual marks
individual
tRAT and
individual
APP given by equations (1) and (2). As an example, the team gained
75% for tRAT and 60% for APP. Thus, the highest ranked Student 1 was awarded 95.3% and
76.2% for tRAT and APP, respectively. On the other hand, the student that was awarded the
concluded that there is a clear distinction in students’ contributions which is reflected in their
individual scores, enhancing accountability and avoiding problems associated with social
loafing. Therefore, peer assessment is an incentive for students to prepare for and participate
in the group work (Cestone et al., 2008), assuring accountability which is vital to the TBL.
Also, students may appreciate peer review process in order to avoid additional load by having
to carry their group members. Although several studies have demonstrated positive
correlations regarding peer evaluation, its drawbacks include fostering distrust and high
competitiveness (Levine, 2008). The process may also reduce student motivation to
participate unless its rules and purpose are clearly communicated and aligned with students’
expectations (Chen and Lou, 2004).
2.3. Students’ performance analysis
An analysis of the results of the readiness assurance tests (RATs) and exam were performed
in order to evaluate the acquired knowledge. Unfortunately, the ENGR160 is a new module at
the Department, and therefore, the comparative analysis with the similar results of the
previous years was not possible but the comparison with other first year modules
demonstrates similar exam scores.
2.4 Student Perception
A questionnaire comprising 18 statements related to TBL was adapted from the literature
(Vasan et al., 2009) with slight modification, as presented in Table 3. Students were asked to
anonymously respond twice: after the second week and at the end of the module. On two
disagree) to 5 (strongly agree). In addition, two open-ended questions on positive and
negative aspects of their experiences with TBL were included. The 18 questions were divided
into four categories: i) Perception of TBL (statements 1, 8, 10 and 17); ii) Significance of
group work (statements 9, 11 and 12); iii) Readiness Assurance Process (statements 2, 3, 4, 5,
6, and 7); and, iv) Engagement (statements 13, 14, 15, 16 and 18).
Sixty students (53%) and eighty six students (76%) responded to the questionnaire after the
second week and at the end of the module, respectively.
3. Results and Discussion
Although it was not possible to compare students’ performance with the similar results of the
previous years, test and exam scores suggested that the student´s understanding of the
material in the module was at least as good as in the similar Year 1 modules. Analysis of the
readiness assurance tests presented in Table 4 indicated that the average team scores were
above the average individual scores. In fact, teams outperformed individuals usually by 12%,
thus suggesting effective team interactions. This is in line with the results reported by Wiener
et al., 2009 for Year 1 medical students which showed that teams outperformed individuals
by 16.5% higher score. Similar observation was reported by Michaelsen et al. 2004 for
business students with increase of nearly 11%.
Figure 6 illustrates the difference between the highest individual member score and the team
score. For the total of 18 teams, 12 teams had negative values, indicating that 67% of the
teams had higher scores then their best individual team member. These results differ when
compared with results reported by Michaelsen et al. 2004 showing that over 99 % percent of
teams over 20 years. In another study (Michaelsen et al., 1989) involving 222 teams, 97% of
the teams outperformed their most proficient group member. This discrepancy is probably
due to the fact that this study involves far smaller number of teams.
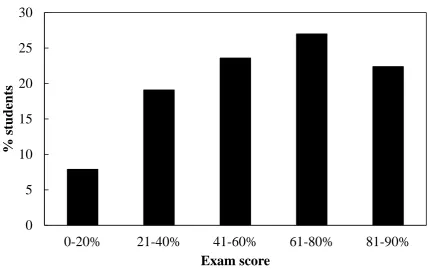
The average score of the exam was and (58.6 ± 24.4)%, respectively. As presented in Figure
7, the highest percentage of the students obtained test scores between 41-60%, which was
shifted to 61-80% range for the exam scores.
Detailed results for each statement are given in Table 2 on two occasions. Out of 115
students, 60 (52%) and 86 (75%) responded to the questionnaire after the second week and at
the end of the module, respectively. Average scores for each question in different categories
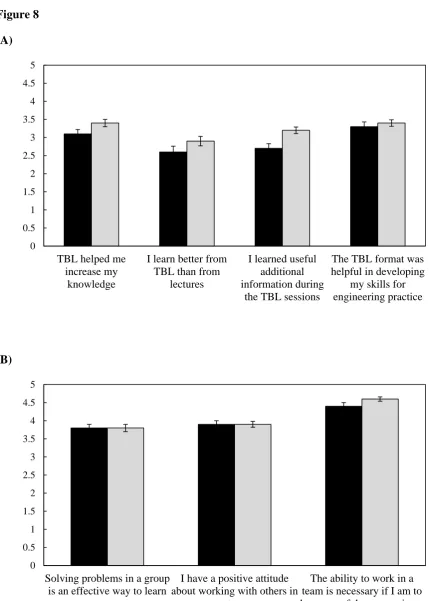
are presented in Figure 8.
The comparison of the average scores for the statements in the Perception on the TBL
category (Fig. 8 (A)) suggests that students’ attitudes were reasonably good. With regard to
how attitudes changed within a period of few weeks, average score increases were observed
on “I learn better from TBL than from lectures” and on “I learned useful additional
information during TBL sessions”. After two weeks 50% of the students strongly disagreed
or disagreed with the statement that they learned better from TBL then from traditional
lectures. However, this percentage dropped to 38% after five weeks. An even bigger shift,
from 44% to 18% of students who strongly disagreed or disagreed, was observed for Q10. It
is possible that students’ perception of the TBL increased due their adaption to working in
teams. But, these results may also suggest that the way TBL is introduced and presented
during the first session is of crucial importance as well.
The significance of group work category scored considerably more positive as it can be
observed from Fig. 8 (B). They range from the average score of 3.8 for Q9, corresponding to
effective way, to the average of 4.6 for Q12, corresponding to 98% of students who agreed or
strongly agreed that the ability to work in a team is necessary to be successful as an engineer.
No statistically significant changes were noted for students’ attitudes about the significance
of group work in two questionnaires. These positive results on the significance of group work
might be due to students’ awareness of the importance of professional development in terms
of cooperative skills.
The scores on the Readiness Assurance process are presented in Figure 8 (C). In terms of
pre-session reading, the overall average scores modestly increased. After two weeks, the average
score increased by 0.4 points, corresponding to the shift from 43% to 27% of the students
who strongly disagreed or disagreed. After a two-week period, 57% of the students strongly
agreed or agreed that iRAT were useful learning activities (Q4), which decreased to 43% at
the end of the module. On the other hand, over time, the students felt more prepared for
iRATs (Q5). A high percentage of the students agreed or strongly agreed that tRATs
activities allowed them to improve understandings (Q6) and were useful learning activities
(Q7).
The “agree” responses dominated the Engagement category (Figure 8 (D)). No statistically
significant changes along time were noted for the statements Q13 (My team worked well
together), Q14 (I contributed meaningfully to the TBL discussions) and Q18 (There was
mutual respect for other teammates’ viewpoints). The decrease of 0.3 points was observed for
the statement Q15 (Most students were attentive during TBL sessions). More detailed
analysis reveals that the decline from 61% to 41% for the students who strongly agreed or
agreed was reflected in the increase of “neutral” responses but no change was observed for
the “disagree” responses. On the other hand, the increase of percentage of students who
strongly agreed or agreed from 55% to 70% was observed for the statement Q16 (I paid
The average score for all questions in the end of module was 3.50 out of 5 which is
comparable with average score of 3.14 out of 5 for alike first year module calculated from the
report by Wang and Mott, 2015.
Approximately, 69% and 55% students responded to two open-ended questions (“what did
you like most’ and ‘suggestions for improvement”) after two weeks and at the end of module
questionnaires, respectively. Most of the positive responses involved comments on benefits
of working in teams, knowledge sharing, engagement and deep learning. Many students
enjoyed team discussions and chance to get to know their colleagues better. They valued the
opportunity to learn about how other people solve problems and a chance that someone else
in a group knows and can teach them. The TBL method “forced” many students to read the
material and learn and that was much more engaging than only following lectures.
The most disliked was the pre-session reading, and some students would prefer to have a
lecture and then applications in a team. Some students stated that they were against working
in groups as they felt forced and would prefer to work and learn at their own pace. Many
students pointed out the problems associated with participation: some people are not involved
in the group discussion or do not concentrate.
Conclusions
There is a growing interest in the implementation of the team-based learning which is
demonstrated by the increasing number of publications in the recent years, covering mainly
medicine, health and life science disciplines. This study reports on the benefits of the
team-based learning implemented for the first time within the -Year 1 engineering module at the
showed that the teams outperformed individuals by an average of 12%, suggesting an
effective team interaction. Students’ perception of TBL showed scores from 2.6 to 3.4 of 5
increasing as the module progressed, perhaps due to their increasing adaption to working in
teams. The significance of the group work category scored considerably more positive,
ranging from 3.7 to 4.6 of 5, suggesting students’ awareness of the importance of
professional development in terms of cooperative skills. In respect to the effectiveness of the
readiness assurance process, less than 20% of the students strongly disagreed or disagreed
that the tests were useful learning activities. The highest scores were observed for the
engagement category, showing good team work, mutual respect and contribution as well as
high attentiveness.
Limitations of this work include the ability to generalize results since this study took place at
a single university and in one module. Nevertheless, this experience and evaluation
demonstrate potential benefits of TBL in a first year engineering module.
ACKNOWLEGEMENT
This work was supported by the teaching development grant from the Faculty of Science and
References
Association of Universities and Colleges of Canada. 2011. Trends in Higher Education – Enrolment. AUCC. http://www.aucc.ca/wp-content/uploads/2011/05/trends-2011-vol1-enrolment-e.pdf
DeWitt J., Maciejewski, T., 2013. Snapshot Report – Degree Attainment. National Student Clearinghouse Research Center. http://nscresearchcenter.org/snapshotreport-degreeattainment3/
Biggs, J., Tang, C., 2007. Teaching for Quality Learning at University: What the Student Does. 3rd edition.
Cabrera, A.F., Colbeck, C.L., Terenzini, P.T., 2001. Developing performance indicators for assessing classroom teaching practices and student learning: The case of engineering. Res. High. Educ. 42, 327-352.
Cestone, C.M., Levine, R.E., Lane D.R., 2008. Peer Assessment and Evaluation in Team-Based Learning. New Dir. Teach. Learn. 116, 69-78.
Chen, Y., Lou, H. 2004. Students’ Perceptions of Peer Evaluation: Expectancy Perspective. J. Educ. Busin., 79, 275-282.
Chumley-Jones, H.S.; Dobbie, A., Alford, C.L., 2002. Web-based learning: Sound educational method or hype? A review of the evaluation literature. Acad. Med. 77, S86-S93.
Dolmans, D., Michaelsen, L., van Merriënboer, V., van der Vleuten, C., 2015. Should we choose between problem-based learning and team-based learning? No, combine the best of both worlds!. Medical Teacher 11, 354-359.
Farland, M.Z., Sicat, B.L., Franks, A.S., Pater, K.S., Medina, M.S., Persky, A.M. 2013. Best Practices for Implementing Team-Based Learning in Pharmacy Education. Am. J. Pharm. Educ. 77, Article 177.
Felder R.M., 1995. A Longitudinal Study of Engineering Student Performance and Retention IV: Instructional Methods and Student Responses to Them. J. Eng. Educ. 84, 361-367.
Felder, R.M., 2012. Engineering education: A tale of two paradigms. in Shaking the Foundations of Geo-engineering Education, edited by Bryan McCabe, Marina Pantazidou and Declan Phillips, 9-14. CRC Press.
Freeman, S., Eddy, S.L., McDonough, M., Smith, M. K., Okoroafor, N., Jordt, H., Wenderoth, M. P., 2014. Active learning increases student performance in science, engineering, and mathematics. Proceedings of the National Academy of Sciences of the United States of America 111, 8410-8415.
Glassey, J., Novakovic, K., Parr, M., 2013. Enquiry based learning in chemical engineering curriculum supported by computer aided delivery. Educ. Chem. Eng. 8, e87–e93.
Harris, A.T., Briscoe-Andrews, A. S., 2008. Development of a problem-based learning elective in “green engineering. Educ. Chem. Eng. 3, e15–e21.
Hmelo-Silver, C.E., 2004. Problem-based learning: What and how do students learn?. Educ. Psychol. Rev. 16, 235-266.
Klegeris, A., Hurren, H., 2011. Impact of problem-based learning in a large classroom setting: student perception and problem-solving skills. Adv. Physiol. Educ. 35, 408-415.
Lamm, M.H., Dorneich, M., Rover, D.T., 2014. Team-based learning in engineering classroom: feedback form and content adds value to the learning experience. ASSE Proceedings, Iowa City.
Levy, P., Petrulis, R., 2012. How do first-year university students experience inquiry and research, and what are the implications for the practice of inquiry-based learning?. Stud. High. Educ. 37, 85-101.
Maceiras, R., Cancela, A., Urréjola, S., Sánchez, A., 2011, Experience of cooperative learning in engineering. Eur. J. Eng. Ed. 36, 13-19.
Michaelsen, L.K., Watson, W.E., Cragin, J.P., Fink, L.D., 1982. Team-based learning: A potential solution to the problems of large classes. Exchange: The Organizational Behavior Teaching Journal 7, 18-33.
Michaelsen, L.K., Watson, W.W, Black, R.H., 1989. A realistic test of individual versus group consensus decision making. J. Appl. Psychol. 74, 834-839.
Michaelsen, L.K., Knight, A.B., Fink, L.D., 2004. Team-based learning: A transformative use of small groups in higher education. Sterling VA: Stylus.
Michaelsen L.K, Sweet. M., 2008. The Essential Elements of Team-Based Learning. New Dir. Teach. Learn. 116, 1-99.
Mills, J.E., Treagust, D.F., 2003. Engineering Education – Is problem-based or project-based learning the answer” Australasian Journal of Engineering Education 3, 2-16.
Natishan, M.E., Schmidt, L.C., Mead, P., 2000. Student focus group results on student team performance issues. J. Eng. Educ., 89, 269–272.
Nieder, G.L., Parmelee, D.X., Stolfi, A., Hudes, P.D., 2005. Team-based learning in a medical gross anatomy and embryology course. Clin. Anat. 18, 56-63.
Pekdemir, T., Murray, K., Deighton, R., 2006. A New Approach to the Final Year Design Projects, Educ. Chem. Eng. 1, 90–94.
Prince, M., 2004. Does active learning work? A review of the research, J. Eng. Educ. 93, 223-231.
Prince, M.J., Felder, R.M., 2006. Inductive teaching and learning methods: Definitions, comparisons, and research bases, J. Eng. Educ. 95, 123-138.
Price A., Chew, M.T., Rimington, R., Demidenko, S., 2010. Meeting Engineering Learning Objectives through Team Based Creative Robot Construction, in IEEE Instrumentation and Measurement Technology Conference edited by IEEE, 835-840.
Van der Loos, H.F.M., Machiel, H.F., Ostafichuk, P.M., 2009. Case Study: Application of Team-based Learning to a Mechanical Engineering Design Course Traditionally Taught in Lecture Format, in Bergendahl, M.N., Grimheden, M., Leifer, L., Skogstad, P., Ion B. (Eds.), ICED 09 - the 17th International Conference on Engineering Design 10: 171-181.
Vasan, N. S., DeFouw, D.O., Compton, S., 2009. A Survey of Student Perceptions of Team-Based Learning in Anatomy Curriculum: Favorable Views Unrelated to Grades. Anat. Sci. Educ. 2, 150-155.
Wang, C., Mott, J., 2015. Implementing Team Based Learning in a First Year Introduction to Engineering Course. In 122nd ASEE Annual Conference and Exposition: Making Value for
Society. American Society for Engineering Education, 2015 122nd ASEE Annual Conference and Exposition, Seattle, United States, 14-17 June.
Wiener, H., Plass, H., Marz, R., 2009. Team-based Learning in Intensive Course Format for First-year Medical Students. Croat. Med. J. 50, 69-76.
Wiggins, G., McTighe, J., 1998. What is backward design? In Understanding by Design. (1 ed., pp. 7–19). Upper Saddle River, NJ: Merrill Prentice Hall.
Caption to Figures
Figure 1. Team-based learning procedure.
Figure 2. Number of publications on team-based learning from 2000 to 2015 (Web of ScienceTMJuly 2016). Search word: “team-based learning” as topic for each year.
Figure 3. Number of publications on team-based learning for different countries from 2000 to 2015 (Web of ScienceTM July 2016). Search word: “team-based learning” as topic for each
country.
Figure 4. Example of backward design for TBL unit.
Figure 5. Example of answer sheet.
Figure 6. The difference between the highest member score and the team score.
Figure 7. Exam scores.
Figure 2
0 10 20 30 40 50 60 70 80 90
Nubmber
of
publications
Figure 3
0 50 100 150 200 250 300
Nubmber
of
publications
Figure 6
-25
-20
-15
-10
-5
0
5
10
15
20
25
The differ
ence betw
een
the highest
member
scor
e and the team scor
Figure 7
0
5
10
15
20
25
30
0-20%
21-40%
41-60%
61-80%
81-90%
% students
Figure 8 (A) (B) 0 0.5 1 1.5 2 2.5 3 3.5 4 4.5 5
TBL helped me increase my
knowledge
I learn better from TBL than from
lectures
I learned useful additional information during
the TBL sessions
The TBL format was helpful in developing
my skills for engineering practice 0 0.5 1 1.5 2 2.5 3 3.5 4 4.5 5
Solving problems in a group is an effective way to learn
I have a positive attitude about working with others in
a team
(C) (D) 0 0.5 1 1.5 2 2.5 3 3.5 4 4.5 5
I found it easy to complete the
pre-session reading
I found the pre-session reading helpful Individual readiness assurance tests (iRAT) were useful learning activities
I generally felt prepared for the
iRAT
The tRAT allowed me to
improve my understanding of concepts The tRAT (group) discussions were useful learning activities 0 0.5 1 1.5 2 2.5 3 3.5 4 4.5 5
My team worked well together I contributed meaningfully to the TBL discussions Most students were attentive during TBL sessions
I paid attention most of the time
Table 1. Assessment scheme.
Assignment 1st Step - Average 2nd Step – Peer evaluation contribution
Contribution to final
mark
Exam - 60% iRAT1
3
iRAT iRAT
iRAT
iRAT 1 2 3
- 20% iRAT2 iRAT3 tRAT1 3 tRAT tRAT tRAT
tRAT 1 2 3
team
tRAT individual tRAT team(Peer evaluationfactor)
10% tRAT2 tRAT3 APP n APP APP n 1 i i team
Peer evaluationfactor
APP
APPindividual team 10%
iRAT – individual readiness assurance test
iRAT - average of three individual readiness assurance tests iRAT – team readiness assurance test
team
tRAT - average of three team readiness assurance tests
individual
tRAT - average mark of team readiness assurance tests for each individual member
APP – application exercise
team
APP - average mark of application exercises for team
individual
APP - average mark of application exercises for each individual member
Table 2. Example of the peer-to-peer assessment results within a team according to Fink method
Student 1 Student 2 Student 3 Student 4 Student 5 Student 6 Student 7 Student 8 Peer Assessment
Factor
Student 1 X 10 5 10 11 0 9 10 0.55
Student 2 14.29 X 20 20 20 20 17 16 1.27
Student 3 14.29 15 X 20 20 10 17 16 1.12
Student 4 14.29 15 15 X 13 20 12 16 1.05
Student 5 14.29 15 10 10 X 10 11 10 0.8
Student 6 14.29 15 15 12.5 10 X 17 16 1
Student 7 14.29 15 15 12.5 14 20 X 16 1.07
Student 8 14.29 15 20 15 12 20 17 X 1.13
total 100 100 100 100 100 100 100 100
Table 3. Statements on the questionnaire completed by students anonymously on two occasions: two weeks after the module has begun and at the end of module. Options: 1-Strongly disagree; 2-Disagree; 3-Neutral; 4-Agree; 5-1-Strongly agree.
Aspect No Statement
Perception on the TBL
Q1 TBL helped me increase my knowledge
Q8 I learn better from TBL than from lectures
Q10 I learned useful additional information during the TBL sessions
Q17 The TBL format was helpful in developing my skills for
engineering practice
Significance of group work
Q9 Solving problems in a group is an effective way to learn
Q11 I have a positive attitude about working with others in a team
Q12 The ability to work in a team is necessary if I am to be successful as an engineer
Readiness Assurance Process
Q2 I found it easy to complete the pre-session reading
Q3 I found the pre-session reading helpful
Q4 Individual readiness assurance tests (iRAT) were useful learning
activities
Q5 I generally felt prepared for the iRAT
Q6 The tRAT allowed me to improve my understanding of concepts
Q7 The tRAT (group) discussions were useful learning activities
Engagement
Q13 My team worked well together
Q14 I contributed meaningfully to the TBL discussions
Q15 Most students were attentive during TBL sessions
Q16 I paid attention most of the time during the TBL sessions
Table 4. Average scores of iRATs and tRATs
Average score ± standard deviation Individual performance (iRATs) (74 ± 27)%