© 2019, IRJET | Impact Factor value: 7.211 | ISO 9001:2008 Certified Journal | Page 3604
Seismic Behavior of RC Flat Slab with and without Shear Wall
Technique by using Response Spectrum Analysis
Shivaraju G D
1, Usha S
2, Kumbar Bhanu Prakash
31
Assistant Professor, Department of Civil Engineering, SSIT
2
Assistant Professor, Department of Civil Engineering, BRCE
3
Former Assistant Professor, Department of Civil Engineering, MVJCE
---***---Abstract
- Earthquake resistant structures are structuresdesigned to withstand earthquakes. According to building codes, earthquake resistant structures are intended to withstand the largest earthquake of a certain probability that is likely to occur at their location. This means the loss of life should be minimized by preventing collapse of the buildings for rare earthquakes while the loss of functionality should be limited for more frequent ones. In this paper, the dynamic response of RC flat slab with bare frame and flat slab with shear wall at different location is compared with static response of the structure. Five models are considered for the analysis which includes Equivalent Static Force Method and Response Spectrum Analysis. From Equivalent static force method base shear, maximum storey drift, displacement results are obtained and from response spectrum analysis acceleration results are obtained. For all the cases zone-5, soil type-2 as per IS 1893-2002(part-1) is considered and analysed using ETABS, a commercially available finite element analysis software package.
Key words : earthquake, equivalent static force method, modal analysis, displacement, acceleration.
1. INTRODUCTION
Earthquake resistant design of RC buildings is a continuing area of research since the earthquake engineering has started not only in India but in other developed countries also. The buildings still damage due to one or the other reason during earthquakes. In spite of all the weaknesses in the structure, either code imperfections or error in analysis and design, the structural configuration system has played a vital role in disaster. Reinforced Concrete Flat Slabs are one of the most popular floor systems used in residential buildings, car parking and many other structures. They represent elegant and easy-to-construct floor systems. Flat slabs are favoured by both architects and clients because of their aesthetic appeal and economic advantage. A flat slab floor system is often the choice when it comes to heavier loads such as multi-storey car parking, libraries and multi-storey buildings where larger spans are also required. Flat slab building structures are significantly more flexible than traditional concrete frame/wall or frame structures, thus becoming more vulnerable to second order p-effects under seismic excitations. Therefore, the characteristics of the seismic behaviour of flat slab buildings suggest that additional measures for guiding the conception and design of these structures in seismic regions are needed.
Reinforced Concrete (RC) buildings often have vertical Slab-like RC walls called Shear Walls or structural walls in addition to slabs, beams and columns. These RC walls are referred as shear walls because they resist a high proportion of the shear due to the lateral loads. However, failures of RC walls are not necessarily dominated by shear deformations. Shear walls define as vertically oriented wide beams that carry earthquake loads to the foundation. It can also be defined as a slender vertical cantilever resisting the lateral load with or without frames.
In this paper, the dynamic response of RC flat slab with bare frame and flat slab with shear wall at different location is compared with static response of the structure is studied. Five models are considered for the analysis which includes Equivalent Static Force Method and Response Spectrum Analysis. From Equivalent static force method base shear, maximum storey drift, displacement results are obtained and from response spectrum analysis acceleration results are obtained. For all the cases zone-5, soil type-2 as per IS 1893-2002(part-1) is considered and analysed using ETABS, a commercially available finite element analysis software package.
2. EQUIVALENT STATIC FORCE METHOD
The seismic force effect on the structure can be translated to equivalent lateral force at the base of the structure and then this force will be distributed to the different stories and then to the vertical structural elements (frames and/ or shear walls)
The static lateral force procedure may be used for the following structures:
a. All structures, regular or irregular, in Seismic Zone 1 and in Seismic Zone 2.
b. Regular structures under 240 feet (73,152 mm) in height.
c. Irregular structures not more than five stories or 65 feet (19,812 mm) in height.
d. Structures having a flexible upper portion supported
© 2019, IRJET | Impact Factor value: 7.211 | ISO 9001:2008 Certified Journal | Page 3605
portion is at least 10 times the average story stiffnessof the upper portion and the period of the entire structure is not greater than 1.1 times the period of
the upper portion considered as a separate structure fixed at the base.
However, for simple regular structures, analysis by equivalent linear static methods is often sufficient. This is permitted in most codes of practice for regular, low- to medium-rise buildings. It begins with an estimation of base shear load and its distribution on each story calculated by using formulas given in the code. Equivalent static analysis can therefore work well for low to medium-rise buildings without significant coupled lateral-torsional modes, in which only the first mode in each direction is considered. Tall buildings (over, say, 75 m), where second and higher modes can be important, or buildings with torsional effects, are much less suitable for the method, and require more complex methods to be used in these circumstances (Earthquake Design Practice For Buildings, E. Booth).
Regular buildings up to around 15 storeys in height can usually be designed using equivalent static analysis; tall buildings or those with significant irregularities in elevation (sudden changes in mass or stiffness with height) or plan (separation between the centres of stiffness and mass at any level) require modal response spectrum analysis. Non-linear static or dynamic analysis (time history analysis) is becoming more common in design practice, and has for many years been mandatory in Japan for buildings taller than 60m.
3. RESPONSE SPECTRUM ANALYSIS
In order to perform the seismic analysis and design of a structure to be built at a particular location, the actual time history record is required. However, it is not possible to have such records at each and every location. Further, the seismic analysis of structures cannot be carried out simply based on the peak value of the ground acceleration as the response of the structure depend upon the frequency content of ground motion and its own dynamic properties. To overcome the above difficulties, earthquake response spectrum is the most popular tool in the seismic analysis of structures. There are computational advantages in using the response spectrum method of seismic analysis for prediction of displacements and member forces in structural systems. The method involves the calculation of only the maximum values of the displacements and member forces in each mode of vibration using smooth design spectra that are the average of several earthquake motions.
4. DESCRIPTION AND MODELLING OF BUILDING
A 3D RC frames with 5 bay by 4 bay and 7(G+6) storey of dimension 25mx16mx23.5m, has been taken for seismic analysis. Five building models are considered for comparison:
Model-1: Bare Frame with Flat Slab (BFFS)
Model-2: Exterior Shear Wall with Flat Slab (E-SWFS)
Model-3: L-Shaped Shear Wall with Flat Slab (L-SWFS)
Model-4: Rectangular Shear Wall with Flat Slab (R-SWFS)
Model-5: Lift core Shear Wall with Flat Slab (LC-SWFS)
5. LOAD CONSIDERATION
The following loading standards are considered on the models during analysis
A. Gravity and Lateral loads
The RC frames comprises of columns, beams and flat slabs. Analysis of the frames is done using ETABS 9.7.1 software. The structural systems are subjected to 3 types of Primary Load Cases as per provisions of Indian Standard Code of Practice for Structural safety of Buildings, loading standards IS 875-1987 (Part I and II) and IS 1893 2002(Part I) they are:
i. Dead Load case (Vertical or Gravity load), denoted as
“DL”
ii. Live Load case (Vertical or Gravity load), denoted as
“LL”
iii. Floor Finish case (Vertical or Gravity load), denoted as “FF”
iv. Seismic Load in X-direction (Lateral or Earthquake
load), denoted as “Ex”
v. Seismic Load in Y-direction (Lateral or Earthquake
load), denoted as “Ey”
B. Gravity Loads
Gravity loads on the structure include the self-weight of beams, columns, flat slabs. The self-weight of beams and columns (frame members) and flat slabs (area sections) is automatically considered by the program itself.
i. Dead Load (DL)
The dead load is considered as per IS 875-1987 (Part I-Dead loads), “Code of Practice for Design Loads (Other than Earthquake) for Buildings and Structures”.
Unit weight of Reinforced Concrete = 25 kN/m3
Floor finishes = 2 kN/m2
ii. Imposed/Live Load (LL)
© 2019, IRJET | Impact Factor value: 7.211 | ISO 9001:2008 Certified Journal | Page 3606
Imposed load on slab = 4 kN/m2
Imposed load on roof = 4 kN/m2
C. Lateral Loads
i. Equivalent static lateral force method
The earthquake load is considered as per the IS 1893-2002(Part 1). The factors considered are
Zone factor (z) = 0.36
Soil type = medium (Type-2)
Importance factor (I) = 1.0
Response reduction factor (R) =3.0
Time period,
For bare frame Ta = 0.075* h 0.75
Ta = 0.075* (22) 0.75 = 0.76 sec
For shear wall Ta = (0.09* h)/(sqrt of D)
Where D = base dimension in ‘m’
h = height of the building above the ground level in ‘m’
For D=25m in X-direction
Ta = (0.09* 22)/ (sqrt of 25) = 0.396 sec
For D=16m in Y-direction
Ta = (0.09* 22)/ (sqrt of 16) = 0.495 sec
ii. Response Spectrum Method
The earthquake load is considered as per the IS 1893-2002(Part 1). The factors considered are
Soil Condition: Medium soil
[image:3.595.43.547.51.755.2]Damping: 5%
TABLE-1: SEISMIC ZONES AS PER IS 1893(PART 1):2002
Seismic
Zone II III IV V
Seismic
Intensity Low Moderate Severe Very Severe
Zone
Factor (Z) 0.10 0.16 0.24 0.36
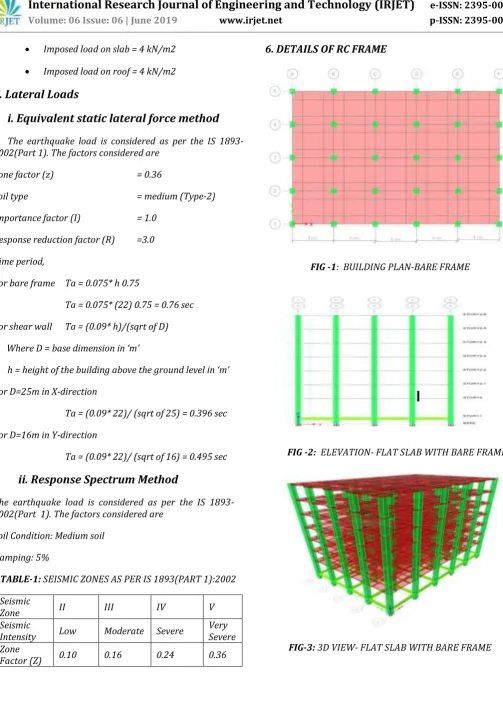
6. DETAILS OF RC FRAME
[image:3.595.308.559.113.298.2]FIG -1: BUILDING PLAN-BARE FRAME
FIG -2: ELEVATION- FLAT SLAB WITH BARE FRAME
[image:3.595.330.533.346.482.2] [image:3.595.331.545.526.676.2]© 2019, IRJET | Impact Factor value: 7.211 | ISO 9001:2008 Certified Journal | Page 3607
A. Building Data
i. Grid System-Grid Dimensions (Plan)
Number of bays = 5 bay by 4 bay
Number of bays in X-direction = 5 bay
Number of bays in Y-direction = 4 bay
ii. Story Height
Number of Storeys =7 Storey (G +6)
Depth of foundation =1.5 m
Bottom storey =4.0 m
Other storeys =3.0 m
iii. Structural Elements Dimension
Beam size =0.2 m x 0.6 m
Column size =0.6 m x 0.6 m
Flat Slab thickness =0.20 m
Drop thickness =0.350 m
B. Material properties
i. Concrete (IS456:2000)
Grade of Concrete: M25 and M30
M25 for beams and Flat slabs
M30 for columns
Compressive strength of concrete, fck=25000 kN/m2 and 30000 kN/m2
Density of Concrete (weight per unit volume) =25 kN/m3
Modulus of Elasticity of concrete, Ef= (5000√fck) = 22.36X10⁶ kN/m2 and 27.38 X10⁶ kN/m2
Poisson’s ratio of concrete=0.2
ii.Steel (IS456:2000)
Grade of Steel: Fe 415
Yield Strength of Steel, Fy= 415000 kN/m2
C. ETABS Models of Structural Systems
Different types of frames considered for this analysis are as follows:
Model-1: Bare Frame with Flat Slab (BFFS)
Model-2: Exterior Shear Wall with Flat Slab (E-SWFS)
Model-3: L-Shaped Shear Wall with Flat Slab (L-SWFS)
Model-4: Rectangular Shear Wall with Flat Slab (R-SWFS)
Model-5: Lift core Shear Wall with Flat Slab (LC-SWFS)
FIG-4: PLAN- FLAT SLAB WITH L- SHAPED SHEAR WALL
FIG-5: ELEVATION- FLAT SLAB WITH L-SHAPED SHEAR
WALL
© 2019, IRJET | Impact Factor value: 7.211 | ISO 9001:2008 Certified Journal | Page 3608
[image:5.595.47.277.258.383.2]FIG-7: PLAN - FLAT SLAB WITH EXTERIOR - SHEAR WALL
FIG-8: PLAN - FLAT SLAB WITH RECTANGULAR- SHEAR
WALL
FIG-9:
PLAN- FLAT SLAB WITH LIFT CORE- SHEAR WALL7. RESULTS AND DISCUSSIONS
The analysis is carried out to compare the response of RC flat slab with bare frame and flat slab with shear wall with different location. Total five models are considered for the linear static and dynamic analysis which includes Equivalent Static Force Method and Response Spectrum Analysis. From Equivalent Static Force Method base shear, maximum storey drift and displacement results are obtained for zone-5, soil type-2 as per IS 1893-2002(part-1). From Response Spectrum Analysis acceleration results are obtained.
A. Storey and Base Shear
Storey and Base Shear (kN) in X Direction No. of
Storeys Model 1 Model 2 Model 3 Model 4 Model 5
Storey 6 826.49 1516.11 1515.46 1511.57 1792.21
Storey 5 1513.58 3203.75 2948.86 2994.38 3248.64 Storey 4 2014.29 4448.27 3999.87 4083.17 4309.66 Storey 3 2358.04 5317.30 4727.82 4838.84 5038.63 Storey 2 2574.27 5878.46 5192.07 5322.30 5496.96 Storey 1 2692.39 6199.37 5451.97 5594.44 5747.35
Ground
Floor TABLE -2: 2743.25 6348.70 5583.76 5737.12 5859.55 COMPARISON OF STOREY AND BASE SHEAR ALONG X DIRECTION FOR DIFFERENT MODELS
FIG-10: COMPARISON OF STOREY AND BASE SHEAR ALONG
X DIRECTION FOR DIFFERENT MODELS
From Fig. 10, it is observed that, the decrease in storey shear in bare frame (model- 1) is nearly 57%, 51%, 53% and 54% at ground floor (base level) compared to 2, model-3, model-4 and model-5 in equivalent static lateral force method for zone-5, medium soil in X-X direction. It is observed that, there is a decrease in storey shear which is nearly 69% to 78% in storey-6 compared to ground floor for all models (i.e. model-1 to model-5) and the storey shear goes on increases from storey-6 to ground floor in X-X direction in Equivalent static force method for all models (i.e. model-1 to model-5).
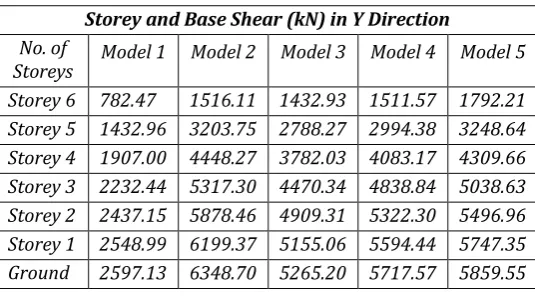
TABLE-3: COMPARISON OF STOREY AND BASE SHEAR
ALONG Y DIRECTION FOR DIFFERENT MODELS
Storey and Base Shear (kN) in Y Direction No. of
Storeys Model 1 Model 2 Model 3 Model 4 Model 5
Storey 6 782.47 1516.11 1432.93 1511.57 1792.21
Storey 5 1432.96 3203.75 2788.27 2994.38 3248.64 Storey 4 1907.00 4448.27 3782.03 4083.17 4309.66 Storey 3 2232.44 5317.30 4470.34 4838.84 5038.63 Storey 2 2437.15 5878.46 4909.31 5322.30 5496.96 Storey 1 2548.99 6199.37 5155.06 5594.44 5747.35 Ground
[image:5.595.51.272.419.551.2] [image:5.595.300.568.617.765.2]© 2019, IRJET | Impact Factor value: 7.211 | ISO 9001:2008 Certified Journal | Page 3609
FIG-11: COMPARISON OF STOREY AND BASE SHEAR
ALONG Y DIRECTION FOR DIFFERENT MODELS
From Fig. 11, it is observed that, the decrease in storey shear in bare frame (model-1) is nearly 59%, 51%, 55% and 56% at ground floor (base level) compared to 2, model-3, model-4 and model-5 in equivalent static lateral force method for zone-5, medium soil in Y-Y direction. It is observed that, there was a decrease in storey shear which is nearly 70% to 80% in storey-6 compared to ground floor for all models (i.e. model-1 to model-5) and the storey shear goes on increases from storey-6 to ground floor in Y-Y direction in Equivalent static force method for all models (i.e. model-1 to model-5).
B. Storey and Base Displacements
Storey and Base Displacement (mm) in X Direction No. of
Storeys Model 1 Model 2 Model 3 Model 4 Model 5
Storey 6 35.89 1.19 17.76 4.95 2.78
Storey 5 33.52 1.09 15.05 4.26 2.45
Storey 4 29.96 0.95 12.21 3.51 2.07
Storey 3 25.31 0.79 9.37 2.74 1.67
Storey 2 19.87 0.62 6.62 1.99 1.26
Storey 1 13.94 0.44 4.13 1.30 0.86
Ground
Floor TABLE-4:7.83 COMPARISON OF STOREY AND BASE 0.27 2.06 0.70 0.50 DISPLACEMENT ALONG X DIRECTION FOR DIFFERENT
MODELS
FIG-12:COMPARISON OF STOREY AND BASE
DISPLACEMENT ALONG X DIRECTION FOR DIFFERENT MODELS
From Fig. 12, it is observed that, there is an increase in displacement which is nearly 78% in storey-6 compared to ground floor and the displacement goes on decreases from storey-6 to ground floor in X-X direction in Equivalent static force method. This shows the displacement value is more in top floor compared to bottom floor because stiffness participation factor is more in ground floor compared to top floor in X-X direction.
It is observed that, there is a increase in displacement which is nearly 75% to 85% in storey-6 compared to ground floor for all models (i.e. model-1 to model-5) and the displacement goes on decreases from storey-6 to ground floor in X-X direction in Equivalent static force method for all models (i.e. model-1 to model-5).
Storey and Base Displacement (mm) in Y Direction No. of
Storeys Model 1 Model 2 Model 3 Model 4 Model 5
Storey 6 38.49 2.18 24.26 18.93 6.41
Storey 5 35.76 1.97 20.63 16.09 2.45
Storey 4 31.79 1.71 16.82 13.11 2.07
Storey 3 26.68 1.41 12.95 10.09 1.67
Storey 2 20.73 1.09 9.18 7.17 1.26
Storey 1 14.30 0.77 5.73 4.49 0.86
Ground
Floor TABLE-5:7.79 COMPARISON OF STOREY AND BASE 0.46 2.84 2.26 0.50 DISPLACEMENT ALONG Y DIRECTION FOR DIFFERENT
MODELS
FIG-13: COMPARISON OF STOREY AND BASE
DISPLACEMENT ALONG Y DIRECTION FOR DIFFERENT MODELS
© 2019, IRJET | Impact Factor value: 7.211 | ISO 9001:2008 Certified Journal | Page 3610
It is observed that, there is an increase in displacementwhich is nearly 79% to 92% in storey-6 compared to ground floor for all models (i.e. model-1 to model-5) and the displacement goes on decreases from storey-6 to ground floor in Y-Y direction in Equivalent static force method for all models (i.e. model-1 to model-5).
C. Acceleration
Acceleration (m/s2) in X Direction No. of
Storeys Model 1 Model 2 Model 3 Model 4 Model 5
Storey 6 1.4117 2.4036 3.0290 2.8409 2.6354
Storey 5 1.1784 2.1916 2.4063 2.3684 2.2862
Storey 4 1.0627 1.9319 1.9772 1.9523 1.9434
Storey 3 0.9979 1.6638 1.7289 1.6437 1.6466
Storey 2 0.9637 1.3954 1.5426 1.3993 1.3789
Storey 1 0.8843 1.0988 1.2897 1.1403 1.1150
Ground
Floor 0.7006 0.7435 0.9084 0.7956 0.7888
TABLE-6:COMPARISON OF ACCELERATION ALONG X
DIRECTION FOR DIFFERENT MODELS
FIG-14:
COMPARISON OF ACCELERATION ALONG XDIRECTION FOR DIFFERENT MODELS
From Fig 14, it is observed that, there is an increase in acceleration which is nearly 51% in storey-6 compared to ground floor and the acceleration goes on decreases from storey-6 to ground floor in X-X direction both in Equivalent static force and response spectrum .This shows the acceleration value is more in top floor compared to bottom floor because mass participation factor is more in ground floor compared to top floor both in X-X direction.
It is observed that, there is an increase in acceleration which is nearly 55% to 85% in storey-6 compared to ground floor for all models (i.e. model-1 to model-5) and the d acceleration goes on decreases from storey-6 to ground floor in X-X direction both in Equivalent static force and response spectrum method for all models(i.e. model-1 to model-5).
Acceleration (m/s2) in Y Direction No. of
Storeys Model 1 Model 2 Model 3 Model 4 Model 5
Storey 6 1.3917 2.4920 2.8635 3.0816 2.7172
Storey 5 1.1326 2.2332 2.2712 2.408 2.3106
Storey 4 1.0209 1.9426 1.8817 1.9822 1.9508
Storey 3 0.9697 1.6669 1.6545 1.7318 1.6771
Storey 2 0.9504 1.4056 1.4769 1.5396 1.4548
Storey 1 0.8796 1.1185 1.2368 1.2942 1.2135
Ground
Floor 0.6967 0.7666 0.8759 0.9179 0.8748
TABLE-7:COMPARISON OF ACCELERATION ALONG Y
DIRECTION FOR DIFFERENT MODELS
FIG-15:
COMPARISON OF ACCELERATION ALONG YDIRECTION FOR DIFFERENT MODELS
From Fig 15, it is observed that, there is an increase in acceleration which is nearly 50% in storey-6 compared to ground floor and the acceleration goes on decreases from storey-6 to ground floor in Y-Y direction both in Equivalent static force and response spectrum .This shows the acceleration value is more in top floor compared to bottom floor because mass participation factor is more in ground floor compared to top floor both in Y-Y direction.
It is observed that, there is an increase in acceleration which is nearly 50% to 70% in storey-6 compared to ground floor for all models (i.e. model-1 to model-5) and the d acceleration goes on decreases from storey-6 to ground floor in Y-Y direction both in Equivalent static force and response spectrum method for all models(i.e. model-1 to model-5).
8. CONCLUSIONS
© 2019, IRJET | Impact Factor value: 7.211 | ISO 9001:2008 Certified Journal | Page 3611
1. For all the structure, base shear is maximum at the
base level (ground floor). Base shear of flat slab R.C.C building with bare frame is less than the flat slab building with shear wall for different models or location because of mass participation factor are more in shear wall building compared with that of flat slab with bare frame.
2. For all the structure, displacement increases as the
height increases. Displacement of flat slab R.C.C building with bare frame is more than the flat slab building with shear wall for different models or location because of stiffness participation factor is more in shear wall building compared with that of flat slab with bare frame. Displacement value for model-2 (Exterior shear wall) is less compared with those other models (i.e. model-1, model-3, model-4 and model-5). Exterior shear wall structure gives better performance and resists lateral displacement for seismic loads.
3. For flat slab building with bare frame, response acceleration decreases with increase in the height of building, however, for flat slab with shear wall; this change is not significant because in both structures fewer members are stiffened. Flat slab with bare frame is having less acceleration value compared with that of flat slab with shear wall for different models (i.e. model-2 to model-5).
REFERENCES
[1]. Pan A and Moehle J. P, “Lateral Displacement Ductility of RC Flat Plates”. ACI Structural Journal, 86:3, 1989, pp. 250-258.
[2]. ACI-ASCE Committee 352, “Recommendations for
Design of Slab-Column Connections in Monolithic Reinforced Concrete Structures”. ACI Structural Journal, 85:6, 1988, pp. 675-696.
[3]. Erberik M.A and Elnashai A.S, “Seismic Vulnerability of Flat-Slab Structures”. Technical Report Mid-America Earthquake Center DS-9 Project (Risk Assessment Modeling), Civil and Environmental Engineering Department, University of Illinois at Urbana-Champaign, USA, 2003, 178 pages.
[4]. Megally S and Ghali A, “Design Considerations for Slab-Column Connections in Seismic Zones”. ACI Structural Journal, 91:3, 1994, pp. 303-314.
[5]. Penelis G.G and Kappos A. J, “Earthquake Resistant
Concrete Structures”, E & FN Spon, London, UK, 1997.
[6]. Sobhy B.M, “A Comparative Study for
Three-Dimensional Modeling and Design-Oriented Seismic Analysis of Mid-rise Flat Slab Buildings”. M.Sc. Thesis, Structural Engineering Department, Cairo University, Egypt, 1997.
[7]. Joshi D. S, Nene R. L, Muley M. D, Suresh Salgaonkar, “Design of Reinforced Concrete Structure for Earthquake Resistance”, Indian Society of Structural Engineers, pp.32-37.
[8]. Park R., “Capacity Design of Ductile RC Building Structures for Earthquake Resistance”, Journal of the Structural Engineer, Volume 70, No. 16, August 1 1992, pp. 279-289.