RESEARCH ARTICLE
ANALYTICAL AND EXPERIMENTAL STUDY OF RADAR SIGNALS GPR OF SOME OBJECTS
*1Faize, A.,
1Driouach, A. and
2Kaabal, A.
1
Laboratory of Communications and System, University Abdelmalek Essaaidi Faculty of Tetouan Morocco
2Optics and Photonics Equipe, University Abdelmalek Essaaidi Faculty of Tetouan Morocco
ARTICLE INFO ABSTRACT
We discuss in this work, the simulation of radar signals GPR, using Reflexw (Sandmeier, 1998) and GprMax (www.gprmax.org/~agianno/GprMax/Download/) software. Note, however, that the operation of these two programs is based on numerical methods including finite difference method (FD) for Reflexw and finite difference time domain (FDTD) for GprMax. The simulations we have performed include the following items: an iron bar, a plastic tube and a plastic water bottle. According to their simulations, these objects will be buried in the garden of the Faculty of Sciences of Granada and studied experimentally, taking direct action by the radar GPR (www.sensoft.ca), which will test the detection efficiency of this unit.
Copyright © Faize, A., et al. This is an open access article distributed under the Creative Commons Attribution License, which permits unrestricted use, distribution, and reproduction in any medium, provided the original work is properly cited.
INTRODUCTION
Note that modeling is an integral part of the interpretation of geophysical data collected by the GPR. The first work on electromagnetic numerical modeling can be attributed to the early 70s. (How-Wei and Huang 1998) They coincide with the advent of powerful and affordable microprocessors that achieve personal calculations quickly and efficiently. (Ceruzzi, 1998) The physical properties involved in any geophysical technique can be modeled using either forward modeling or inverse modeling. The first is a model of the basement which includes all relevant physical properties and uses, then the theoretical equations to simulate the response of the sensor, which determines a given technique to measure through the model. However, inverse modeling using field data as a starting point to create a model of the basement that best corresponds to the original data. For inverse modeling provides reliable results, a number of measurements and data processing must be performed. The forward modeling allows us to experiment and predict how material properties vary in the basement. The conditions under which the archaeological surveys of the GPR are made vary considerably. In addition, the exact properties of materials are usually surveyed unknown. Therefore, the forward modeling seems to be the most suitable to help make archaeological interpretations. Indeed, it allows us to experiment and predict how changes in material properties of the basement as well as those related to their dielectric properties is captured by the GPR. Because existing between the data obtained using sonar similarities,
*Corresponding author: Faize, A., Laboratory of Communications and
System, University Abdelmalek Essaaidi Faculty of Tetouan Morocco.
those obtained using seismic techniques and those obtained by a radar, the first attempts at modeling of GPR signals were inspired by methods developed the other two techniques (sonar and seismic). Since the 1970s, several methods have been proposed to simulate the GPR signals in unconsolidated sediments. Among these we find the method of moments (Aksoun and Mittra 1993) and the finite element method (Pridmore, et al., 1981). Recently, several approaches have been used to solve Maxwell's equations to model GPR reflections. These include the FDTD method is the most popular (Giraudon, 2002; Guiffaut, 2000; Yee, 1966). Currently there are on the market, several simulators based on the FDTD method for processing signals from radar GPR. We quote from this software: Reflexw (Sandmeier, 1998) GprMax (www.gprmax.org/~agianno/GprMax/Download/), GPR-Slice (Goodman) and GprSim (Goodman).
Simulation of GPR signals for some objects
To simulate the GPR signals objects proposed simulators (Reflexw and GprMax) require a number of parameters, such as frequency of the antenna used, the geometry of the basement and the dielectric permittivity, magnetic permeability and conductivity electrical environments involved in the simulation.
Iron rod buried
Simulation Reflexw
To the simulation, such as by Reflexw GprMax, soil, in which the bar is buried, is simulated by dry sand whose dielectric properties are: = 3and σ = 0.01 mS / m. The bar iron,
ISSN: 0975-833X
International Journal of Current Research
Vol. 5, Issue, 12, pp.4173-4180, December, 2013
INTERNATIONAL JOURNAL OF CURRENT RESEARCH
Article History:
Received 16thSeptember, 2013
Received in revised form
20thSeptember, 2013
Accepted 05thNovember, 2013
Published online 25thDecember, 2013
Key words:
Simulation, GPR signals, Experimental.
RESEARCH ARTICLE
ANALYTICAL AND EXPERIMENTAL STUDY OF RADAR SIGNALS GPR OF SOME OBJECTS
*1Faize, A.,
1Driouach, A. and
2Kaabal, A.
1
Laboratory of Communications and System, University Abdelmalek Essaaidi Faculty of Tetouan Morocco
2Optics and Photonics Equipe, University Abdelmalek Essaaidi Faculty of Tetouan Morocco
ARTICLE INFO ABSTRACT
We discuss in this work, the simulation of radar signals GPR, using Reflexw (Sandmeier, 1998) and GprMax (www.gprmax.org/~agianno/GprMax/Download/) software. Note, however, that the operation of these two programs is based on numerical methods including finite difference method (FD) for Reflexw and finite difference time domain (FDTD) for GprMax. The simulations we have performed include the following items: an iron bar, a plastic tube and a plastic water bottle. According to their simulations, these objects will be buried in the garden of the Faculty of Sciences of Granada and studied experimentally, taking direct action by the radar GPR (www.sensoft.ca), which will test the detection efficiency of this unit.
Copyright © Faize, A., et al. This is an open access article distributed under the Creative Commons Attribution License, which permits unrestricted use, distribution, and reproduction in any medium, provided the original work is properly cited.
INTRODUCTION
Note that modeling is an integral part of the interpretation of geophysical data collected by the GPR. The first work on electromagnetic numerical modeling can be attributed to the early 70s. (How-Wei and Huang 1998) They coincide with the advent of powerful and affordable microprocessors that achieve personal calculations quickly and efficiently. (Ceruzzi, 1998) The physical properties involved in any geophysical technique can be modeled using either forward modeling or inverse modeling. The first is a model of the basement which includes all relevant physical properties and uses, then the theoretical equations to simulate the response of the sensor, which determines a given technique to measure through the model. However, inverse modeling using field data as a starting point to create a model of the basement that best corresponds to the original data. For inverse modeling provides reliable results, a number of measurements and data processing must be performed. The forward modeling allows us to experiment and predict how material properties vary in the basement. The conditions under which the archaeological surveys of the GPR are made vary considerably. In addition, the exact properties of materials are usually surveyed unknown. Therefore, the forward modeling seems to be the most suitable to help make archaeological interpretations. Indeed, it allows us to experiment and predict how changes in material properties of the basement as well as those related to their dielectric properties is captured by the GPR. Because existing between the data obtained using sonar similarities,
*Corresponding author: Faize, A., Laboratory of Communications and
System, University Abdelmalek Essaaidi Faculty of Tetouan Morocco.
those obtained using seismic techniques and those obtained by a radar, the first attempts at modeling of GPR signals were inspired by methods developed the other two techniques (sonar and seismic). Since the 1970s, several methods have been proposed to simulate the GPR signals in unconsolidated sediments. Among these we find the method of moments (Aksoun and Mittra 1993) and the finite element method (Pridmore, et al., 1981). Recently, several approaches have been used to solve Maxwell's equations to model GPR reflections. These include the FDTD method is the most popular (Giraudon, 2002; Guiffaut, 2000; Yee, 1966). Currently there are on the market, several simulators based on the FDTD method for processing signals from radar GPR. We quote from this software: Reflexw (Sandmeier, 1998) GprMax (www.gprmax.org/~agianno/GprMax/Download/), GPR-Slice (Goodman) and GprSim (Goodman).
Simulation of GPR signals for some objects
To simulate the GPR signals objects proposed simulators (Reflexw and GprMax) require a number of parameters, such as frequency of the antenna used, the geometry of the basement and the dielectric permittivity, magnetic permeability and conductivity electrical environments involved in the simulation.
Iron rod buried
Simulation Reflexw
To the simulation, such as by Reflexw GprMax, soil, in which the bar is buried, is simulated by dry sand whose dielectric properties are: = 3and σ = 0.01 mS / m. The bar iron,
ISSN: 0975-833X
International Journal of Current Research
Vol. 5, Issue, 12, pp.4173-4180, December, 2013
INTERNATIONAL JOURNAL OF CURRENT RESEARCH
Article History:
Received 16thSeptember, 2013
Received in revised form
20thSeptember, 2013
Accepted 05thNovember, 2013
Published online 25thDecember, 2013
Key words:
conductivité = 9.93. 10 S/m, is buried at a depth of 0.4 m and is located at the surface, between 4 m and 4.6 m along the Ox axis (Fig.1). Frequency simulation is set at 800 MHz. The emission and reflection of the simulated signal is recorded on a time window of 30 ns with a spatial increment of 7 cm. The results obtained are summarized and represented by the software, as radargram as in Figure 2, for example. In this figure we note the presence of two diffraction hyperbolas that indicate the presence of the iron bar around 4 m; this is exactly the depth at which it was supposed to bury this bar.
Simulation GprMax
The simulation GprMax is under the same conditions as in Reflexw, except that it adds, as an input, the value of the wavelength in the simulated environment (dry sand) =
√ = .
. . .√ = 0,07 .
Figure 3.a shows an example of the geometric model used for modeling reflected on the iron bar radar signal. Space, this time, is discretized form of cells with a spatial increment∆ = ∆ = ∆ = = 0,007 . The total simulated size is set to 7 m x 1.3m, resulting in 1000 x 185 cells ((7/Δx) x (1.3/Δx)). The
simulation result of this model is shown in figure 3a, we see revealing hyperbole of iron bar attached to the depth (0.4 m).
Plastic tube (polymer) buried
Treatment Reflexw
The purpose of plastic (polymer) is considered very low
conductivity, = 0,04 and permittivity diélectrique = 4,5. We do the simulation, as in the previous cases, in dry
Figure 1. Diagram showing the position of the iron bar in the space considered
Figure 2. Radargram bar iron buried in the dry sand at a depth of 0.4 m for the 800 MHz antenna conductivité = 9.93. 10 S/m, is buried at a depth of 0.4 m
and is located at the surface, between 4 m and 4.6 m along the Ox axis (Fig.1). Frequency simulation is set at 800 MHz. The emission and reflection of the simulated signal is recorded on a time window of 30 ns with a spatial increment of 7 cm. The results obtained are summarized and represented by the software, as radargram as in Figure 2, for example. In this figure we note the presence of two diffraction hyperbolas that indicate the presence of the iron bar around 4 m; this is exactly the depth at which it was supposed to bury this bar.
Simulation GprMax
The simulation GprMax is under the same conditions as in Reflexw, except that it adds, as an input, the value of the wavelength in the simulated environment (dry sand) =
√ = .
. . .√ = 0,07 .
Figure 3.a shows an example of the geometric model used for modeling reflected on the iron bar radar signal. Space, this time, is discretized form of cells with a spatial increment∆ = ∆ = ∆ = = 0,007 . The total simulated size is set to 7 m x 1.3m, resulting in 1000 x 185 cells ((7/Δx) x (1.3/Δx)). The
simulation result of this model is shown in figure 3a, we see revealing hyperbole of iron bar attached to the depth (0.4 m).
Plastic tube (polymer) buried
Treatment Reflexw
The purpose of plastic (polymer) is considered very low
conductivity, = 0,04 and permittivity diélectrique = 4,5. We do the simulation, as in the previous cases, in dry
Figure 1. Diagram showing the position of the iron bar in the space considered
sand at a depth 0.4 m (Figure 4). Antennas, transmitting (Tx) and receiver (Rx) move sets parallel to the ground with a pitch of 0.02 m. The model was created using the menu offered by Reflexw.
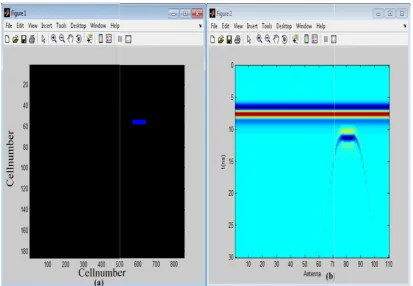
[image:3.595.95.509.118.404.2]The output from the simulation, as a radargram, is shown in Figure 5. At the depth where we placed our object, we observed two hyperboles (numbered 1 and 2) indicate the presence of it at this point.
[image:3.595.117.494.437.723.2]Figure 3. Simulation of the signals obtained by GprMax software for iron bar considered
Figure 4. Diagram representing the position of the plastic tube into the space in question sand at a depth 0.4 m (Figure 4). Antennas, transmitting (Tx)
and receiver (Rx) move sets parallel to the ground with a pitch of 0.02 m. The model was created using the menu offered by Reflexw.
The output from the simulation, as a radargram, is shown in Figure 5. At the depth where we placed our object, we observed two hyperboles (numbered 1 and 2) indicate the presence of it at this point.
Figure 3. Simulation of the signals obtained by GprMax software for iron bar considered
Treatment GprMax
Processing of the data, the plastic object, results in a 2D image shown in Figure 6.b. Again hyperbole that confirm the presence of our object depth 0.4 m is observed.
Signal simulation of a water bottle
The simulation given in this section relates to a plastic bottle containing water which is a member of high dielectric
permittivity ( = 80, = 0.5 / ). We do the simulation, as in the previous cases, in dry sand at a depth 0.4 m (Figure 7).
Treatment Reflexw
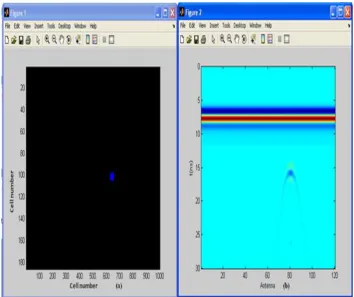
[image:4.595.110.496.64.305.2]Figure 8 shows the presence of several hyperboles that match several consecutive reflections but at different times for the frequency used (800 MHz). Indeed, the water contained in the bottle, viewed as a dielectric, has a high permittivity which Figure 5. Radargram plastic tube buried in the sand at a depth of 0.4 m for the 800 MHz antenna
Figure 6. Simulation of the object in plastic GprMax a frequency 800 MHz and a golf simulation discretized into 1000 x 180 cells
Treatment GprMax
Processing of the data, the plastic object, results in a 2D image shown in Figure 6.b. Again hyperbole that confirm the presence of our object depth 0.4 m is observed.
Signal simulation of a water bottle
The simulation given in this section relates to a plastic bottle containing water which is a member of high dielectric
permittivity ( = 80, = 0.5 / ). We do the simulation, as in the previous cases, in dry sand at a depth 0.4 m (Figure 7).
Treatment Reflexw
[image:4.595.99.494.76.600.2]Figure 8 shows the presence of several hyperboles that match several consecutive reflections but at different times for the frequency used (800 MHz). Indeed, the water contained in the bottle, viewed as a dielectric, has a high permittivity which Figure 5. Radargram plastic tube buried in the sand at a depth of 0.4 m for the 800 MHz antenna
Figure 6. Simulation of the object in plastic GprMax a frequency 800 MHz and a golf simulation discretized into 1000 x 180 cells
Treatment GprMax
Processing of the data, the plastic object, results in a 2D image shown in Figure 6.b. Again hyperbole that confirm the presence of our object depth 0.4 m is observed.
Signal simulation of a water bottle
The simulation given in this section relates to a plastic bottle containing water which is a member of high dielectric
permittivity ( = 80, = 0.5 / ). We do the simulation, as in the previous cases, in dry sand at a depth 0.4 m (Figure 7).
Treatment Reflexw
[image:4.595.111.490.320.633.2]Figure 8 shows the presence of several hyperboles that match several consecutive reflections but at different times for the frequency used (800 MHz). Indeed, the water contained in the bottle, viewed as a dielectric, has a high permittivity which Figure 5. Radargram plastic tube buried in the sand at a depth of 0.4 m for the 800 MHz antenna
Figure 7. Diagram showing the position of the bottle of water in the space considered
Figure 8. radargram a plastic bottle filled with water buried in the sand for the 800 MHz antenna Figure 7. Diagram showing the position of the bottle of water in the space considered
Figure 8. radargram a plastic bottle filled with water buried in the sand for the 800 MHz antenna Figure 7. Diagram showing the position of the bottle of water in the space considered
decreases the rate of propagation of electromagnetic waves. This explains the delay in the signal reception. In this figure we can observe the subparallel and subhorizontal interface of the bottle.
Treatment GprMax
Radar GPR issued by this same buried under 0.4 m dry sand water bottle signals are simulated using software GprMax. The transmission and reflection signals are recorded over a period of time of 30 ns. A simple calculation shows that the spatial increment equal to 0.007 m. The simulated total size is 7 m x
1.3 m which translates into 1000 x 185 cells ((7/Δx) x (1.3/Δx.)
The geometry of this model is shown in Figure 9.a The Figure 9.b shows the synthetic radargram generated by the simulator, it shows the presence of a hyperbole revealing the presence of the water bottle.
Experimental Section
[image:6.595.310.557.50.206.2]We propose in this section, the experimental study which involves the application of GPR system objects simulated in the previous section: iron rod, plastic tube, water bottle and a block of marble. The measurements are performed in the Garden of the Faculty of Sciences of Granada in Spain (Fig. 10). The acquisition, experimental data are usually accompanied by a treatment to facilitate their interpretation. Temporal amplitude compensation (or horizontal filtering) enhances the signal along each trace and is thus visually highlight contrasts and deeper structures. Applying a frequency filter helps to protect, in part, electronic artifacts and noise. For data acquisition and obtaining a radrgramme, we used a bistatic system with a shielded antenna Mala type of center frequency 800 MHz and a minimum antenna spacing (20 cm). This allows for modeling in optimal conditions.
Figure 10. Garden of the Faculty of Sciences of Granada (Spain) where the data were recorded
Iron rod buried
Following the acquisition of data for the iron rod buried at 0.4 m depth (Figure 11), we applied the processing steps listed at the beginning of this paragraph. The Treaty of the location of the metal (B-Scan) profile is shown in Figure 15. Hyperbolas that appear between 4 and 4, 5 m indicate the presence of the iron rod. For experimental parts: we note the presence of several hyperboles "noise" (Fig. 12, 14 and 16) who could testify to the existence of high conductivity materials. This could correspond to the water contained in the plant roots in the form of sap. In fact the site we have chosen is heavily wooded (trees, shrubs ...).
Plastic tube
[image:6.595.126.481.251.548.2]shown in Figure 14. Hyperbolas that appear between 4.2 and 4.5 m, on the axis x in the area indicate the presence of plastic tube to a depth of 0.4 m (around 10 ns) c 'is to tell the exact location chosen for our experiment.
Figure 11. Iron bar at 0.4 m of depth
Figure 12. Radargram corresponding to the iron rod buried
Figure 13. Photograph showing the place where the plastic was buried
Figure 14. radargram showing the location of the plastic object: hyperbole surrounded by red circles
Figure 15. Photograph showing the place where the bottle was buried
Bottle containing water
This is a bottle, plastic (20 cm length and 4 cm thick) containing 250 ml of water, placed 0.4 m deep. This sample is defined by its high dielectric permittivity and high conductivity (Fig. 15). The B-scan shown in Figure 16 indicates the presence of hyperbole (red circles in the figure) at a depth of 0.4 m.
Figure 13. Radargram the plastic bottle containing water shown in Figure 14. Hyperbolas that appear between 4.2 and
4.5 m, on the axis x in the area indicate the presence of plastic tube to a depth of 0.4 m (around 10 ns) c 'is to tell the exact location chosen for our experiment.
Figure 11. Iron bar at 0.4 m of depth
Figure 12. Radargram corresponding to the iron rod buried
Figure 13. Photograph showing the place where the plastic was buried
Figure 14. radargram showing the location of the plastic object: hyperbole surrounded by red circles
Figure 15. Photograph showing the place where the bottle was buried
Bottle containing water
This is a bottle, plastic (20 cm length and 4 cm thick) containing 250 ml of water, placed 0.4 m deep. This sample is defined by its high dielectric permittivity and high conductivity (Fig. 15). The B-scan shown in Figure 16 indicates the presence of hyperbole (red circles in the figure) at a depth of 0.4 m.
Conclusion
The simulation results we have achieved for different objects (iron bar, tube and plastic water bottle plastic) buried, show that the detection of objects buried under ground, the radar GPR is through a process signal that leads to the production of radargrams where hyperbole that appear indicate the existence of these objects, while giving their exact locations in the soil depth. To compare the results of our simulations with those obtained by the direct application of GPR unit, we made our experience at the University of Granada (Faculty of Science, Spain) in collaboration with the Spanish team of the laboratory of electromagnetism. The land of our measurements was the garden of the Faculty of Science, note that the soil of this garden was far from ideal for this kind of experience, because it was full of roots of plants, including the percentage content water is important, which makes them strong reflectors geo-radar signals. Therefore, in geo-radargrams obtained by the GPR system, we saw a large number of hyperbole indicating the positions of the roots (eg Figure 16). However, the positions where we placed our objects appear in these radargrams, hyperbole that reveal the existence of these objects at these locations.
REFERENCES
Aksoun M. I. and R. Mittra, 1993. Choices of Expansion and Testing Functions for the Method of Moments Applied to a Class of Electromagnetic Problem. IEEE transactions on Microwave Theory and Techniques society, 41: 503-509.
Ceruzzi P. E. 1998. A History of Modern Computing.MIT Press, Cambridge, Massachusetts.
Giraudon C. 2002. Contribution à la simulation électromagnétique dans le domaine temporel. Approches électromagnétique et informatique. Thèse de Doctorat de
l’université de Limoges, 148 p.
Goodman D., GPR-SLICE v7.0.Ground Penetrating Radar Imaging Software. Licensed to DeptoElectromagnetismo, University of Granada, Spain: Serial # 93.
Guiffaut C. 2000. Contribution de la méthode FDTD pour
l’étude d’antennes et de la diffraction d’objets enfouis. Thèse de doctorat de l’université de Rennes I, 219 p.
How-Wei C. and T. M. Huang 1998. FinteDifferrence Time Domain Simulation of GPR Data. Journal of Applied. Geophysics, 40: 139-163.
Pridmore D. F., G. W. Hohmann, S. H. Ward and W. R. Sill 1981. An investigation of finite-element modeling forelectrical and electromagnetic data in three dimensions. Geophysics, 46: 1009-1024.
Sandmeier K.J. 1998. Reflexw Version 4.5. Logiciel
scientifique, Licencenumber 597 licencedto “centro tecnologico del Marmol y la Piedra Spain”.
www.gprmax.org/~agianno/GprMax/Download/
Yee K. S. 1966. Numerical solution of initial boundary value problems involving Maxwell.IEEE, Transaction Antennas and Propagation, 14: 302-307.