23
Prediction of Customer Churn using Fuzzy Balanced
Probabilistic C-means Algorithm
Vallabhaneni Renuka Devi
M.Tech, CSE Dept Gudlavalleru Engineering College
Gudlavalleru, India
G. Bharathi
Professor, CSE Dept Gudlavalleru Engineering College
Gudlavalleru, India
G. V. S. N. R. V. Prasad,
PhD Professor, CSE Dept Gudlavalleru Engineering CollegeGudlavalleru, India
ABSTRACT
Churn prediction in telecom sector is a major task for any of the service providers to increase the telecom subscriber’s worldwide and also to sustain in the competition. Prediction of churners for a company is always a difficult task due to the sparsity, hugeness and unbalanced nature of data. Generally the term churn indicates the customer who is dissatisfied with the services providing by the telecom provider, likely to unsubscribe from the services or leave the company. The main intension of churn prediction is to estimate the churners and to find out the accurate causes which dissatisfy the customer. To effectively assist the telecommunication organizations, this paper provides fuzzy based clustering methods to enhance the business strategies and marketing activities. A new clustering algorithm called Fuzzy balanced probabilistic c-means with α (distance measure) is used to identify the customers those are more prone to churn. FBPCM- α has more semantic strength and accuracy than traditional FCM. This paper also addresses the different issues related to fuzzy clustering for handling the data preprocessing steps, initial centroids, unbalanced datasets, distance measures and validity indices to get qualitative clusters. Experimentation was done on china telecom data to identify analogous group of clients who are more likely to prone to churn from the telecom services.
Keywords
Fuzzy clustering, Semantic Driven Subtractive Clustering Algorithm, FBPCM- α, Churn data
1.
INTRODUCTION
Customer churn refers to shifting of customer from one company/organization to other company. Churning of customer is observed in various sectors; such as banking, financial services, telecommunication, social network services, online gaming and airlines [12] etc. This problem is mainly observed in telecom sector. So retention of customer is main concern for CRM (Customer Relationship management). Now a day’s organizations are primarily concentrating on observing the behavior of a customer in a period of time for maintaining long-term relationship with their customers. Companies are adopting various data mining or machine learning techniques for knowledge discovery process [1] to find out hidden patterns for the given information. Companies realizing that acquiring a new customer is very difficult than maintain loyalty of existing customer. This fact attracted tele companies to invest in Customer Relationship Management to uphold customer information. This customer information is collected from historical data stored in CRM. To sustain in this competitive environment there is a lot of need for service providing organizations to analyze the factors that leads to customer churn. Churning of customer effects the company’s performance is summarized as:
(i) Losing the loyal customers (retention of new customer is more difficult task).
(ii) Majorly causes the low sales because of limited customers.
(iii) Competitors can promote their business by gaining the new customers.
(iv) Overall performance of company may be affected. (v) Leading to major revenue loses.
(vi) More risk to company's popularity in the competitive environment with loss of customer base.
Churn prediction analytics helps companies/organizations to assess valuable customers and to predict the customers those are more chance to churn.Identifying the features of particular group of customers those are more risk of churning can help for business enterprises. It helps in anticipating and managing of risk factors related with churning. Recognizing the key areas that help to enlarge the business value.
1.1
Clustering
Clustering is commonly used, most powerful and popularly used unsupervised method. Main procedure of clustering involves in gathering similar objects together or objects with common features into clusters (groups). Clustering [13] is majorly familiar with analyzing the data visually and used for efficient decision making process. Clustering is broadly used in a range of applications like education, field of computer science, marketing, insurance, surveillance detection, fraud detection and scientific discovery to mine the functional information from the data. The selection of distance measures and the category of data that a clustering algorithm cans effort is a decisive step in clustering. It defines how two elements are resemblance with each other and how this resemblance will impact the outline of the clusters. Another foremost difficulty in clustering process is to determine the goodness or validity of the cluster.
24 algorithms cannot handle the churn data efficiently. Because of
the fuzziness in churn data and due to the unbalanced data. b) Definition of “customer churn” in terms of fuzzy concept is a difficult task. For example how a company will define the customer loss? Is it based on no calling within or in arrears for more than 3 months (both prepaid and postpaid customers)? Is it based on elimination of telephone numbers etc. We need to define a set of rules that define the customer churn problem.
1.2
Imbalanced data
Imbalanced data or class imbalance is major problem facing by many of data mining and machine learning algorithms. The overall performance of the ML techniques can be degrades because of Imbalance data sets. As well as the overall accuracy also effects and decision making will be biased to the only majority class, this leads to formation of noisy data and also results in misclassification of classes in the minority class samples. This paper mainly concentrates on providing solution for class imbalance problem by using modification of existing fuzzy algorithms like FCM. Also while clustering choosing of approximates distance measure also provides solution.
In data preprocessing stage if dataset contains majority observations to one class and minority observations to another class leads to class imbalance. Simply imbalance data occurs when there is disparity or inequality among the response or class variable. This problem can be explained by using following example.
Consider a data set consisting of 3333 observations. This data set consists of description related to telecom churn data. Class label is churn. It contains two classes whether customer will churn or not. In 3333 observations: 2850 observations belong to class 1 and 483 observations belong to class 2. I.e. class1 probability is 0.8550855 and class2 probability is 0.1449145. Some of the reasons why imbalance data effect the performance of algorithms:
i) When there is disparity or inequality among the response or class variable, the accuracy of ML algorithm degraded. ii) This causes the biased towards majority class and less bias
towards minority classes.
iii) The overall error to which the minority class contributes very less.
iv) ML algorithms imagine that the considered data set has unbalanced class distributions.
v) They also imagine that errors obtain from various different classes have same cost.
Solution for Imbalanced data:
In data preprocessing stage some sampling methods can be used to balance data. Some of the sampling methods are under sampling, oversampling and synthetic data generation. But this results in varying the size of original data. Under sampling method try to reduce the records from majority class. Oversampling tries to increase the number of records from minority class. From these ways the ratio of the classes can be balanced. But by applying these methods the size of original dataset is varying a lot. So there is a need to propose an algorithm which itself can handle the dataset without any modification of data initially. This can be done by introducing a new algorithm called Fuzzy balanced probabilistic c-means with α (FBPCM- α).
2.
RELATED WORK:
Several researches were done on this churn prediction. Previously many researchers provide a lot of effective ways in handling the literature for customer churn data management problem. Several analytical techniques such as machine learning, statistical measure models and various data mining approaches can be used. Castro and Tsuzuki introduced a frequency approach analysis based on (KNN)[2] k-nearest neighbor’s machine learning algorithm for major attribute representation from data base login records for churn analytical modeling. Another neural network model is used to identify the top key attributes affecting churn based on the 80-20 rules [3, 4]. Awnag et al proposed regression customer churn prediction methods [5] that identify churners by multiple regression analysis. This model utilizes the small amount of customer feature data to generate good performance. Au et al proposed a (DMEL) data mining by evolutionary learning technique [6], to handle the classification problems. Furthermore, it is extended to predict different churn rates regarding telecom subscriber dataset. By using DM methods such as neural network, Decision tree and K-means, constructed predictive models for telecom data. Their empirical evaluation suggests that DM techniques can effectively recommend telecom company providers to make valuable and more accurate decisions. Verbraken et al. designed cost based benefit analysis [7] architecture to achieve maximum profit criterion. This architecture is then applied on churn data to handle churn problem of cost based benefit structure. Some of the genetic algorithms are also proposed by Idris et al [8]. In to handle this problem. Huang et al. in proposed a Meta heuristics [9] for handling the complex features of data, association rule generation is used to rule generation on customer churn data in telecom sector. A hybrid based firefly algorithm [10] also proposed that estimates the initial centroids for a given data and predicts the churning of customers. Several logistic regression techniques in combination of classification algorithms are used for prediction of customer churn. Recently, a robust boosting algorithm [11] has been applied successfully in banking industry churn problem. Although some of these methods can provide a solution for customer churn, there are certain limitations on data, such as unbalanced data, size of data, fuzziness in the data etc. For a data set class imbalance plays a significant role in affecting the accuracy and reliability of a classifier. The main issue in class imbalance is the scenario where the number of observations or records belongs to one class is very significantly lesser than those records which belong to other classes.
3.
EXISTING CHURN FUZZY CONCEPT
Fuzzy based clustering method usually calculates the conditional probabilities of class and then class is chosen based on the expected probability. In contrast, non-fuzzy clustering method directly estimates the boundaries of class without any estimation of probabilities of class.
3.1
Fuzzy c means
25
Certain condition is induced on FCM [14] as each of the entries in U lies in [0, 1]; i.e. the sum of each row should be more than zero; and the sum of each column should be equals to 1. Condition to be satisfied is:
Algorithm steps:
Step1: Initially initialize the fuzzy partition or membership matrix.
Step2: Now calculate the initial cluster centers based on Vij
Step3: Updation of membership matrix is done based on formulae Uik equation (3), Condition is that
Step4: Repeat this process until the convergence criteria
is met.
3.2
SDSCM
It is the new clustering algorithm used to produce the initial cluster centroids. It is developed by combining the fuzzy c-mean algorithm with subtractive clustering method. The cluster results from Fcm are used to pass initial parameters for the SCM in the following ways:
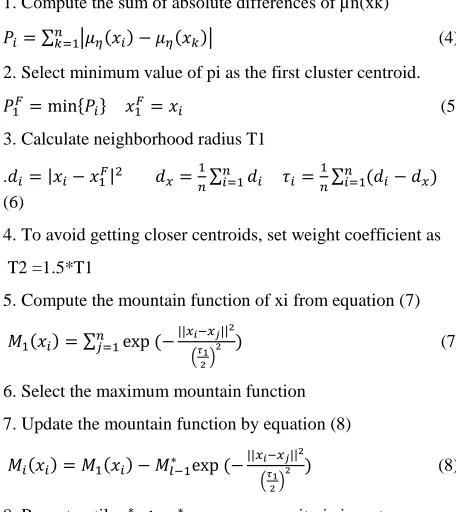
1. Compute the sum of absolute differences of µn(xk)
(4)
2. Select minimum value of pi as the first cluster centroid.
(5) 3. Calculate neighborhood radius T1
.
(6)
4. To avoid getting closer centroids, set weight coefficient as T2 =1.5*T1
5. Compute the mountain function of xi from equation (7)
(7)
6. Select the maximum mountain function 7. Update the mountain function by equation (8)
(8)
8. Repeat until convergence criteria is met. 9. Finally output the cluster centroids.
Now this initial seed points will be passed to the kmeans algorithm to obtain the desired cluster outputs.
3.3
Disadvantages
The below table 1 example contains the 4 records with two features. Now calculate the initial centroids and membership values to assign the data points to the any of two clusters.
[image:3.595.320.493.76.182.2]Example:
Table 1. Example records for FCM
X Y
1 3
1.5 3.2
1.3 2.8
3 1
First step is to assign the membership value to each data point representing 1 or 0. 1 means the data point belongs to the corresponding cluster, 0 means the data point is not belonging to the corresponding cluster.
U0= 1 1 1 0 C1
0 0 0 1 C2
Now calculate the initial centroids by using formulae. V11=1(1)+1.5(1)+1.3(1)+3(0)/(1+1+1)=1.21. Similarly calculate
[image:3.595.368.487.318.377.2]the initial centroids for all each cluster with respect to each feature as shown in table2.
Table 2. Initial centroids for FCM
V11=1.21 V21=3 V12=3.0 V22=1 C1=[1.26,3.0] C2=[3,1]
Distance between data point to each cluster centroid is calculated as shown in table 3. D11=sqrt((1-1.26)^2+(3-3)^2)
Table 3. Distance between each point to centroids
D11=0.26 D21=2.82 D12=0.31 D22=2.66 D13=0.20 D23=2.47 D14=2.65 D24=0
Now update partition matrix by Now U21 is calculated by subtracting from 1. U21=1-U11
Final membership matrix is:
U(1) 0.991 0.986 0.993 0
0.009 0.14 0.007 1
Problem for FCM:
[image:3.595.53.281.413.669.2]26
Fig 1: Problem for FCM
Disadvantages:
a. very sensitive to good initialization b. Sometimes results in coincident clusters c. May take long computational time d. Unbalanced data may not be handled well. e. More sensitivity to noise in data and outliers.
4.
PROPOSED METHODOLOGY
FBPCM- α: Fuzzy Balanced Probabilistic C Means:
To overcome the limitations of SDSCM a new clustering algorithm called FBPCM- α is proposed. In objective function along with the sum of within fuzzy fluctuations, sum of the between fuzzy cluster fluctuations are also introduced in this FBPCM- α.
Input: Unlabeled data set X={x1, x2, k,…,xn} n is the number of data point in X. R is the real number set. P is the number of features in each vector.
Output: Set of vectors Vi is called “cluster center”. Along with that a c-partition of X, which is matrix U.
Here a data point belongs to more than one cluster at a time. This algorithm main aim is to optimize the objective function as shown in equation (9):
The membership need not satisfies relationship
. Where 0 ≤ ˂ 1, 0 ≤ ˂ 1 and m > 1. Both these factors are important. To assign a data point to cluster, data point must be closest to the centroid
Membership. For typically decrease the undesirable effect of outliers on the cluster results there is a need for estimating the centroids. So remove the constraint . Introduce a new term called as shown in equation (11) which removes the constraint .
Uik is influenced by the position of all c cluster centroids.
Whereas Tik is affected by only one in c
Both of these terms are important to classify a data point because cluster centroid has to be closest to data point membership. The sum of within fuzzy cluster fluctuations must be small to optimize the objective function. The sum of between fuzzy cluster fluctuations must be large to optimize the objective function. This between cluster logic is included in
[image:4.595.317.538.79.220.2]and the within cluster logic is included in .
Table 4. Variable description for FBPCM
It describes the membership of data point xi in cluster k (where i range from 1…..C, K ranges from 1….n). is a function of Xk and all c
centroids m is the membership degree
Whereas Tik is affected by only one in clust c
It specifies the distance measure between ‘xi’ and cluster center V k
Vector of initial cluster centroids
4.1 Algorithm of FBPCM- α:
Step1: The first initialization of partition matrix is done based on initially passed centroids.
Step2: Now calculate the initial cluster centers based on Vij.
Step3: Updation of membership matrix is done based on formulae Uik and Ti,k.
Where
Step4: Repeat this process until the convergence criteria
is met.
is the one of following distance measures:
Euclidean distance , Manhattan distance , Pearson correlation distance, Eisen cosine correlation distance, Kendall correlation distance and Squared Euclidian distance measure:
. Due to the typicality of a data point to a cluster, will be normalized with respect to the distance of all n data points from that cluster.
5.
IMPLEMENTATION
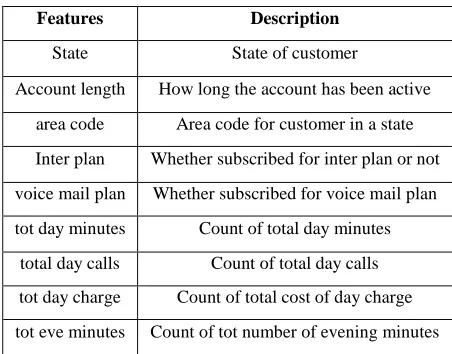
To conduct the experiment china telecom dataset is considered. Churn data set contains 3333 records with 19 attributes as shown in table 5.
Table 5. Attribute description for churn data set
Features Description
State State of customer
Account length How long the account has been active area code Area code for customer in a state Inter plan Whether subscribed for inter plan or not voice mail plan Whether subscribed for voice mail plan tot day minutes Count of total day minutes
[image:4.595.313.539.576.753.2]27 Tot eve calls Count of tot number of evening calls
tot eve charge Count of total cost of evening charge tot night min’s Count of tot no. of min’s in night time total night calls Count of tot no. of calls in night time tot night charge Count of total cost of night charge tot intl minutes Count of tot no. of international minutes
tot intl calls Count of tot no. of international calls total intl charge Count of total international charge
cust service calls Count of tot no. of service calls churn Customer will churn or not
Last attribute churn contains values 1 and 2. 1. False (customer will not churn) 2. True (customer will churn)
5.1
Data preprocessing
It is undeniable that 80% of a data scientist’s time and effort is spent in collection, integration, cleaning and preparing the data. Generally datasets consists of various sizes and different structures, this data need to be prepared to analyze the data.
5.1.1
Data Cleaning
Correcting inconsistent data. Churn data does not contain any missing values.
5.1.2
Data Integration
Schema integration, handling redundancies in data. Dataset is downloaded from https://
www
.kaggle.com/becksddf/churn-in-telecoms-dataset5.1.3
Data Transformation
Removing any noise from the data. Data is converted into common format which is used for formatting. This is done by normalization, generalization and aggregation. Z-score normalization technique is applied equation (12) to dataset for scaling the values in the range of [0, 1]. After applying normalization time required executing an algorithm is significantly reduced. Moreover accuracy will be increased.
5.1.4
Data Reduction
: [image:5.595.314.539.85.383.2]Reduction of unnecessary features of data based on requirement. Unwanted attributes from the data are removed. It is the most important decisive step to reduce the time complexity. This can be done by using clustering based feature selection methods. They are: filter methods and wrapper methods. Filter methods mainly concentrate on single factor analysis. The predictive capability of every entity variable is evaluated.
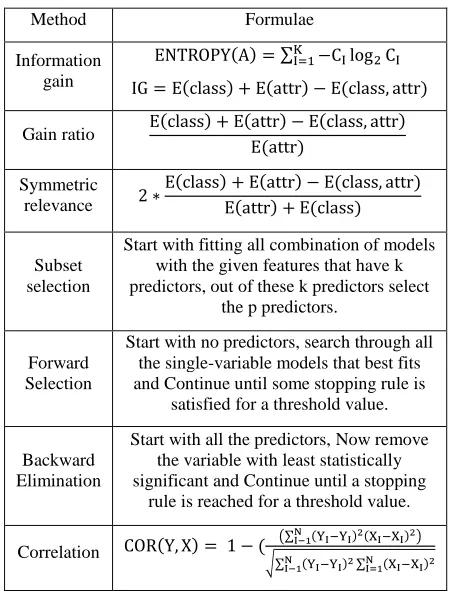
Table 6. Formulas for feature selection methods
Method Formulae
Information gain
Gain ratio
Symmetric relevance
Subset selection
Start with fitting all combination of models with the given features that have k predictors, out of these k predictors select
the p predictors.
Forward Selection
Start with no predictors, search through all the single-variable models that best fits and Continue until some stopping rule is
satisfied for a threshold value.
Backward Elimination
Start with all the predictors, Now remove the variable with least statistically significant and Continue until a stopping
rule is reached for a threshold value.
Correlation
It contains some of methods like: Information gain, correlation measure, Gain ratio and symmetrical relevance. In wrapper methods the predictive and analysis capability of the variable or feature is evaluated jointly with comparison of other variables from data set. It contains some methods like subset selection, backward subset elimination and another important one is forward subset selection methods. These can be applied the dataset based on formulas of table 6:
5.1.5
Data Discretization
Partition the range of continuous attribute of data into intervals.
6.
EVALUATION INDEXES:
To evaluate the performance of FBPCM- α following evaluation indexes are used. In general the classical indexes for analysing clustering results are betweenness (separation), withinness (compactness) and EVA. Furthermore to calculate the semantic strength new an evaluation index called SS and SSE (semantic strength expectation) is used.
a) SPT: SPT specifies the degree of separation between the clusters equation (13). The cluster quality increases with decrease in SPT.
b) CMP: CMP specifies the degree of withinness or tightness of the clusters equation (14). The cluster quality increases with increase in CMP.
(14)
28
Table 7. Variable description for evaluation indexes
Sym Description
vi
The centroid of ith cluster and ||vi|| is the number of data points belonging to the cluster with centroid vi
vj The centroid of j
th cluster
xj The data point
N The total number of data points
The membership of the jth data point
C The number of clusters
The membership of xj based on fuzzy concept
d)
SS:
Semantic strength describes the overall average membership of each cluster based on the explicit fuzzy concept equation (15). Thus if the SS is higher, then automatically membership of cluster will be higher. Variable description are shown in table 7.
[image:6.595.315.538.256.390.2]
e)
Accuracy
:
Itdescribes how well the predictions done by our model are correct from equation (16). For determining accuracy construct a confusion matrix.Table 8. Confusion matrix
MATRIX Same cluster Distinct clusters Same class true positive(TP) false negative(FN) Diff classes false positives(FP) true negative(TN)
From table 8 TP denotes true positive, it occurs while taking a decision to assign two similar points to the same cluster, TN denotes a true negative; it occurs while taking a decision to assign two unequal or dissimilar points to the distinct clusters. FP denotes false positive, it occurs while taking a decision to assign two unequal or dissimilar points to the identical cluster. FN denotes the false negative it occurs while taking a decision to assigns two alike or similar points to distinct clusters.
f)
SSE
:
Moreover SSE is defined as the product of maximum clustering accuracy and Semantic strength of cluster., Where E represents the Accuracy. The rise in value of SSE results in increase of quality of clustering.
7.
RESULTS AND EXPERIMENTAL
ANALYSIS:
7.1
Data normalization
Based on the dataset preprocessing techniques need to be applied. Basic k-means algorithm is applied on the churn dataset to find out best normalization technique that optimizes the accuracy and reducing time complexity. The results indicate that without applying normalization technique, by applying algorithm directly takes 3.5 minutes for execution. So Z-score normalization technique is applied as show in table 9. Z-score Normalization executes in 1.463876 seconds, accuracy=0.48453.
Table 9. Normalization results
Technique Time Accuracy
Without normalization 3.528135 minutes 0.3595545 Z-score Normalization 1.463876 seconds 0.48453
7.2
Data Reduction
: Without applying featureselection the clustering results are obtained as shown in following figure. Clusters are not densed and well separated. So selection of important features to perform analysis is an major task. Apply clustering feature selection techniques like information gain, gain ratio, Symmetric relevance, subset selection, forward selection, backward elimination and correlation. Then check the accuracy, the technique that results in more accuracy is the best feature selection method.
Fig2: Clustering result without feature selection
As shown in table 10 information gain selects 6 features, gain ratio selects 10 features, Symmetric relevance selects 10 features, subset selection selects 7 features, forward selection selects 6 features, backward elimination selects 6 features and correlation selects 9 features. Among these information gain measure results in more accuracy. It selects the attributes total day minutes, total day charge, customer service calls, international plan, voice main plan, total international minutes and total international charge as an important features.
Table 10. Feature selection results
Feature selection Number of
features selected Accuracy
Information gain 6 0.5334533
Gain ratio 10 0.45689
Symmetric relevance 10 0.432589
Subset selection 7 0.530153
Forward selection 6 0.43265
Backward elimination 6 0.496285
Correlation 9 0.526955
7.3
kmeans
29 and number of iterations will vary as shown in table 11. Initial
[image:7.595.313.559.102.284.2]seed points should be obtained from FBPCM-α algorithm.
Table 11. Results for k-Means
Centers Accuracy Time Iterations Iter1 1675 1657 0.54875 1.69845 17 Iter2 1658 1675 0.5489 1.45966 10 Iter3 1676 1657 0.4551 1.512545 11 Iter4 1600 1673 0.36545 1.546545 12
Iter……. ………. ………. …….. ………
Iter99 1675 1658 0.65455 1.5456 10 Iter100 1673 1600 0.98445 1.78566 18 Average 0.5560771 1.0713902 10.42
7.4
FBPCM- α
[image:7.595.81.254.403.542.2]Membership values: Table 12 shows the membership value of each data point from 1 to 3333 to the corresponding clusters. The data point with the maximum membership value is assigned to a corresponding cluster. Example the for data point one the membership value for cluster 1 is 0.3171747 and for cluster 2 is 0.6828253. So the data point one will be assigned to the cluster 2. The table 13 shows the initial cluster centroids returned by the FBPCM algorithm. Totally for every feature with respect to the cluster the centroid will be returned.
Table 12. Membership values for FBPCM algorithm
Cluster 1 Cluster 2 1 0.3171747 0.6828253 2 0.5594513 0.4405487 3 0.3059092 0.6940908
………. …… …….
[image:7.595.307.547.484.704.2]3331 0.56745 0.44310 3332 0.4539787 0.5460213 3333 0.3830760 0.6169240
Table 13. Initial cluster centroids returned by FBPCM
Inter plan Voice plan Tot day min’s Clust1 -0.003713760 -0.6183035 0.00104126 Clust2 0.009711361 1.6168435 -0.0027228
Tot day charge Tot intl min Custservice calls Clust1 0.001042230 0.000814844 0.01102061 Clust2 -0.002725398 -0.00213071 -0.02881853
7.5
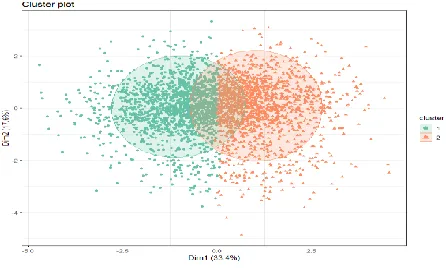
Clustering results
The figure 3 shows two clusters. Cluster 1 designates the customers those are not churn and cluster 2 designates the customers those are prone to churn.
In Cluster1:international plan: NO, voice main plan: Yes, total day minutes: more, total day charge: low, customer service calls: low, total international minutes: low In Cluster2:
International plan: Yes, voice main plan: No, total day minutes: Less, total day charge: More, customer service calls: More, total international minutes: More
Fig3: Result of FBPCM clustering
7.6
Evaluation indexes for churn dataset
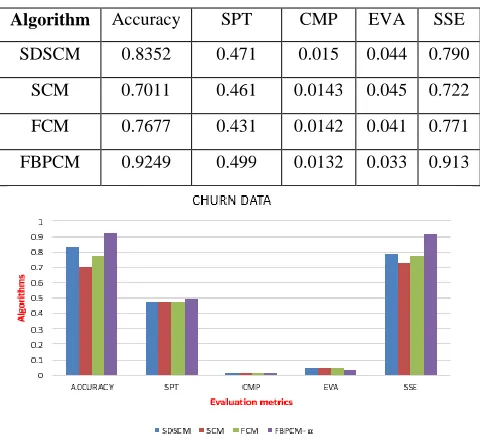
The table 14 shows the evaluation indexes like accuracy, CMP, SPT, EVA and SSE for various algorithms. Among these algorithms FBPCM- αresults in more accuracy. Moreover SPT is higher, CMP is lower, EVA is lower and SSE is maximum which results in increase of quality of cluster. So FBPCM has the more accuracy, high separation, low compactness, low EVA and higher SSE. So FBPCM algorithm gives the better clustering results compared to the other algorithms such as SDSCM, SCM and FCM. Fig 4 shows the bar plot representation of evaluation indexes among all algorithms the highest accuracy is 0.9249626 for FBPCM algorithm, Highest SPT is 0.4998145 for FBPCM, low CMP 0.01326774 is for FBPCM algorithm, low EVA is 0.03334784 for FBPCM algorithm, Highest SSE is 0.91371 for FBPCM algorithm.
Table 14. Evaluation index table for churn data
Algorithm Accuracy SPT CMP EVA SSE
SDSCM 0.8352 0.471 0.015 0.044 0.790 SCM 0.7011 0.461 0.0143 0.045 0.722 FCM 0.7677 0.431 0.0142 0.041 0.771 FBPCM 0.9249 0.499 0.0132 0.033 0.913
Fig4: Bar plot representation for evaluation indexes
[image:7.595.51.287.568.672.2]30 minutes in a day, paid the less charge and who does less
number of customer calls have low risk of churning. Those customers who subscribed for international plan, talk less minutes in a day, paid the high charge for talk time, who not subscribed for voice mail plan and who does more number of customer calls have more porn to churn.
Fig5: Semantic Strength for FBPCM clustering algorithm
8.
CONCLUSION
In this paper, mainly concentrate on providing the marketing companies with most effective techniques to reduce the churning of customers. First proposed a new clustering method called FBPCM based on FCM and PFCM. FBPCM improves clustering accuracy of SDSCM and K-means. Moreover, it reduces the risk of vague operations by using fuzzy concept. Experiment results indicate that FBPCM has stronger clustering semantic strength than SDSCM and FCM. Secondly, the customer churn problem in China telecom data is solved with FBPCM clustering algorithm. In this case, the Evaluation indexes are measured to test the performance issues related to the proposed FBPCM clustering algorithm. Experimental results indicate that the marketing simulation activities are essential to retain maximizing profits for organizations. Moreover the organizations should concentrate on loyal customer’s retention and need to pay more attention towards customers. In conclusion, the whole process of solution for customer churn in China Telecom has presented the novel insights for service providers, managers to expand the level of customer churn management more accurately. In the future, the algorithm can be improved further to validate the effectiveness in terms of other risk analysis and can use more abundant platform like big data for implementation.
9.
ACKNOWLEDGMENTS
I would like to thank the Department of Computer Science Engineering and Gudlavalleru engineering college of Engineering, Gudlavalleru, India.
10.
REFERENCES
[1] B. Huang, B. Buckley, M.T. Kechadi “Customer churn prediction in telecommunications”, in Expert Syst. 1414– 1425 Appl. 39 (1) (2012).
[2] Emiliano G. Castro ; Marcos S. G. Tsuzuki “Churn Prediction in Online Games Using Players’ Login Records: A Frequency Analysis Approach” in IEEE
Transactions on Computational Intelligence and AI in Games (Volume: 7 , Issue: 3 ) Sept. 2015
[3] Liu J, Yang G “customer churn prediction model based on IG_NN double attribute selection” in 2nd International conference on Information Science and Engineering (ICISE), IEEE; 2010. p. 5306–9 2010.
[4] Shen Q, Li H, Liao Q, Zhang W, Kalilou K. “Improving churn prediction in telecommunications using complementary fusion of multilayer features based on factorization and construction” In: The 26th Chinese Control and Decision Conference (2014 CCDC), IEEE; 2014. p. 2250–55
[5] [5] Awang MK, Rahman MNA, Ismail MR “Data mining for churn prediction: multiple regressions approach. In: Computer applications for database, education, and ubiquitous computing”. Berlin Heidelberg: Springer; 2012. p. 318–24
[6] [6] Wai-Ho Au, Keith C. C. Chan, and Xin Yao.”A Novel Evolutionary Data Mining Algorithm with Applications to Churn Prediction” IEEE
TRANSACTIONS ON EVOLUTIONARY
COMPUTATION, VOL. 7, NO. 6, DECEMBER 2003 [7] T. Verbraken , W. Verbeke , B. Baesens “A Novel Profit
Maximizing Metric for Measuring Classification Performance of Customer Churn Prediction Models” IEEE TRANSACTIONS ON KNOWLEDGE AND DATA ENGINEERING, VOL. 25, NO. 5, MAY 2013. [8] Idris A, Khan A, Lee YS. “Genetic programming and
adaboosting based churn prediction for telecom”. In: 2012 IEEE international conference on Systems, Man, and Cybernetics (SMC), IEEE; 2012. p. 1328–32.
[9] Huang Y, Huang B, Kechadi MT. “A rule-based method for customer churn prediction in telecommunication services” Advances in knowledge discovery and data mining. Berlin Heidelberg: Springer; 2011. p. 411–22. [10]Ahmed AAQ, Maheswari D. “Churn prediction on huge
telecom data using hybrid firefly based classification”. Egyptian Informatics J (2017)
[11]Lu N, Lin H, Lu J, Zhang G ”A customer churn prediction model in telecom industry using boosting”. IEEE Trans Indust Inform 2014;10(2):1659–65.
[12]R.H. Wolniewicz, R. Dodier “Predicting customer behavior in telecommunications” IEEE Intell. Syst. 19 (2) (2004) 50–58.
[13]Pradeep Rai and Shubha Singh, “A Survey of Clustering Techniques”, International Journal of Computer Applications (0975-8887) Vol 7-No. 12, pp. 1-5, October 2010
[14]Pawan Kumar and Deepika Sirohi, “Comparative Analysis of FCM and HCM Algorithm on Iris Data Set”, International Journal of Computer Applications (0975 – 8887)Volume5–No.2,August2010