On the Development of Machine Learning – Based
Application Framework for Enhancing Performance of
Livestock Mobile Application Systems in Poor Internet
Service Areas
Herbert Peter Wanga
Nelson Mandela African
Institution of Science and
Technology (NM-AIST)
Arusha, Tanzania
Nasir Ghani
University of South Florida
Florida, USA
Khamisi Kalegele
Tanzania Commission for
Science and Technology
Dar es Salaam, Tanzania
ABSTRACT
In this paper, authors developed an intelligent subsystem which manages training set, finds high accuracy models, selects best model to be used, computes prediction, stores in the database, and sends to the user interface through internet during online mode, and in offline mode through developed log file and filtering method. The intelligent subsystem is one of solutions which support mobile phone systems to be executed offline, on mobile device. Prediction results can be locally stored in the database and log file while in presence of a fairly good connection environment. Thereafter, offline predictions are made available when a poor quality in connection comes.
System development covers intelligent subsystem, MySQL database development, log file, filtering of information, and Android application. Apart from viewing predictions basing on ElasticNet algorithm, the system allows a user to register, login, and access livestock market, information portal, information request, information responses, and submit daily records.
The filtering techniques are used to select part of information from the log file. The log file created on the last online activity is used to serve all the offline operations as follows: - 1) Once the user has selected the offline option in the app's interface, he/she is directed to select the breed, sex and grade. 2) Upon submission of his/her input i.e. breed, sex and grade, the system reads the log and through the filtering algorithm, the predicted price is captured and displayed to the user.
Overall, this paper makes the following six key contributions; (1) Creating a mechanism to select a subset of information between livestock keeper and server. The subset of information is used when internet fails. (2) To design and implement machine learning based sub-system that is able to select frequently asked requests and make them available to livestock keepers during the offline mode. (3) To develop a subsystem, this is ad hoc and performs model selection. (4) Model creation that evaluates more than one algorithm in our setting or context. Others compared algorithms in their settings. (5) Introduction of a smaller database that replicates information, which smallholder farmers requests online and stores them to be available during offline state. (6) Using database of the phone to store vital information.
Keywords
Machine learning; mobile application; livestock; offline system; log file; filtering; prediction; ElasticNet
1.
INTRODUCTION
Advances in information and communication technology have enabled the adoption of machine-learning techniques in all sectors to solve real-world problems in business, engineering, and science [1].
The recent advances in technology have enabled the use of electronic gadgets in everyday life [2]. In particular, these gadgets include Smartphone, which provide quite decent computing power and can support highly-specialized mobile applications. However, a review of the relevant literature shows that only a very few studies have leveraged Smartphone and mobile phone apps in the livestock sector. More importantly, as far as authors of this paper know, there are no known studies on livestock price prediction using mobile application systems.
Predicting future events based upon historic data is useful in many domains, including livestock management. Now prediction is the process of calculating the expected result value by using the observed result value. Hence in this study regression methods are used. According to [3], this particular prediction model is based on the theorized relationship between a dependent variable (livestock price) and a number of independent variables (breed, sex and grade) that are known or can be estimated.
As suggested by [4], predicting the price trend of commodities is of great interest because various institutions and individual investors or traders need to plan their decisions and policies by relying on future prices. In this regard, livestock keepers are not different. Hence there is a need to enhance performance of livestock mobile application systems., i.e., it is crucial for livestock keepers to be able to make an accurate prediction of the upcoming livestock price so they can make appropriate moves in order to either minimize their losses or maximize their profits. As [5] and [6] argued, livestock keepers have many requirements, one of them being knowing future prices.
Accurate models for livestock price prediction are essential to enhance performance of livestock mobile application systems. Price predictions are extremely important to livestock keepers, livestock field officers, financial institutions, and other participants in the livestock sector. Moreover, the success of any mobile intelligent system depends upon the performance of learning techniques implemented on mobile devices. The performance criteria of any machine learning algorithm depends upon its prediction accuracy, sensitivity, and specificity [7].
Machine learning uses data and produces a program to perform a task. In general, such algorithms can commonly be divided into three different types depending on the training data: supervised learning, unsupervised learning, and reinforced learning.
WEKA is a comprehensive suite of Java class libraries that implement many state-of-the-art machine learning and data mining algorithms [8]. Leveraging this facility, authors experiment with various techniques and choose the one producing an overall lower mean absolute percentage error (MAPE), and highest correlation coefficient.
The study uses regression methods to determine the best fit from the historical data, then develop the predictive model based upon both input and output data. The study compares various forecasting techniques that can be used in livestock price prediction (using supervised machine learning). Thereafter, authors choose the learning algorithm that shows best results. Next, it is used it to develop a model. Finally authors use the model from the training phase to make predictions.
1.1
The contribution
Overall, this study makes the following key contributions;
1. Creating a mechanism to select a subset of information between livestock keeper and server. The subset of information is used when internet fails.
2. To design and implement machine learning based sub-system that is able to select frequently asked requests and make them available to livestock keepers during the offline mode.
3. To develop a subsystem, this is ad hoc and performs model selection.
4. Model creation that evaluates more than one algorithm in our setting or context. Others compared algorithms in their settings.
5. Introduction of a smaller database that replicates information, which smallholder farmers requests online and stores them to be available during offline state.
6. Using database of the phone to store vital information.
1.2
Paper organization
The remainder of the paper is organized as follows. Section 2 identifies related works. In Section 3 presents machine learning techniques. Next, Section 4 describes the price prediction using machine learning algorithms. Section 5 details system development. Section 6 then describes the results discussion; next section 7 describes deployment of a price predictor in an Android application. Section 8 offers
some concluding remarks, finally section 9 gives acknowledgement.
2.
RELATED WORKS
There are a number of approaches for coping with price prediction around the world. However, in searching for other livestock mobile application systems for price prediction, authors found that only a very few studies have applied mobile phone apps in livestock. In addition, there are no studies on livestock price prediction using mobile applications. This is supported by [9] whose study shows that there are many smartphone agriculture apps on crop prices, weather conditions, inventory levels and innovative farming techniques and machinery. Despite of this fact, applications specifically geared for the agriculture sector are still limited, and livestock falls under this sector.
3.
MACHINE LEARNING
TECHNIQUES
Many authors have defined the term machine learning. For example, according to [10], a computer program is said to learn from experience E with respect to some task T and some performance measure P, if its performance on T, as measured by P, improves with experience E.
Alternatively, machine learning is about predicting the future based upon the past. Hence in implementing machine learning, we identified the users, the problems they had, presented solutions, and their outcomes. This effectively defined the learning knowledge. Note that the WEKA environment was used for data mining and machine learning.
3.1
Types of Machine Learning
Machine learning can be categorized into three major groups, i.e., supervised, unsupervised, and reinforcement learning [11]. These groups represent how the learning method works. Consider the details.
3.1.1
Supervised learning
In supervised learning, a labeled training set (i.e., predefined inputs and known outputs) is used to build the system model. This model is used to represent the learned relation between the input, output and system parameters. Now as suggested by [12], this type of learning works by using examples. In other words a machine is supplied with some training examples to learn a given function. Hence the machine learns the given function and it is capable to work for extrapolated examples as well. Namely, this approach develops the capability to forecast or learn new concepts or given hypotheses based upon the examples that are provided. There exists an outcome or output variable to guide the process of learning. Overall, there are many supervised learning algorithms, such as decision trees, K-Nearest Neighbor (KNN), Support Vector Machines (SVM), Artificial Neural Network (ANN) and Random Forests
3.1.2
Unsupervised learning
Unsupervised learners are not provided with labels (i.e., there is no output vector). Basically, the goal of unsupervised learning algorithms is to classify the sample set into different groups by investigating the similarity between them. As expected, these types of learning algorithms are widely used in node clustering and data aggregation problems.
samples as well as testing samples with their feature vectors to make prediction [11]. Overall, unsupervised learning can be used for organizing computing clusters, social network analysis, market segmentation, and astronomical data analysis.
3.1.3
Reinforcement Learning
Here the machine communicates with its surroundings by producing certain actions in reinforcement learning. These actions result in affecting the state of the environment, which ultimately results in the machine receiving some scalar rewards (or punishments). In other words the agent/machine receives some evaluation of actions such as a scalar reward or punishment from its surroundings [11].
In this category the goal of a machine is to learn to act in such a way that maximizes the future rewards it receives (or minimizes the punishments) over its lifetime. This learning method is also related to decision theory (in statistics and management science) and control theory (in engineering) [11].
3.2
Machine Learning Process
[image:3.595.330.528.107.240.2]Overall, machine learning follows the steps, as shown in figure 1 below.
Figure 2: Machine learning process
3.3
Learning Theory
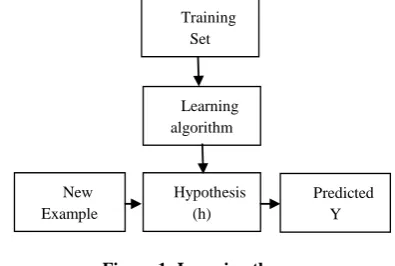
The training set comprises of a number of training examples. Here, each training example has an input variable/feature X, and output variable/target variable Y. Each row is a training example denoted by (x, y).
The training set is inputted into the machine learning algorithm to come up with a hypothesis (h). Furthermore, each new example is subjected into the hypothesis to come up with the predicted output Y.
When the target variable that authors are trying to predict is continuous, e.g., such as a livestock size against price example, that learning problem is called a regression problem. When the predicted variable Y can only take on a small number of discrete values it is called a classification problem, e.g., if given the machine learning predict what type it is (cow, goat). To make a prediction, authors take all the models and train them in the training set. The authors choose a model that has lowest training error, see Figure 2
As per [13], to train the algorithm authors feed it quality data known as a training set. The target variable is what
researchers are trying to predict with the machine learning algorithms. Meanwhile, for classification the target variable
takes on a nominal value, and in the task of regression its value is continuous. Now in a training set, the target variable is known. Hence the machine learns by finding some relationship between the features and the target variable.
The proposed Intelligent Livestock Information System (ILIS) observes specific examples from the data and then answers new, but related questions in the field. Hence a key goal here is to check whether the ILIS has the ability to generalize, i.e., generalization is perhaps the most central concept in machine learning.
4.
PRICE PREDICTION USING
MACHINE LEARNING ALGORITHMS
Livestock keepers need to know beforehand the demand for their produce so that they make sound decisions on when and where to sell them. In addition, they want to predict the price for their products. Hence the main objective of this section is to develop a machine learning model for predicting the prices, and to use the obtained price model for testing and generalization. Researchers therefore treat the price prediction task as a regression task.The section explores the structure of livestock market by predicting the price of cattle in Tanzania, basing upon historical data, using the publicly available datasets. As for prediction of livestock prices, livestock keepers need to know where and how much to sell their products in advance. Therefore this section also explores the dataset, feature selection, and approach used in prediction of livestock prices basing on historical data. Now a key goal in predicting livestock prices is to implement a tool for easy and accurate computation of a week ahead system price prediction. The key requirements here are an easy to use interface and an accurate predictive model. Namely, the model computes the prediction of livestock prices against time based on all learning algorithms that we use.
[image:3.595.57.286.330.504.2]According to [14], about 58% of households sell live animals, while only about 4% slaughtered and sold some livestock during the past 12 months. Also, 7% of households sell some milk and 11% eggs. Overall, sales of live animals contribute to about two-thirds of livestock derived income. In light of these figures, linking livestock keepers to market information and the latest prices is widely viewed as a milestone towards promoting economic growth and poverty reduction. Namely, livestock keepers need to know the future prices for their products so as to know when to sell them. Hence the main motivation here is to develop a better price prediction system that livestock keepers could use to maximize their returns.
Figure 1: Learning theory Training
Set
Learning algorithm
Hypothesis (h) New
Example
4.1
Dataset
While applying various quantitative and qualitative models for forecasting, it is essential to understand the underlying factors affecting it [15]. Thus, livestock price prediction is not an exception. Now the training data used in the study was collected from the LINKS database that is available at http://www.lmistz.net (weekly intervals), from 2005 to 2016, over a period of 11years. To perform the calculations, researchers extracted the record and the corresponding time stamps. There are a total of 3560 data examples.
Overall, it was observed that mature female and mature males of grade G2 and G3 are the most traded animals. Mature males are used for breeding and beef, whereas mature females are mainly use for milk and reproduction.
Out of all the information available, authors have identified relevant features (attributes) to be used in the prediction model, as they believe these variables contribute to the price of a livestock. Table 1 shows our choice of independent variables and dependent variable.
Table 1: Variables used in our prediction model
Independent variables Dependent variable Breed (Tzebu/ Mixed/ Sahiwal/
Ankole/ Boran) Grade (1/ 2/ 3/ 4) Sex (Male/ Female)
Price of livestock (TZS)
The data is often presented in a spreadsheet or database. However, the native data storage method in WEKA is the attribute-relation file format (ARFF) [8]. Next, authors converted Excel data into comma-separated values (CSV) format, next we converted to ARFF by using an online conversion tool from
http://slavnik.fe.uni-lj.si/markot/csv2arff/csv2arff.php.
Below is a sample part of the ARFF
@relation datasetNew
@attribute Breeds numeric @attribute Sex numeric
@attribute Grade numeric
@attribute Price numeric
@data
1 , 2 , 3 , 165000
1 , 1 , 1 , 370000
1 , 1 , 2 , 290000
1 , 1 , 3 , 195000
1 , 2 , 3 , 184000
1 , 1 , 2 , 300000
1 , 1 , 3 , 259000
1 , 2 , 2 , 222000
1 , 2 , 3 , 224300
………
4.2
Approach
According to Livestock Information Network Knowledge System (LINKS), attributes necessary for cattle price are
breed, sex, and grade. In order to use supervised learning to predict future prices, we use these features including historical prices.
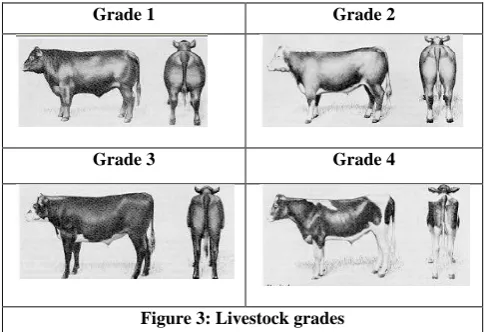
LINKS designed a grading system which consists of a combination of visual assessment of body condition (fatness) of a given breed and class of an animal. The grading system allows practical separation of livestock into more uniform groups to reduce heterogeneity within breeds and classes so as to reflect expected differences in prices. The system is based on a scale of 1 to 4 depending on visual assessment of the body condition of the animals, see figure 3 below. Sex is based in 1 for male and 2 for female. The breeds are 1 for Tzebu, 2 for Mixed, 3 for Sahiwal, 4 for Ankole, and 5 for Boran.
To predict the performance of a classifier on new data, authors need to assess its error rate on a dataset that was not used in training the classifier. This independent dataset is called the test set. Here, athors assume that both the training data and the test data are representative samples of the underlying problem [8].
The training data is used by one or more learning methods to
come up with classifiers. The validation data is used to optimize parameters of those classifiers, or to select a particular one. Next, the test data is used to calculate the error rate of the final, optimized, method [8]. Now after selecting the features, we split the dataset into a training set and a test set, setting aside 66% of the data into the training set and the remaining into the test set. The split was used to evaluate the performance of the classifier.
Experience shows that no single machine learning scheme is appropriate for all data mining problems, i.e., universal learner is an idealistic fantasy [8]. Hence in order to choose a model, authors compared different machine learning algorithms for price predictions. athors also tested different parameters to find an implementation with a reasonably low error and high performance.
5.
SYSTEM DEVELOPMENT
Based upon the requirements discussed in [16] and [17] authors developed an intelligent subsystem running an embedded ElasticNet algorithm. The intelligent subsystem is one of solutions which support mobile phone systems to be executed offline, on mobile device. Prediction results can be locally stored in the database and log file while in presence of a fairly good connection environment. Thereafter, offline
Grade 1 Grade 2
[image:4.595.305.549.331.497.2]Grade 3 Grade 4
predictions are made available when a poor quality in connection comes.
System development covers intelligent subsystem, MySQL database development, log file, filtering of information, and Android application. Apart from viewing predictions basing on ElasticNet algorithm, our system allows a user to register, login, and access livestock market, information portal, information request, information responses, and submit daily records.
5.1
Conceptual diagram
The figure 4 shows the conceptual diagram of the intelligent livestock information system. It displays how the user can send and receive queries to and from the system in the online and offline modes.
The conceptual diagram includes Smartphone, internet, remote database, intelligent subsystem, log file, and filtering algorithm.
During the online mode, user receives instant predictions and livestock information. User sends a query by submitting the required attributes, which are livestock sex, breed and grade. The query is submitted over the internet to the server. In the server, the query meets machine learning algorithm which computes and gives the output. The output is stored in the database within a server, and taken to the user interface of the android mobile phone through internet.
In the server there is machine learning algorithm which takes information from the database and attaches timestamps from system date and time. Information is then taken to the log file.
The offline mode is conducted when a user sends a query
through offline button. The query is transferred to a filtering equation. The filtering equation filters the information from
Online output
Online input
Online
output
Server
Intelligent
subsystem
Database
Online output
Smartphone
Log file
Filtering
algorithm
User Interface
Offline output
Offline input
Offline input
Online
input
the log file, and then sends the results to the user through the user interface.
In addition, offline mode requires internet at least once in two weeks to make data synchronization between a server and the log file.
5.2
Intelligent subsystem
Authors developed the intelligent subsystem which manages training set, finds high accuracy models, selects best model to be used, computes prediction, stores in the database, and sends to the user interface through internet during online mode, and in offline mode through developed log file and filtering method.
5.3
MySQL database
A database is a collection of related data, i.e., a “logical” filing cabinet. Here, this is used as a place to store a lot of information. Now SQL is a fairly simple language to save, retrieve, update, and delete information from a database in an efficient manner. We created the database comprising of specific tables. The database is located in our server.
To create a remote database authors used cpanel by entering www.mayombo.com/cpanel. Then they created a database termed Mayombo_livetzdb along with a privileged user, and added them to the database. Now in order to setup the database structures, authors used cpanel, within the database section and opened phpMyAdmin. They also opened up the database and created some tables using File Manager. They went back to the cpanel to setup configuration file. They opened the Files section. Finally, they went to the root directory of Mayombo.com and created PHP files.
5.4
Log file
Log file was developed to capture computed results from the intelligent subsystem. It is from this log file that filtering methods are used to satisfy queries from the users.
Below are lines of codes showing how a log file is generated;
//creating a log file
java.io.File file = new java.io.File("log.txt");
//an object that enables the information to be written in the log //file
java.io.PrintWriter output = new java.io.PrintWriter(file);
//the nested for loops for generating the predicted prices for //every possible
//combination of user input, each combination plus the //predicted price is written to the log file.
for (int sexLoop = 1; sexLoop <= 2; sexLoop++) { for (int gradeLoop = 1; gradeLoop <= 4; gradeLoop++) { for (int breedLoop = 1; breedLoop <= 5;
breedLoop++) {
//write formatted output to the log file, the format of each //output is breed, sex, grade, predicted price
output.print(breedLoop + "," + sexLoop + "," + gradeLoop + "," + getSumOff(breedLoop, sexLoop, gradeLoop) + "\n"); }
} }
//close the file output.close();
Every time a user checks the predicted price through online mode, the system automatically generates the log file that is saved on the user's smartphone. This log file contains all possible combinations of user inputs i.e. 5 different breed values, 2 different sex values and 4 different grade values, this makes a total of 40 different combinations. Each combination is written to a log file with an addition of the predicted price. The format of the written output is breed, sex, grade, and predicted price. The predicted price is calculated from the inputs and the equation generated from the machine learning algorithms.
5.5
Offline operation
The filtering techniques were used to select part of information from the log file. Below are lines of codes used to scan the log file:
//create a scanner for the file
java.util.Scanner input = new java.util.Scanner(file);
while (input.hasNext()) {
String value = input.next();
//substring the read value and then compare it with the user input values
int breedValue = Integer.parseInt(value.substring(0, 1)); int sexValue = Integer.parseInt(value.substring(2, 3)); int gradeValue = Integer.parseInt(value.substring(4, 5)); double predicted Price Value =
Math.abs(Double.parseDouble(value.substring(6)));
if ((breeds == breedValue) && (sex == sexValue) && (grade
== gradeValue)) {
predictedOutput = "Predicted price is " + predictedPriceValue;
} }
//close the file input.close(); }
The log file created on the last online activity is used to serve all the offline operations as follows:-
Once the user has selected the offline option in the app's interface, he/she is directed to select the breed, sex and grade.
Upon submission of his/her input i.e. breed, sex and grade, the system reads the log and through the filtering algorithm, the predicted price is captured and displayed to the user.
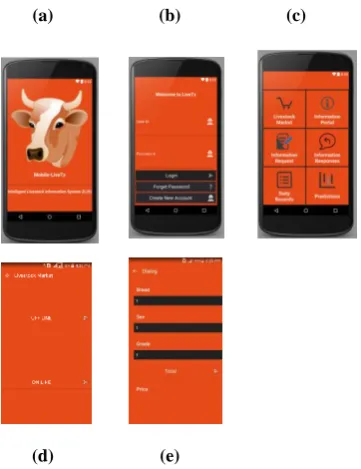
(a) (b) (c)
[image:7.595.82.263.76.311.2](d) (e)
Figure 5: The user interfaces (a) splash screen, (b) The register & Login, (c) Main, (d) Offline/ Online mode (e)
Prediction
5.6.1
Splash screen
This is a screen which serves as an initial entry point to the System. The splash screen displays a name, an interesting graphic of the application, version, and transitions automatically to the main menu screen after 5 seconds.
5.6.2
Client register and Login interface
This interface is used to identify users. Namely, it helps provide information that is relevant to them, as well as provides information about the world around them. Now when creating a new account, a user is given a unique user identification (ID), which he/she uses to login. The interface collects critical data from the users and saves it to the database, i.e., including full name, ward, district, region, village, occupation, and password.
To login to the system, user has to input his/ her user ID and password. After login, the client will visit the main user interface (UI). Namely, this is the interface for the client to choose their next action. Hence by clicking on the button, client is allowed to jump to the UI.
5.6.3
Main User Interface
The main application UI concentrates many important functions and provides various entry ports. The main menu screen serves as the main navigational screen in the system. Namely, this screen is displayed after the register and login interface and requires the user to choose where to go next. Its functionality is encapsulated within the MainActivity class. The main screen allows users to choose between livestock market, information portal, information request, information responses, daily records, and price prediction.
5.6.4
The Prediction Interface
This interface belongs to a java class Predicted.java and xml activity action-predicted.xml. The interface shows two buttons, online and offline. The prediction interface allows a user to choose either online or offline service. In case of continuous internet mode, a user can use any mode, online or
offline. But in case of isolated mode a user has to use offline mode.
5.6.5
Offline/ Online mode
The application checks for internet connection once the online button is pressed. In case there is no internet service the application returns a notification that “Network isn’t available”.
In case internet service is available the application goes to the interface activity-predicted.xml. Same interface is used to collect attributes and submit request using offline mode.
This interface allows a user to enter the breed, sex and grade of the livestock. User presses the button named total. The request is submitted to the server through the link http://mayombo.com/livetzscripts/predictedPrice.php see figure 6 below.
Figure 6: File manager
[image:7.595.320.560.264.436.2]The php file receives the request with the grade, sex and breed attributes, uses the generated equation using ElasticNet algorithm to make calculation. See figure 7 below. Results are brought back through the function onPostExecutive. Result is displayed on phone.
Figure 7: php file for online computation
6.
RESULTS AND DISCUSSION
[image:7.595.319.553.500.656.2](MSE). A study by [18] also compared the performance measure of the prediction models by using the root mean squared error (RMSE).
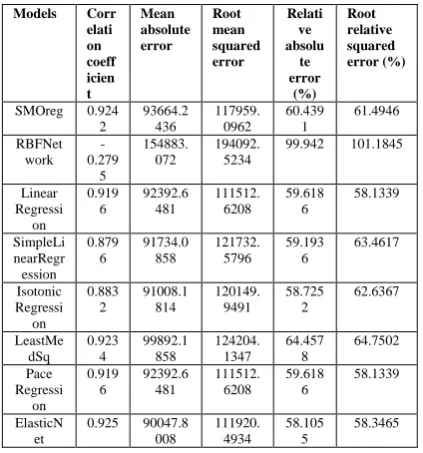
The study uses the test option of percentage split 66%. Namely, it compares the models using Correlation Coefficient, Mean Absolute Error (MAE), Root Mean Squared Error (RMSE), and Relative Absolute Error (RAE). Overall, from Table 2 it can be concluded that the SMOreg, Linear Regression, LeastMedSq, Pace Regression, and ElasticNet schemes outperformed other models.
The ElasticNet performed the best among the models, with the correlation coefficient of 0.925. Authors used the relation trainingSet which has 2349 instances, and four attributes namely breeds, sex, grade, and price. The test mode used supplied test with 1212 instances. The formula generated was
Price = 15722.287 * Breeds + 109852.641 * Sex + -112973.319 * Grade + 795784.076 ………..…….. (1)
6.1
Historical Prices
Considering the historical prices, the graph below in Figure 8 shows the price trends of livestock over time in the Arumeru
District, based upon the Themi Market in Arusha.
6.2
Price Prediction Model
Regression models are used to predict one variable from one or more other variables. In this study, the predicted price is determined by breed, sex, grade, and the corresponding historical prices. The parameters are found from the LINKS database.
The inputs are subjected into a number of learning algorithms to compare performances. From this, the algorithm with the lowest training error and highest accuracy, namely correlation coefficient, is the one selected to form a predictor. Hence when new inputs are subjected to the predictor, the predicted price is generated. The formulated ElasticNet Prediction Model is as follows:
Price = 15722.287 * Breeds + 109852.641 * Sex + -112973.319 * Grade + 795784.076
7.
DEPLOYING PRICE PREDICTOR ON
ANDROID APPLICATION
The above price predictor is deployed in the mobile application system. Researchers use the best algorithm to implement WEKA java script in the Android application to improve its intelligence.
The following is the code that authors used to load training and testing datasets. Thereafter the java codes are embedded on the Android application to form the core ILIS solution. Now the key classes in the core package are Attribute, Instance, and Instances. Namely, an object of class Attribute represents an attribute, i.e., it contains the attribute’s name, its type, and, in the case of a nominal or string attribute, its possible values. Meanwhile, an object of class Instance contains the attribute values of a particular instance, and an object of class Instances holds an ordered set of instances, i.e., in other words, a dataset [8].
package weka.api;
//import required classes
import weka.classifiers.functions.SMOreg;
import weka.core.Instances;
import weka.core.Instance;
import weka.core.converters.ConverterUtils.DataSource;
public class Prediction_regression {
public static void main (String args[]) throws Exception{
//load training dataset
DataSource source = new DataSource ("C:/Users/Cocse_admin/Desktop/livestock.arff");
Instances trainDataset = source.getDataSet();
//set class index to the last attribute
trainDataset.setClassIndex(trainDataset.numAttributes()-1);
//build model
SMOreg smo = new SMOreg();
[image:8.595.59.271.128.355.2]smo.buildClassifier(trainDataset); Table 2: Quantitative evaluation
Models Corr elati on coeff icien t Mean absolute error Root mean squared error Relati ve absolu te error (%) Root relative squared error (%)
SMOreg 0.924 2 93664.2 436 117959. 0962 60.439 1 61.4946 RBFNet work -0.279 5 154883. 072 194092. 5234
99.942 101.1845
Linear Regressi on 0.919 6 92392.6 481 111512. 6208 59.618 6 58.1339 SimpleLi nearRegr ession 0.879 6 91734.0 858 121732. 5796 59.193 6 63.4617 Isotonic Regressi on 0.883 2 91008.1 814 120149. 9491 58.725 2 62.6367 LeastMe dSq 0.923 4 99892.1 858 124204. 1347 64.457 8 64.7502 Pace Regressi on 0.919 6 92392.6 481 111512. 6208 59.618 6 58.1339 ElasticN et
0.925 90047.8 008 111920. 4934 58.105 5 58.3465
[image:8.595.53.282.577.755.2]//output model
System.out.println(smo);
//load new dataset
DataSource source1 = new DataSource ("C:/Users/Cocse_admin/Desktop/testingDataset.arff");
Instances testDataset = source1.getDataSet();
//set class index to the last attribute
testDataset.setClassIndex(testDataset.numAttributes()-1);
//loop through the new dataset and make predictions
System.out.println("============================");
System.out.println("Actual Class, SMO Predicted");
for (int i = 0; i < testDataset.numInstances(); i++){
//get class double value for current instance
double actualValue = testDataset.instance(i).classValue();
//get Instance object of current instance
Instance newInst = testDataset.instance(i);
//call classifying instance, which returns a double value for the class
double predSMO = smo.classifyInstance(newInst);
System.out.println(actualValue+", "+predSMO);
} }
}
The developed ICT solution is very advantageous for livestock keepers. Namely, the ability to predict livestock prices via a standalone mobile phone application has shown a lot of promise and encouraging results. Its effectiveness in isolated mode is particularly beneficial. In addition, the solution improves the bargaining power of the livestock keepers by letting them know the predicted price prior arriving to the market.
8.
CONCLUSION
Authors developed the intelligent subsystem which manages training set, finds high accuracy models, selects best model to be used, computes prediction, stores in the database, and sends to the user interface through internet during online mode, and in offline mode through developed log file and filtering method. The intelligent subsystem is one of solutions which support mobile phone systems to be executed offline, on mobile device. Prediction results can be locally stored in the database and log file while in presence of a fairly good connection environment. Thereafter, offline predictions are made available when a poor quality in connection comes.
System development covers Intelligent subsystem, MySQL database development, log file, filtering of information, and Android application. Apart from viewing predictions basing on ElasticNet algorithm, the system allows a user to register, login, and access livestock market, information portal, information request, information responses, and submit daily records.
The derived model provides an effective methodology for the prediction of livestock prices in Arusha, Tanzania. The results demonstrate that Linear Regression, Pace Regression, and SMOreg (a Support Vectors Machine regression method), outperform other methods. However the ElasticNet performed the best among the models, with the correlation coefficient of 0.925.
In searching for other livestock mobile application systems for price prediction results to compare with the results of our study, authors found that only a very few studies have applied mobile phone apps in livestock. However, none of these studies had considered livestock price prediction using mobile applications based on supervised learning.
Overall, the system compensates for a lack of intelligent systems and insufficient number of livestock experts in the field, and can collect better data for decision making. This study assumes that the features accessed are sufficient to predict the prices.
9.
ACKNOWLEDGMENTS
Authors hereby express the gratitude to the Nelson Mandela African Institution of Science and Technology (NM-IST), Livestock Training Agency (LITA-Tengeru), National Artificial Insemination Agency (NAIC), and Arumeru District Council for their support.
10.
REFERENCES
[1] G. M. Shafiullah, a. B. M. S. Ali, A. Thompson, and P. J. Wolfs, “Predicting vertical acceleration of railway wagons using regression algorithms,” IEEE Trans. Intell. Transp. Syst., vol. 11, no. 2, pp. 290–299, 2010.
[2] A. Akram and M. Afzal, “Architecture for Extending Agrikiosk Services to Mobile Phones ABSTRACT :,” IEEE Trans. Intell. Transp. Syst., pp. 144–148, 2008. [3] S. K. Aggarwal, L. M. Saini, and A. Kumar, “Electricity
price forecasting in deregulated markets: A review and evaluation,” Int. J. Electr. Power Energy Syst., vol. 31, no. 1, pp. 13–22, Jan. 2009.
[4] G. Atsalakis, D. Frantzis, and C. Zopounidis, “Commodities’ price trend forecasting by a neuro-fuzzy controller,” Energy Syst., 2015.
[5] H. Peter Wanga, “Towards a Framework for Enabling Operations of Livestock Information Systems in Poor Connectivity Areas,” Am. J. Softw. Eng. Appl., vol. 4, no. 3, p. 42, 2015.
[6] H. Peter Wanga, N. Ghani, and K. Kalegele, “Designing a Machine Learning – Based Framework for Enhancing Performance of Livestock Mobile Application System,” Am. J. Softw. Eng. Appl., vol. 4, no. 3, pp. 56–64, 2015. [7] S. B. Kotsiantis, “Supervised Machine Learning : A
Review of Classification Techniques,” Informatica, vol. 31, pp. 249–268, 2007.
[8] I. H. Witten, E. Frank, and M. a Hall, Data Mining: Practical Machine Learning Tools and Techniques, Second. San Francisco: Morgan Kaufmann Publishers, 2011.
[10] T. M. Mitchell, Machine Learning, vol. 4, no. 1. McGraw-Hill, 1997.
[11] A. Chaudhary and S. Kolhe, “Machine Learning Techniques for Mobile Devices : A Review,” vol. 3, no. 6, pp. 913–917, 2013.
[12] L.Rokach and O.Maimon, “Top down induction of decision trees classifiers – survey,” IEEE Trans. Syst. Man Cybern., vol. 35, pp. 476–487, 2005.
[13] Peter Harrington, Machine Learning in Action, MEAP. Manning Early Access Program, MEAP Production Version, Manning publication, 2012.
[14] C. M. Pica-Ciamarra, J. Otte, Livestock Sector Policies and Programmes in Developing Countries: A Menu for Practitioners. FAO Publishers, 2010.
[15] P. Padhan, “Application of ARIMA Model for Forecasting Agricultural Productivity in India,” J. Agric. Soc. Sci, pp. 50–56, 2012.
[16] H. Peter Wanga and K. Kalegele, “Towards a Framework for Enabling Operations of Livestock Information Systems in Poor Connectivity Areas,” Am. J. Softw. Eng. Appl., vol. 4, no. 3, pp. 42–49, 2015. [17] H. Peter Wanga, “Designing a Machine Learning –
Based Framework for Enhancing Performance of Livestock Mobile Application System,” Am. J. Softw. Eng. Appl., vol. 4, no. 3, p. 56, 2015.