Predicting Fire Outbreak Caused by Electrical Faults
using Artificial Bee Colony Algorithm
Nuka D. Nwiabu
Department of Computer Science
Rivers State University
Port Harcourt, Nigeria
Okpu E. Okpomo
Department of Computer Science,
Rivers State University
Port Harcourt, Nigeria
ABSTRACT
In Nigeria, there have been increases in damages due to fire outbreaks particularly in industrial and busy environments. Fire outbreak has caused serious injuries to people, loss of lives, damage of properties etc. Methods usually used in predicting fire outbreaks are fire alarm, flame detection, smoke detection algorithm, real-time fire, flame detection etc. This Research work introduces an artificial bee colony heuristic for predicting fire outbreaks in industrial environment in Nigeria. The artificial bee colony heuristic is a swarm-based heuristic, which mimics the foraging behavior of a honey bee swarm. In this paper, artificial bee colony technique was used for predicting fire outbreaks caused by electrical faults. Two Experiments were conducted, the first Experiment (Exp. 1) using 26 different test simulations was performed using different fault resistance, a constant colony size of 20 (area of search) and max Cycles of 5 (maximum number of iteration). It shows that when the fault resistance is between 0.3 ohms - 0.0 ohms, there will be likelihood of danger occurring among all faults at the same time, and none of the faults will be normal. While the second Experiment (Exp. 2) conducted, using 26 different test simulations was performed using different fault resistance, a constant colony size of 100 (area of search) and max Cycles of 50 (maximum number of iteration), it proves that when the fault resistance is between 0.4 ohms - 0.0 ohms, there will be likelihood of danger occurring among all faults at the same time. The results also prove good performance of the predictive ABC system for average convergence at 2.25 at 26 trials and its unique capability to make multiple predictions. The system was simulated and modeled using Matlab 7.5.0(R2007b) program.
Keywords
Artificial bee colony, fire outbreaks, swarm-based heuristic, fault resistance, colony size and max cycles.
1.
INTRODUCTION
ABC (Artificial Bees Colony) was invented by Karaboga in 2005 [1]. It is a swarm inspired evolutionary computing tool based on foraging behavior of honey bees; it is also a device, technique, method and approach to everyday optimization drawbacks [2].The ABC method is well suited for task that needs minimization function set. In [3], ABC technique basically employs three core stages: Employed Bees Phase, Onlooker Bees Phase and Scout Bees Phase. In [4], the key advantages of the Artificial Intelligence Technique (ABC) over other optimization methods include its simplicity and flexibility, use of fewer control parameters and ease of hybridization with other optimization technique.
Artificial bee colony method has been applied or used for predictive systems or uncertainty situation like Predicting weekly discharge using Artificial Neural Network optimized
by Artificial Bee Colony (ABC) technique was proposed by [5]. ABC algorithm was modified to optimize the parameters of support vector machine for Predicting Bankruptcy by [6] and was used for Edge detection by [7]. XOR-based artificial bee colony algorithm for binary optimization by [8] and LSSVM-ABC Algorithm for Stock Price prediction by [9] are all works done using Artificial Bee Colony. However, Artificial Bee Colony technique has not been used in predicting fire outbreaks caused by electrical faults. In Nigeria, for instance there have been increases in damages due to fire outbreaks particularly in industrial and busy environments.
In this paper, an optimizing predictive system (OPS) was developed, using a modified version of the ABC algorithm. Specifically a modification of the ABC minimization routine to account for a minimization objective with an adaptive objective function will be used to automate the optimization procedure.
The remainder of the paper is as follows. The following session provides; 2. Brief overview of related works, 3. The methodologies adopted are presented. 4. Artificial bee colony Algorithm (ABC) 5. Electrical faults detection using artificial bee colony Algorithm 6. Results and Discussion. Finally, a conclusion is drawn.
2.
RELATED WORKS
A powerful and efficient algorithm (Artificial Bee Colony (ABC)) was used for numerical function optimization, the results produced by ABC, Genetic Algorithm (GA), Particle Swarm Inspired Evolutionary Algorithm (PS EA) and Particle Swarm Algorithm (PSO) was compared using five high dimensional numerical benchmark functions that have multimodality [2]. The ABC algorithm is used for optimizing multivariable functions and Karaboga has described an artificial bee colony (ABC) technique which is different from the virtual bee technique. The results showed that ABC outperforms the other algorithms and has the capability to get out of a local minimum and can be efficiently used for multivariable function.
A modified Artificial Bee Colony (ABC) algorithm was used for constrained optimization problems, since ABC algorithm does not consider the initial population to be feasible, in addition a “smart bee” (SB) which uses its historical memories for the location and quality of food sources was added to the ABC method in [10]. The Smart bee can memorize the location of the best food source and its quality which was found at previous times [11]. This modified SB algorithm was tested on standard benchmark functions for constrained optimization problems and proved to be superior.
the exploitation ability of the ABC technique. The experimental results tested on a group of numerical benchmark functions show that gbest Artificial Bees Colony (GABC) algorithm can outperform ABC algorithm in most of the experiments. In [13] an ABC technique that uses chaotic maps for parameter modification so as to advance the convergence features and to avoid the ABC from getting fixed in local minimums was proposed.
In [14], a new iterative technique (ABC) algorithm is used to solve the shortest paths drawback for a given directed graph (G = (V, E)) from source node s to target node t. The ABC technique is good for solving generalized assignment problem which is known as NP-hard problem [15]. According to [16], in order to achieve a cost-efficient target coverage, a hybrid method using Voronoi partition based and velocity added artificial bee colony algorithm (V-VABC) was introduced for minimizing sensor movement in target coverage drawbacks, which is one among the two primary sub-problems of node deployment.
3.
METHODOLOGY
To attain this tasks, is by integrating Constructive research, process oriented methodology (POM) and object-oriented method recursive design (OOM/RD) for this work. Constructive research methodology is one of the very common computer science research procedures, which means problem solving through the construction or use of models, diagrams, etc. The word “construct” is frequently used in this context to indicate a new contribution being developed and the construct can be a new theory, model, software, or a framework. Constructive method solves practical problems while producing an academically valued theoretical contribution [17]. Using Constructive Research technique in this research, gives the understanding of a particular theory (Artificial Bee Colony method) which was used in solving the problem, it also gives the understanding of the domain that it has been applied to (Fire Domain).
Process oriented methodology (POM) was used for the software development stage. POM offers identification of critical (functional) objects (sub-modules) of the main system design, preparing a dynamic software process for sub-modules with appropriate time evolving processing and a software chaining procedure with temporal software structuring of the system. Object-oriented method recursive design was used for the system design. It helps for identification of critical objects of the main systems design by breaking them down into modules (smaller blocks) or subsystems and also for performing software processing on identified objects. Bottom-up design is the type of object oriented technique used in the systems design, because it is best for systems which are created from existing system.
4.
ARTIFICIAL BEE COLONY (ABC)
The ABC technique basically employs three core stages:Employed Bees Phase – An employed forager is employed at a particular food source which she is presently making use of or exploiting, information about this particular source are shared with other bees remaining in the hive.
Onlooker Bees Phase – They are bees that search for the best source of food depending on the information given by the Employed bees which are distance, direction and profitability of the food source. The onlooker bees watch the dances of employed bees and select food sources depending on dances. In [18] the dance is called a Waggle dance.
Scout Bees Phase – They randomly search for fresh food source [19]. Any employed bee whose food source has been neglected becomes a scout and starts to search for fresh food source.
In ABC technique, the position of the food source represents a possible answer to the optimization setback [20]. The nectar quantity of the food source corresponds with the quality (fitness) of the related solution.
The major steps of the ABC algorithm:
1. There is an arbitrarily spread out of initial food source positions for all employed bees.
2. After initialization, there will be recurrent cycles of the search procedure of the employed, onlooker, and scout bees, respectively.
3. Each employed bee goes to a food source in her memory and finds out a neighbour source, and then assesses its nectar quantity [21]. If that the nectar quantity of the fresh food source is superior than that of the previous source, the bee memorizes the new source location and forgets the old one which is called Greedy selection. Otherwise she keeps the location of the old one in her memory. ABC uses the following formula to produce a new solution from the previous one.
𝐹𝑖𝑘 = 𝑋𝑖𝑘 + 𝛼𝑖𝑘 (𝑋𝑖𝑘 − 𝑋𝑤𝑘)
(1) Where;𝑋𝑖
– Present solution,𝐹𝑖
– New solution in neighborhood of its present position,𝛼𝑖
- Random number within [-1, 1]. That controls the production of a neighbor food source position around𝑋𝑖𝑘
,𝑘
- Random dimension index selected from set {1, 2, ---n} and𝑋𝑤
- Random selected solution in the neighborhood4. Each onlooker watches the dance of employed bees in the hive and selects a source depending on the dances, and then goes to that source to assess its nectar quantity [22]. Pi is calculated by the following expression
𝑃𝑖 =
fit𝑖Ʃ fit𝑘 (2)
Where
fit𝑖
is the fitness value of the solution evaluated by its employed bee which is proportional to the nectar amount of the food source in the position𝑘
.5. Neglected food sources are determined and are substituted with the fresh food sources revealed by scouts. The scout bee
𝑋𝑖𝑘
discovers new food source using this equation below.𝑋𝑖𝑘 = 𝐿𝑏𝑘 + 𝑟𝑎𝑛𝑑(0, 1) (𝑈𝑏𝑘 − 𝐿𝑏𝑘)
(3)
𝑟𝑎𝑛𝑑(0, 1)
Random number [0, 1] and𝑈𝑏
,𝐿𝑏
- Upper and Lower boundaries of the dimension.6. The best food source found so far is recorded.
5.
ELECTRICAL FAULTS DETECTION
USING ARTIFICIAL BEE COLONY
ALGORITHM
design includes the use of real time data from the field. The system consists of input layer, optimization layer and decision layer.
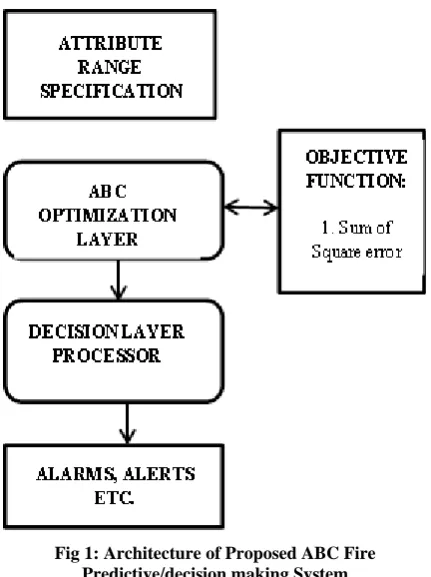
[image:3.595.59.275.214.503.2]Input layer: This is where to input the attribute range specifications like the Max cycle, Colony size, Fault resistance etc. Optimization layer: uses the AI technique (ABC) to evolve and then find the set of parameters that gives least cost, the least error as defined by an objective function which will be used by the decision layer for prediction. Decision layer: takes decisions based on the condition of input against a reference value that will be used to predict if there is danger of fire or no fire. The Architecture of the Predictive/decision making system is shown in figure 1.
Fig 1: Architecture of Proposed ABC Fire Predictive/decision making System
Table 1 shows Input/output Specifications for the ABC predictive/decision making system. The Bolted fault current, Protected bolted fault current, Arcing fault current and Protected arcing fault current can be caused by some other faults like Soil resistance, Metallic resistance condition
(conductor clashing), Weather resistance lighting (lighting strike),wind, tree falling across bus line etc. Bolted fault current is when one edge of the line is where the fault has zero impedance, giving the maximum prospective short circuit current or it is also the maximum available fault current at some point in an electrical system. Arcing fault current is when system voltage is high and an electric arc will form between power systems conductors. Protective Device Bolted fault is bolted fault current that flows through a given protective device. Protective Device Arcing fault is the current flowing through the protective device feeding the Arc fault. Protective device Name is the device that is used to protect the power system from faults. Electric Current is the rate at which electric charge is flowing and the SI unit for measuring Electric current is Ampere. Ammeter is an instrument used for measuring current. Bus voltage is the difference in charge between two points or the potential energy between two points and the SI unit for measuring voltage is Volts. Voltmeter is an instrument used for measuring voltage.
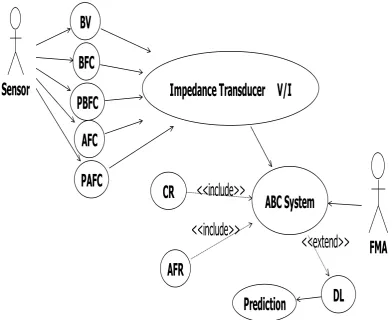
The ABC Technique evolve the Impedances of the different faults and voltage of the bus line, using the Actual fault resistance which is the decision parameter and the control resistance which is the reference to get the decision that will be used for prediction. Artificial Bee Colony method uses the Employed bee to search the impedances of the different faults and check which one has the likelihood to cause fault and the onlooker bees chooses the best impedances that could lead to fire outbreak using an objective function. It also uses the Scout bee to search for more faults.
Table 1 Sample Input/output Specifications for the ABC predictive/decision making system, source SPDC field Data
Bus Name Protective Bus Bus Bus P Prot Dev Prot Dev
Device Voltage Bolted Arcing Bolted Arcing
Name kV Fault Fault Fault Fault
(kA) (kA) (kA) (kA)
BUS-0001 MaxTripTime 11.00 65.71 61.77 65.71 61.77
BUS-0002 MaxTripTime 11.00 64.65 60.79 64.65 60.79
BUS-0003 MaxTripTime 11.00 64.65 60.79 64.65 60.79
BUS-0004 MaxTripTime 10.97 9.89 5.76 9.89 5.76
BUS-0005 MaxTripTime 10.97 9.89 5.76 9.89 5.76
The ABC fire prediction model is captured in Figure 2
Fig. 2: The Use-case model of Proposed ABC predictive/decision making system
Sensor
BV
BFC
PBFC
Impedance Transducer V/I
ABC System
AFR
<<include>>
CR
<<include>>
DL
<<extend>>
Prediction
AFC
PAFC
[image:4.595.102.495.368.688.2]Table 2: Description of Proposed system use case Use Case Description
BV Use Case Bus voltage
BFC Use Case Bolted fault current
PBFC Use Case Protected bolted fault current
AFC Use Case Arcing fault current
PAFC Use Case Protected Arcing fault current
CR Use Case control resistance
AFR Use Case Actual fault resistance
ABC Use Case Artificial Bee Colony
DL Use Case Decision Layer
FMA Use Case Fire Monitoring Agent
6.
RESULT AND DISCUSSION
Two Experiments were conducted; prediction estimates are read and recorded for each run. The first Experiment (Exp. 1) shows that when the fault resistance is between 0.3 ohms - 0.0 ohms, there will be likelihood of danger occurring among all faults at the same time, and none of the faults will be normal. While the second Experiment (Exp. 2) prove that when the fault resistance is between 0.4 ohms - 0.0 ohms, there will be likelihood of danger occurring among all faults at the same time. The two Experiments were performed with 26 test simulations each using different fault resistances values, colony size and max Cycles. Results of tests have been tabulated in Table 3- Table 6.
The results show good performance of the predictive ABC system for average convergence at 2.25 at 26 trials and its unique capability to make multiple predictions.
[image:5.595.319.536.490.695.2]Rule: Rule used for the prediction is when Z of context state of I is less than or equal to Z context state threshold (0.4 kilo ohms) there is a fault in the system.
Table 3 Results from Simulation of Experiment 1
Max Cycles = 5 Colony Size = 20
F.R B.F A.F P.B P.A B.V
4 33.9 27.9 30.9 29.5 10.9
3.9 29.9 26.2 29 28.6 10.9
3.7 28.3 26.7 29.3 24.4 10.9
3.5 35 30.4 31.1 27.9 11
3.3 35.1 25 33.3 34.7 11
3.1 29 27.8 27.1 33.5 10.9
2.9 38.3 33.1 33.3 21.3 10.9
2.7 35.2 33.7 35.7 22.7 10.9
2.5 32.1 25 33.1 28.7 11
2.3 33.6 30.4 35.8 27.5 10.9
2.1 27.9 41.2 33.5 35.1 10.9
1.9 31.1 25 36.7 24.2 11
1.7 34.3 28.1 37.6 27.2 10.9
1.5 27.9 33 34.1 29.2 10.9
1.3 32.3 32 35.7 29.4 10.9
1.1 35.5 35.5 30.4 24.5 10.9
0.9 28 27.9 30.7 24 10.9
0.7 32.6 24.2 34.3 31.3 10.9
0.5 34.6 29.8 27.1 34.7 10.9
0.3 35.9 28.2 42.3 30.7 11
0.28 34.1 41.4 36.5 41.1 10.9
0.25 37 40 38 41.3 10.9
0.2 43.3 41.7 40.2 30.8 10.9
0.1 44.5 39 46.9 38 10.9
0.05 44.1 40.7 39 41.1 10.9
0 41.6 38.8 47.9 42.8 10.9
F.R= Fault Resistance, B.F= Bolted Fault, A.F= Arcing Fault, P.B= Protected Bolted Fault, P.A= Protected Arcing Fault, B.V= Bus Voltage
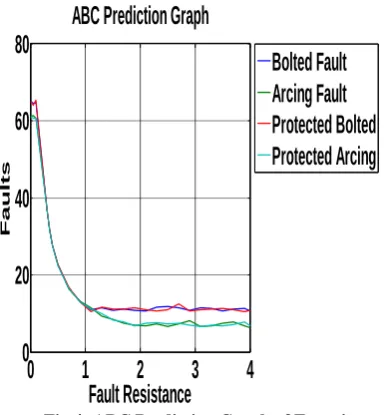
The Result shows different fault resistance tested with a constant colony size of 20 (area of search) and max Cycles of 5 (maximum number of iteration). It also shows the bus voltage and different faults current. Bolted fault produces a very high current during the experiment, which will cause fire outbreak. The Results prove that between 0.3 ohms – 0.0 ohms (fault resistance), all faults will show danger and should be attained to on time before it will lead to fire outbreak. 26 test simulations were performed using different fault resistances values. The ABC prediction graph of Exp. 1 is shown below in Figure 3.
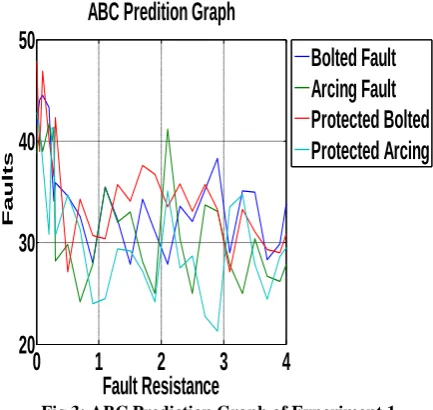
Fig 3: ABC Prediction Graph of Experiment 1
ABC Prediction Graph of Exp. 1 shows the different faults against different fault resistance. At 0.00 ohms – 2.00 ohms fault resistance, Protected Bolted fault has a current of 47.9 kA which has the likelihood to cause hazard, while Protected Arcing Fault has current of 24 kA which is normal. At 2.00 ohms -4.00 ohms fault resistance, Arcing fault has a current of
0
1
2
3
4
20
30
40
50
Fault Resistance
F
a
u
l
t
s
ABC Predition Graph
[image:5.595.65.270.536.764.2]41.2 kA which could lead to hazard, while Protected Arcing Fault has current of 21.3 kA which is normal. The prediction table results of Experiment 1 are shown in Table 4.
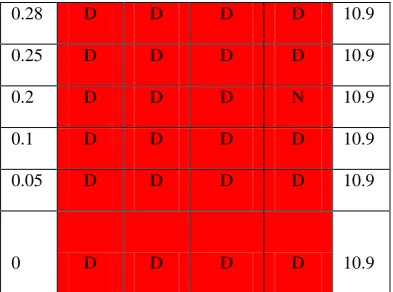
The prediction table of Exp. 1 shows different fault resistances that have been tested on the different monitoring Impedance (MOZ), using the bus voltage divided by its fault current gives the Impedance. Bolted fault MOZ, Protected Bolted fault MOZ, Arcing Fault MOZ, and Protected Arcing Fault MOZ monitors the context state of I, if it is less than or equal 0.4 kilo ohms, means there is fault in the system that will lead to fire outbreak and it will show Danger (D) else it should show Normal (N). At 0.3 ohms – 0.00 ohms fault resistance, all monitoring Impedance are likely to show danger and should be attained to immediately before it will lead to fire outbreak.
[image:6.595.310.507.71.217.2]F.R= Fault Resistance, N= Normal, D= Danger, B.F MOZ= Bolted fault monitoring Impedance (MOZ), A.F MOZ= Arcing Fault monitoring Impedance (MOZ), P.B.F MOZ= Protected Bolted fault monitoring Impedance (MOZ), P.A.F MOZ= Protected Arcing Fault monitoring Impedance (MOZ), B.V= Bus Voltage.
Table 4 Prediction Table results of Experiment 1
F.R B.F MOZ
A.F MOZ
P.B.F MOZ
P.A.F MOZ B.V
4 D D D D 10.9
3.9 D N D D 10.9
3.7 D N D N 10.9
3.5 D D D D 11
3.3 D N D D 11
3.1 D N N D 10.9
2.9 D D D N 10.9
2.7 D D D N 10.9
2.5 D N D D 11
2.3 D D D D 10.9
2.1 D D D D 10.9
1.9 D N D N 11
1.7 D D D N 10.9
1.5 D D D D 10.9
1.3 D D D D 10.9
1.1 D D D N 10.9
0.9 D D D N 10.9
0.7 D N D D 10.9
0.5 D D N D 10.9
0.3 D D D D 11
0.28 D D D D 10.9
0.25 D D D D 10.9
0.2 D D D N 10.9
0.1 D D D D 10.9
0.05 D D D D 10.9
0 D D D D 10.9
[image:6.595.310.506.288.767.2]The results from Simulation of Experiment 2 are given in Table 5, showing different current, voltage, Max Cycles of 50 and Colony Size of 100.
Table 5 Results from Simulation of Experiment 2
F.R B.F A.F P.B P.A B.V
4 10.7 6.34 10.8 6.83 10.9
3.9 11.3 6.71 10.5 7.83 11
3.7 11.1 7.72 11 7.04 10.9
3.5 10.7 7.47 11.3 6.71 11
3.3 11.3 6.84 11.1 6.91 11
3.1 11.5 6.55 11 6.6 11
2.9 10.8 8.04 10.7 6.95 10.9
2.7 11.5 7.32 12.4 7.5 11
2.5 11.8 6.6 10.9 7.2 11
2.3 11.6 7.3 10.6 7.64 11
2.1 10.7 6.78 10.9 7.41 10.9
1.9 10.8 6.93 11.5 6.74 10.9
1.7 11.1 7.4 11.2 7.8 11
1.5 10.8 8.47 11.1 8.3 11
1.3 11.5 9.23 11.6 10 10.9
1.1 10.9 11.5 10.4 11.1 10.9
0.9 13.2 13.2 12.9 12.9 10.9
0.7 16.5 16.4 16.8 16.5 11
0.5 22.5 22.7 22.6 22.4 11
0.4 27.7 27.7 27.9 27.7 11
[image:6.595.48.244.311.766.2]0.33 33.4 33.3 33.5 33.6 10.9
0.3 36.8 36.7 36.8 36.8 10.9
0.1 64.7 60.7 65.3 60.7 10.9
0.05 64.6 61.3 64.1 60.6 10.9
0 65 61.2 65 61 10.9
F.R= Fault Resistance, B.F= Bolted Fault, A.F= Arcing Fault, P.B= Protected Bolted Fault, P.A= Protected Arcing Fault, B.V= Bus Voltage.
[image:7.595.50.244.72.178.2]Exp. 2 result shows different fault resistance tested with a constant colony size of 100 (area of search) and max Cycles of 50 (maximum number of iteration). It also shows the bus voltage and different faults current. The Results prove that from 0.4 ohms – 0.00 ohms fault resistance all faults will show danger and should be attained to on time before it will lead to fire outbreak. 26 test simulations were performed using different fault resistances values. The ABC prediction graph of Exp. 2 is shown below in figure 4.
Fig 4: ABC Prediction Graph of Experiment 2
ABC Prediction Graph of Exp. 2 shows the different faults against different fault resistance. At 0.00 ohms – 1.00 ohms fault resistance, Bolted Fault and Protected Bolted fault has a current of 65.0 kA and 65.0 kA respectively, which has the likelihood to cause hazard, while Protected Bolted Fault and Protected Arcing Fault has current of 12.9 kA and 12.9 kA respectively which is normal. At 1.00 ohms -2.00 ohms fault resistance, Bolted Fault, Arcing Fault, Protected Bolted fault and Protected Arcing Fault has current of 11.5 kA, 9.2 kA, 11.1 kA and 8.30 kA respectively, which is normal. At 2.00 ohms -3.00 ohms fault resistance, Bolted Fault, Arcing Fault, Protected Bolted fault and Protected Arcing Fault has current of 11.5 kA, 6.6 kA, 10.9 kA and 7.20 kA respectively, which is normal. At 3.00 ohms -4.00 ohms fault resistance, Bolted Fault, Arcing Fault, Protected Bolted fault and Protected Arcing Fault has current of 11.1 kA, 6.34 kA, 10.5 kA and 6.83 kA respectively, which is normal. The prediction table results of Experiment 2 are tabulated in Table 6.
F.R= Fault Resistance, N= Normal, D= Danger, B.F MOZ= Bolted fault monitoring Impedance (MOZ), A.F MOZ= Arcing Fault monitoring Impedance (MOZ), P.B.F MOZ=
Protected Bolted fault monitoring Impedance (MOZ), P.A.F MOZ= Protected Arcing Fault monitoring Impedance (MOZ), B.V= Bus Voltage.
Table 6 Prediction Table results of Experiment 2
F.R B.F MOZ
A.F MOZ
P.B.F MOZ
P.A.F
MOZ B.V
4 N N N N 10.9
3.9 N N N N 11
3.7 N N N N 10.9
3.5 N N N N 11
3.3 N N N N 11
3.1 N N N N 11
2.9 N N N N 10.9
2.7 N N N N 11
2.5 N N N N 11
2.3 N N N N 11
2.1 N N N N 10.9
1.9 N N N N 10.9
1.7 N N N N 11
1.5 N N N N 11
1.3 N N N N 10.9
1.1 N N N N 10.9
0.9 N N N N 10.9
0.7 N N N N 11
0.5 N N N N 11
0.4 D D D D 11
0.35 D D D D 11
0.33 D D D D 10.9
0.3 D D D D 10.9
0.1 D D D D 10.9
0.05 D D D D 10.9
0 D D D D 10.9
The prediction table of Exp. 2 shows different fault resistances that have been tested on the different monitoring Impedance (MOZ), the bus voltage divided by its fault current gives the Impedance. Bolted fault MOZ, Protected Bolted fault MOZ, Arcing Fault MOZ, and Protected Arcing Fault MOZ monitors the context state of I, if it is less than or equal
0
1
2
3
4
0
20
40
60
80
Fault Resistance
F
a
u
l
t
s
ABC Prediction Graph
[image:7.595.68.261.319.527.2]to 0.4 kilo ohms, means there is fault in the system and it will show Danger (D) else it should show Normal (N). At 0.4 ohms – 0.00 ohms fault resistance, all monitoring Impedance are likely to show danger and should be attained to immediately before it will lead to fire outbreak. At 4.0 ohms – 0.5 ohms fault resistances, all monitoring Impedance are likely to show normal which will not lead to fire outbreak.
7.
CONCLUSION
In conclusion, a predictive system using artificial intelligent (AI) technique called the Artificial Bees Colony (ABC) to predict fire outbreaks caused by electrical faults in Industrial environment in Nigeria was developed. The ABC technique belongs to a class of computing called Swarm Intelligence, and it is aimed at solving minimization problems. Further work, will be the maximization functionality that can also be incorporated into the original ABC code of the author to account for maximization problems and also the system has not been integrated into real time hardware.
8.
REFERENCES
[1] Karaboga, D. 2005. An idea based on honey bee swarm for numerical optimization. Technical Report-TR06, Erciyes University, Engineering Faculty, Computer Engineering Department.
[2] Karaboga, D. and Basturk, B. 2007. A powerful and efficient algorithm for numerical function optimization: artificial bee colony (ABC) algorithm. J Glob Optim 39:459–471.
[3] Basu, B. and Mahanti, G. K. 2011. Fire Fly and Artificial Bees Colony Algorithm for Synthesis of Scanned and Broad Side Linear Array Antenna. Progress in Electromagnetics Research B, Vol. 32, 169-190.
[4] Bolaji, A. L., Khader A. T., Al-Betar, M. A., and Awadallah, M. A. 2013. Artificial Bee Colony Algorithm, Its Variants and Applications: A Survey. Journal of Theoretical and Applied Information Technology 20th January. Vol. 47, No.2.
[5] Rahsepar, M., and Mahmoodi, H. 2014. Predicting weekly discharge using Artificial Neural Network (Ann) Optimized by Artificial Bee Colony (ABC) Algorithm: A Case Study. Civil Engineering and Urban Planning International Journal (CiVEJ) Vol.1, No.1, June Edition.
[6] Yassine, A., Khalid, J., and Aziz, E. 2015. A modified ABC to Optimize the Parameters of Support Vector Machine for Predicting Bankruptcy. Proceedings of the World Congress on Engineering Vol. 1, London, U.K. ISBN: 978-988-19253-4-3
[7] Yigitbasi, E. D., and Baykan, N. A. 2013. Edge Detection using Artificial Bee Colony Algorithm (ABC). International Journal of Information and Electronics Engineering, Vol. 3, No. 6, November Edition.
[8] Kiran, M. S. and Gunduz, M. 2013. XOR-based Artificial Bee Colony Algorithm for binary optimization. Turkish Journal of Electrical Engineering and Computer Sciences, Vol. 21: 2307 -2328, Tubitak.
[9] Osman, H., Omar, S. S., and Mustafa, A. S. 2014. LSSVM ABC Algorithm for Stock Price prediction. International Journal of Computer Trends and Technology (IJCTT) – volume 7, number 2, Page 81, – Jan 2014, ISSN: 2231-2803.
[10] Nadezda, S., Milan, T., and Nebojsa, B. 2010. Enhanced Artificial Bee Colony Algorithm Performance. Latest Trends on Computers (Volume II), Faculty of Computer Science, Megatrend University Belgrade, Serbia
[11] Baykasoglu, A., Ozbakır, L., and Tapkan, P. 2007. Artificial Bee Colony Algorithm and Its Application to Generalized Assignment Problem, Swarm Intelligence: Focus on Ant and Particle Swarm Optimization. I-Tech Education and Publishing.
[12] Zhu, G., and Kwong, S. 2010. Gbest-guided Artificial Bee Colony Algorithm for numerical function algorithm. Applied Mathematics and Computation, Vol. 217, pp. 3166-3173 @ Elsevier Inc.
[13] Alatas, B. 2010. Chaotic bee colony algorithms for global numerical optimization. Expert Systems with Applications, Vol. 37, pp. 5682 5687.
[14] Mansouri, P., Asady, B., and Gupta, N. 2014. Solve Shortest Paths Problem by Using Artificial Bee Colony Algorithm. Proceedings of the Third International Conference on Soft Computing for Problem Solving, Advances in Intelligent Systems and Computing 258, DOI: 10.1007/978-81-322-1771-8_16, Springer India.
[15] Yuster, R. 2012. Approximate shortest paths in weighted graphs. Journal of Computer and System Sciences, Vol. 78, pp. 632–637, Elsevier.
[16] Jagtap, A. M. and Gomathi, N. 2017. Minimizing sensor movement in target coverage problem: A hybrid approach using Voronoi partition and swarm intelligence. Bulletin of the polish academy of sciences technical sciences, Vol. 65, No. 2.
[17] Liisa, L., Juha-Matti, J., Sami, K., and Laura, P. 2017. The Constructive Research Approach: Problem Solving for Complex Projects. Chapter 8 of Design, Methods and practices for Research of Project Management by Beverly pasian.
[18] Karaboga, D. and Ozturk, C. 2011. A novel clustering approach: Artificial Bee Colony (ABC) algorithm. Elsevier journal, Applied Soft Computing, Vol. 11, pp.652-657.
[19] Ajayan, A. R. and Balaji, S. 2013. A Modified ABC Algorithm and its application to wireless sensor network dynamic deployment. Journal of Electronics and Communication Engineering (IOSR-JECE), IOSR e-ISSN: 2278-2834, p- e-ISSN: 2278-8735. Volume 4, Issue 6.
[20] Ali, H., Sina, K. A. and Saeid K. A. 2010. Structural optimization using artificial bee colony algorithm. 2nd International Conference on Engineering Optimization September 6 - 9, Lisbon, Portugal.
[21] Karaboga, D. 2010. Artificial bee colony algorithm. Scholarpedia, 5(3):6915.
[22] Oshaba, A. S., Ali, .E. S., and Abd, E. S. M. 2015. Artificial Bee Colony Algorithm Based Maximum Power Point Tracking in Photovoltaic System. WSEAS transactions on power systems Volume 10: E-ISSN: 2224-350X.