Development and applications of electrically-driven
separation methods.
ELLIS, David R.
Available from Sheffield Hallam University Research Archive (SHURA) at:
http://shura.shu.ac.uk/19673/
This document is the author deposited version. You are advised to consult the publisher's version if you wish to cite from it.
Published version
ELLIS, David R. (2002). Development and applications of electrically-driven separation methods. Doctoral, Sheffield Hallam University (United Kingdom)..
Copyright and re-use policy
wui int.
c n y
c a m p iu s,
h o v w r ds t r e e t y : :^:SID s im
______1 0 1 7 1 5 8 9 8 3
ProQuest Number: 10695713
All rights reserved
INFORMATION TO ALL USERS
The qu ality of this repro d u ctio n is d e p e n d e n t upon the q u ality of the copy subm itted.
In the unlikely e v e n t that the a u th o r did not send a c o m p le te m anuscript and there are missing pages, these will be note d . Also, if m aterial had to be rem oved,
a n o te will in d ica te the deletion.
uest
ProQuest 10695713
Published by ProQuest LLC(2017). C op yrig ht of the Dissertation is held by the Author.
All rights reserved.
This work is protected against unauthorized copying under Title 17, United States C o d e M icroform Edition © ProQuest LLC.
ProQuest LLC.
789 East Eisenhower Parkway P.O. Box 1346
Development and Applications of
Electrically-Driven Separation Methods.
David R Ellis
A thesis submitted in partial fulfilment of the requirements of
Sheffield Hallam University
for the degree of Doctor of Philosophy.
ABSTRACT
The use of non-aqueous media in CE was investigated primarily in an attempt to identify alternative mobile phases for application in CEC. Several solvents were found to support a rapid EOF even without the presence of a supporting electrolyte. These initial experiments led to the development of a separation involving an active pharmaceutical ingredient (Cimetidine) and a series of related materials. The latter displayed alternative selectivity relative to a comparable aqueous-based separation and offered a number of advantages. However, the underlying fundamental principles that govern separations in non-aqueous media were not well understood and method development was somewhat of a “black art”. Further studies were therefore undertaken in order to gain an understanding of the mechanisms that influence separations in non- aqueous media. Under certain conditions the mode of separation appeared to be based on some form of interaction with the background electrolyte and the choice of a suitable EOF marker was not straightforward.
HPLC separations of EPA priority pollutant phthalate esters were developed to assess the ease by which they could be transferred to CEC and determine any advantages offered by the electrically-driven technique. The practicalities of fabricating columns for CEC separations are critically discussed along with the unsuitability o f some o f the stationary phases employed. Attempts to utilise non-aqueous media in CEC separations are also described.
ACKNOWLEDGEMENTS.
To reminisce, digress or inform? To reveal, portray or exonorate? For whom and for why?
Ian Dury
The work presented in this thesis was performed between March 1996 and March 1998. This thesis took
considerably longer to write and reach you in its final form due to me being jumped on and bludgeoned by the ‘black dog’ of depression.
Although the work presented within this thesis is my own I am extremely keen and proud to acknowledge
the contributions of the various individuals without whom...
Words cannot express my gratitude for the support (both emotional and financial) given to me by my
mother over the years.
I wish I had the words to describe my feelings for Suzanne who walked into my life and changed it
immeasurably for the better. The birth of our first child (Lennon Samuel 1 Sept 2001, 15:47) has made
me the happiest and proudest man alive.
It was once stated that 1000 monkeys each with their own typewriter would eventually produce the
complete works of William Shakespeare. I’m sure that my supervisors Dr Lee Tetler and Dr Malcolm
Clench would state that this would have been a faster strategy for getting this thesis completed! I cannot
thank them enough for their patience and support and understanding during the production of this thesis.
I thank Lee for giving me the opportunity of undertaking this work and all of his advice over the years.
Thanks to all of my fantastic friends and colleagues at Hallam University over the years. Extra special
mentions to Dave Douce, Jackie Mawhinney (now Dr Morton) and Ben Zeitlin for consistently being
friends above and beyond the call of duty.
The help and support of the wonderful technical staff at the University is gratefully acknowledged.
Hopefully after all this time they will have forgiven me for breaking that UV cell! The help and support of the Research Office and library staff is also gratefully acknowledged.
Many sincere thanks to Duncan and all the staff at the Health and Safety laboratory for their helpful discussions and use of their CE.
Undertaking a PhD is a tough life. It was made so much easier by the wonderful Brown family with
Dr Lee Tetler
Lee was tragically killed in a motoring accident on 13 Dec 2000 whilst returning to his home in Broadbottom. I am deeply saddened by the fact that he never saw the completed version o f this thesis.
Try as I might I cannot find words to describe Lee that can top those used by a speaker at his memorial service so I shall repeat them here:
AIMS OF THIS WORK
At the time o f undertaking this research electrically-driven separations based on CE were subject to a significant wave of interest fuelled mainly by the “rediscovery” of capillary electrochromatography (CEC).
Several groups had begun to publish impressive CEC separations but these typically involved model test compounds such as mixtures of PAHs using only a few simple mobile phases. Furthermore, workers in this field were obliged to fabricate their own columns “in-house” since they were not readily commercially available. Development of the technique in the research community therefore required fabrication techniques that could ideally be applied within any laboratory. Additionally, clear demonstrations were necessary that the technique could meet pharmaceutical industry and other regulatory criteria, be successfully applied to complex and/or “real” samples and that conversion of established HPLC methods was straightforward.
The addition of organic solvents to CE separation media is a well-established method of manipulating selectivity. The literature contained several intriguing reports of CE and CEC separations effected in totally non-aqueous media. Unfortunately, none o f the authors involved appeared to fully understand the fundamental processes involved in this conceptually difficult area and many reports did not discuss important separation parameters such as repeatability.
The application of non-aqueous media to CEC was also envisaged. It was anticipated that this would significantly enhance the scope available during method development and hence the potential application range o f the technique. However, it was first necessary to evaluate the advantages offered by the technique compared to HPLC. This was to be assessed by transferring a method developed for HPLC to CEC.
CONTENTS.
C H A P T E R 1: IN T R O D U C T IO N . Page.
1.1. BACKGROUND. 1
1.2. OVERVIEW. 1
1.2.1. Separation capillaries. 2
1.3. HISTORICAL DEVELOPMENT OF CE. 3
1.4. THEORETICAL ASPECTS. 4
1.4.1. The electrical double layer. 6
1.4.2. Electroosmoticflow. 7
1.4.2.1. Important characteristics o f EOF. 9
1.4.2.2. EOF velocity and mobilities. 10
1.5. DEVELOPMENT OF SEPARATIONS. 11
1.5.1. Control o f EOF. 11
1.5.1.1. Applied electrical field. 12
1.5.1.2. Buffer. 12
1.5.1.3. Modification o f the capillary wall. 12
1.5.2. Solute mobilities and migration times. 12
1.5.3. Efficiency and zone broadening. 14
1.5.3.1. Temperature effects: Joule heating. 16
1.5.3.2. Interaction between analytes and capillary wall. 17
1.5.3.3. Electromigration dispersion. 17
1.5.3.4. Length o f sample injection plug. 19
1.5.4. Resolution. 19
1.5.5. Separation selectivity. 20
1.5.5.1. Buffer. 21
1.5.5.2. Surfactants. 22
1.5.5.3. Chiral selectors. 22
1.5.5.4. Temperature. 23
1.5.5.5. Modification o f the capillary wall. 23
1.5.6. The role o f organic solvents in CE. 24
1.5.6.1. Classification o f solvents. 24
1.5.6.2. Levelling and differentiation. 25
1.5.6.3. Non-aqueous capillary electrophoresis ( NA CE). 26
1.5.6.4. EOF in pure solvents. 26
1.5.6.5. NA CE separations involving background electrolytes. 27
1.5.6.6. Separation o f neutral analytes using NA CE. 2 8
1.5.6.7. Enantiomeric separations. 28
1.5.6.8. Quantitative analysis. 2 8
1.6. INSTRUMENTAL AND OPERATIONAL ASPECTS. 30
1.6.1 Sample injection techniques. 30
1.6.1.1. Hydrodynamic injection. 31
1.6.1.2. Siphoning. 32
1.6.1.3. Electrokinetic injection. 32
1.6.1.4. Other injection modes. 3 3
1.6.2. Repeatability o f CE methods. 34
1.6.2.1. Unequal buffer reservoirs. 34
1.6.2.2. Contamination. 34
1.6.2.3. Electrolysis effects. 34
1.6.2.4. Evaporation. 35
1.6.2.5. Alteration o f the capillary wall. 35
1.6.3. Detection. 3 5
1.6.3.1. On-capillary absorbance detection. 3 5
1.6.3.2. Preconcentration. 37
1.6.3.3. Alternative detection strategies. 37
1.7. SELECTED APPLICATIONS. 38
1.7.1. Pharmaceuticals. 38
1.7.1.1. Representative applications. 39
1.7.2. Environmental. 39
1.8. OTHER MODES OF SEPARATION. 39
1.8.1. Capillary isoelectric focussing (CIEF). 39
1.8.2. Capillary isotachophoresis (ITP). 40
1.8.3. Capillary gel electrophoresis (CGE). 41
1.8.4. Micellar electrokinetic chromatography (MEKC or MECC). 42
1.8.4.1. Theoretical aspects. 42
1.8.4.2. Resolution. 44
1.8.4.3. Choice o f micelle forming surfactant. 45
1.8.4.3.1. Anionic surfactants. 44
1.8.4.3.2. Cationic surfactants. 45
1.8.4.3.3. Macromolecular surfactants. 46
1.8.4.3.4. Bile salts. 46
1.8.4.3.5. Chiral surfactants. 47
1.8.4.3.6. Mixed surfactants. 47
1.8.4.3.7. Other pseudo stationary phases. 48
1.8.4.4. Efficiency. 48
1.8.4.5. Addition o f aqueous phase modifiers. 49
1.8.4.5.1. Organic modifiers. 49
1.8.4.5.2. Solvent programming. 51
1.8.4.7. Effect o f temperature. 52
1.8.4.8. Detection. 53
1.8.4.9. Selected applications. 53
1.8.4.9.1. Pharmaceuticals and drug analysis. 5 3
1.8.4.9.2. Environmental. 53
1.8.5. Capillary Electrochromatography. 54
1.8.5.1. Chromatographic band broadening. 54
1.8.5.2. Theoretical aspects o f CEC. 57
1.8.5.3. Development o f separations. 58
1.8.5.4. Stationary phases employed in CEC. 59
1.8.5.4.1. ODS 59
1.8.5.4.2. Cationic exchange materials. 60
1.8.5.4.3. Physical mixtures o f phases. 60
1.8.5.4.4. Other phases. 61
1.8.5.5. Fabrication o f columns for CEC. 61
1.8.5.5.1. Open-tubular columns. 61
1.8.5.5.2. Packed capillaries. 62
1.8.5.5.3. Manufacture o f frits. 63
1.8.5.6. Practical aspects. 64
1.8.5.6.1. Detection. 64
1.8.5.6.2. Bubble formation. 64
1.8.5.6.3. Sample injection. 65
1.8.5.6.4. Gradient elution. 66
1.8.5.7. Selected applications. 61
1.8.5.7.1. Pharmaceuticals. 61
1.8.5.7.2. Environmental. 68
1.8.5.7.3. Chiral separations. 68
1.9. THE FUTURE OF ELECTROPHORETIC SEPARATIONS. 68
C H A P T E R 2: M A T E R IA L S A N D M E T H O D S.
2.1. INTRODUCTION 70
2.2. INSTRUMENTATION 70
2.2.1. Thermo Unicam Crystal model 310. 70
2.2.2. Beckman P/ACE 5150. 72
2.3. MATERIALS AND PROCEDURES. 74
2.4. DETERMINATION OF KEY SEPARATION PARAMETERS. 75
2.4.1. Electrophoretic mobilities. 15
2.4.2. Resolution between two adjacent bands. 15
C H A P T E R 3. IN IT IA L E V A L U A T IO N O F C E IN N O N -A Q U E O U S M E D IA .
3.1. INTRODUCTION. 78
3.2. EXPERIMENTAL PROCEDURES. 78
3.3. INITIAL EVALUATION OF EOF IN PURE ORGANIC SOLVENTS. 79
3.3.1. Acetonitrile. 79
3.3.2. Methanol. 80
3.3.3. N-Methylformamide. 80
3.4. ASSESSMENT OF INITIAL FINDINGS. 81
3.5. FURTHER STUDIES IN ACETONITRILE. 81
3.5.1. Influence o f water. 81
3.5.2. Addition o f supporting electrolytes. 83
3.5.2.1. Ammonium acetate. 83
3.5.2.2. Silver nitrate. 84
3.6. INVESTIGATION OF TEMPERATURE GRADIENTS. 85
3.7. CONCLUSION. 86
C H A P T E R 4: A P P L IC A T IO N O F N A C E T O TH E SE P A R A T IO N O F A N A C T IV E P H A R M A C E U T IC A L C O M P O U N D F R O M A SE R IE S O F R E L A T E D IM PU R IT Y A N D D E G R A D A T IO N M A T E R IA L S .
4.1. INTRODUCTION. 88
4.2. BACKGROUND. 88
4.3. REGULATORY ASPECTS. 89
4.4. MATERIALS AND METHODS. 89
4.5. EXPERIMENTAL PROCEDURES. 91
4.6. EXPERIMENTAL. 92
4.6.1. Initial method development. 92
4.6.2. Optimum solvent composition o f the non-aqueous separation 92
medium.
4.6.3. Optimisation o f electrolyte concentration. 95
4.6.4. Optimisation o f applied voltage. 97
4.6.5. Studies involving the remaining compounds. 100
4.6.6. Repeatability o f EOF in non-aqueous media. 102
4.6.7. Investigation o f alternative background electrolytes. 103
4.7. CRITICAL COMPARISON OF SEPARATION ACHIEVED IN 108
NON-AQUEOUS MEDIA WITH A COMPARABLE SEPARATION ACHIEVED IN TYPICAL AQUEOUS-BASED MEDIA.
4.8. METHOD TRANSFER. 109
C H A P T E R 5: A P P L IC A T IO N O F E L E C T R IC A L L Y -D R IV E N T E C H N IQ U E S T O T H E S E P A R A T IO N O F TH E P E S T IC IE D
P IR IM IC A R B F R O M R E L A T E D M E T A B O L IT E S. 115
5.1. INTRODUCTION. 115
5.2. BACKGROUND. 115
5.3. EXPERIMENTAL. 117
5.3.1. Separation by typical free solution CE. 117
5.3.2. Separation by NACE. 118
5.3.3. Separation by MEKC. 119
5.4. SEPARATION BY CZE. 119
5.5. SEPARATION BY NACE. 121
5.6. SEPARATION BY MEKC. 126
5.7. CONCLUSION. 131
C H A P T E R 6: F U R T H E R IN V E S T IG A T IO N O F N O N -A Q U E O U S
M E D IA . 133
6.1. INTRODUCTION. 133
6.2. MATERIALS AND METHODS. 133
6.2.1. Investigation o f day to day repeatability. 133
6.2.2. Systematic investigation o f the parameters controlling the
separation in non-aqueous media. 133
6.3. EXPERIMENTAL PROCEDURES. 133
6.4. INVESTIGATION OF DAY TO DAY REPEATABILITY. 134
6.5. INVESTIGATION OF THE PARAMETERS CONTROLLING THE
SEPARATION IN NON-AQUEOUS MEDIA 13 6
6.5.1. Effect o f varying the concentration o f ammonium acetate. 136
6.5.2. Investigation o f the role played by acetic acid in the non-aqueous
medium I: Exclusion o f acetic acid. 140
6.5.3. Investigation o f the role played by acetic acid in the non-aqueous
medium II: Decreasing pH* via the addition o f increased levels o f acid. 143
6.5.4. Investigation o f alternative background electrolyte: Ammonium
formate. 147
6.5.5. Investigation o f alternative background electrolyte: Sodium acetate. 150
6.5.6. Effect o f solvent composition. 154
6.5.7. Alternative non-aqueous solvent: NMF. 157 6.5.8. Alternative neutral marker: Mesityl oxide. 159
6.5.9. Confirmation o f observations on a second instrument. 160
CHAPTER 7: DETERMINATION OF ETHYLENEDIAMINE. 162
7.1. INTRODUCTION. 162
7.2. BACKGROUND. 162
7.3. MATERIALS AND METHODS. 163
7.4. EXPERIMENTAL PROCEDURES. 163
7.4.1. NACE separations employing NIT as a derivatising agent. 163
7.4.2. MEKC separations employing NIT as a derivatising agent. 164
7.4.3. MEKC separations employing NBD-Cl as a derivatising agent. 165
7.5. DEVELOPMENT OF A NACE ASSAY EMPLOYING NIT AS A
DERIVATISING AGENT. 166
7.6. DETERMINATION OF EDA BY MEKC EMPLOYING NIT AS A
DERIVATISING AGENT. 172
7.7. DETERMINATION OF EDA VIA DERIVATISATION WITH NBD- 172
Cl.
7.7.1. Determination o f optimum conditions for the derivatisation reaction. 172
7.7.2. MEKC separation. 173
7.8. CONCLUSION. 176
CHAPTER 8: APPLICATION OF ELECTRO-MIGRATION
TECHNIQUES EMPLOYING NON-AQUEOUS MEDIA TO THE
SEPARATION OF TRIALKYLTIN COMPOUNDS. 177
8.1. INTRODUCTION. 177
8.2. BACKGROUND. 177
8.3. MATERIALS AND METHODS. 178
8.4. EXPERIMENTAL PROCEDURES. 179
8.5. INVESTIGATIONS INVOLVING NMF. 180
8.6. INVESTIGATION OF DIRECT UV DETECTION. 183
8.7. NON-AQUEOUS CEC. 186
8.8. DISCUSSION. 186
CHAPTER 9: SEPARTION OF PTHALATE ESTERS: A CRITICAL
EVALUATION OF CEC. 187
9.1. INTRODUCTION. 187
9.2. BACKGROUND. 187
9.3. MATERIALS AND METHODS. 188
9.4. EXPERIMENTAL PROCEDURES. 189
9.4.1. Preparation o f columns employedfor CEC separations. 189
9.4.2. CEC separation. 191
9.5. DEVELOPMENT OF SEPARATION USING ISOCRATIC HPLC. 193
9.6. SEPARATION BY CEC. 199
9.6.1. Investigation o f DEHP and DNP retention issues using MEKC. 203
9.7. INVESTIGATION OF CEC SEPARATIONS EMPLOYING NON- 204
AQUEOUS MOBILE PHASES.
9.8. CONCLUSION. 206
C H A P T E R 10: D ISC U S SIO N .
CHAPTER 1.
INTRODUCTION.
1.1.
BACKGROUND.
This introductory chapter reviews the fundamental principles of high performance capillary zone electrophoresis (CE, CZE or HPCE). Alternative modes of separation that allow CE instrumentation to be employed for the separation of a wide range of analytes are also introduced and discussed. Finally, the work of various researchers in this field is reviewed. The latter focuses on major developments in the field of electrically-driven separations as well as considering representative applications.
1.2. OVERVIEW.
CE is a versatile technique that has emerged over the past 15-20 years into the forefront o f separation science. It is capable of effecting rapid separations exhibiting unprecedented efficiencies. Additionally, sample sizes and solvent requirements are far lower when compared to HPLC. Originally considered primarily for the separation of biological macromolecules, the development of new separation modes[l] has considerably broadened the potential application range of electrically-driven techniques to cover a broad spectrum o f analytes including uncharged materials.
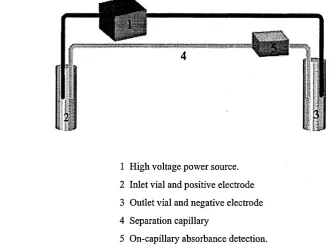
Figure 1.1 Schematic representation of a typical CE instrument.
1 High voltage power source.
2 Inlet vial and positive electrode
3 Outlet vial and negative electrode
4 Separation capillary
5 On-capillary absorbance detection.
Samples are loaded onto the capillary at the inlet side. The sample vial is then replaced with one containing a background electrolyte (also referred to as buffer or separation media). Separations are accomplished via the application of a high voltage (typically in the order o f 10-30 kV) across the capillary. Optical detection is usually performed through the capillary near to the outlet (or receiver vial). Most commercially available instruments include a high degree of safety features and an autosampler as standard. The latter allows high sample throughput and unsupervised operation. Important dimensions and parameters that will be discussed in subsequent sections can differ significantly between instrument brands.
1.2.1. Separation capillaries.
[image:19.614.108.443.82.333.2]1.3. HISTORICAL DEVELOPMENT OF CE.
Electrophoresis involves the migration of charged entities in solution under the influence of an external electrical field. It is beyond the scope of this thesis to provide a comprehensive historical account of the development of electrophoretic techniques. However, an excellent summary has been provided by Vesterberg[4].
The origins of modem electrophoretic separations may be traced back to the pioneering work o f Tiselius who was awarded a Nobel Prize in 1948. He is commonly credited with introducing electrophoresis as an analytical technique initially through his postgraduate research and subsequently through improved experiments[5]. He observed that the rate and direction in which components of a protein test mixture migrated in a simple electrophoresis experiment were based upon their charge and mobility. These free solution experiments were limited by both the instability of apparatus and more significantly by the convection processes caused by thermal heating induced by the applied electrical field.
The next major development of the technique was the introduction o f support media such as gels, paper and cellulose acetate. The purpose of such support media was to contain the separation buffer and impede free movement of the analyte and thus limit the random influence of diffusion. However, separations that employed such anti-convective stabilisers required long analysis times and the resulting efficiencies were generally low. Efficiency was limited by zone broadening mechanisms such as interactions between the analyte and the anti-convective medium and/or eddy migration along the channels formed by the stabiliser. In addition to these difficulties, detection could be problematic and automation of the techniques for high sample throughput was not straightforward.
Hjerten[7] performed zone electrophoresis in a 3 mm quartz glass capillary coated with methylcellulose. The detrimental effects caused by the relatively large internal diameter were reduced via rotation of the capillary along its longitudinal axis. Although the feasibility o f zone electrophoresis in capillaries was clearly demonstrated by this work, subsequent development was severely limited by the complexity of the instrumentation involved. Other workers subsequently performed electrophoresis in narrow bore (<200pm i.d) tubes but the predicted high efficiencies were not achieved[6, 8].
The true potential of free solution electrophoresis was finally demonstrated by the work of Jorgenson and Lukacs[9-ll] in the early 1980s. These workers achieved highly efficient separations in 75 pm i.d untreated glass capillaries of 80-100 cm total length and employed sensitive on-column fluorescence detection.
1.4. THEORETICAL ASPECTS.
In a vacuum, an ion in an electrical field will continue to accelerate until it leaves the field The accelerating force, F, is given by equation 1.1.
Fe = qE Equation 1.1
Where:
q is the charge of the ion.
E is the applied electrical field strength (applied voltage/capillary length).
However, in a fluid medium it will experience an opposing viscous resistance, p, that increases with increasing velocity. The frictional force experienced by a spherical ion is given by equation 1.2 which is termed the Stokes equation.
Where:
r| is the viscosity of the electrophoretic medium, r is the radius of the charged ion.
v is the velocity of ion.
The rate of electrophoretic motion rapidly reaches a steady state and the ion moves at a constant velocity that is proportional to the applied electrical field as shown in equation 1.3.
v = peE = peV/L Equation 1.3
The proportionality constant, pe, termed the electrophoretic mobility, is characteristic for a given ion in a given medium at a given temperature. The electrical and frictional effects become equal and opposite in magnitude during the steady state as shown in equation 1.4.
qE = 6 7ir|rv Equation 1.4
Solving equation 1.4 in terms of ion velocity and then substituting into equation 1.3 yields equation 1.5 that describes pein terms of various parameters.
pe = 7ir|r Equation 1.5
1.4.1. The electrical double layer.
The electrical double layer is a feature of any surface that is immersed in a solution. Consider a negatively charged surface such as silica in contact with an electrolyte solution. A thin area of excess opposite charge will exist in solution at the surface boundary to balance the fixed negative charges. Excess charge at the solid surface/liquid boundary involves a fairly immobile layer of ions that adhere tightly. The remainder o f the excess charge is distributed amongst a mobile layer of ions that freely exchange with those in the bulk solution. The excess charge density and associated electrical potential decreases rapidly as the distance from the surface increases. The potential at the boundary between the fixed and mobile layers is termed the zeta potential, denoted by This will be discussed in greater in section 1.4.2.
The fall-off of electrical potential with distance from the surface is roughly exponential. The distance at over which £ falls by a factor o f e is termed the double layer thickness denoted by 5. The latter is often denoted by 1/k (k is the Debye length) which may be determined using equation 1.6.
8 = s j ( s r S o RT)/(4 7iF2 E j Q Z 2) Equation 1.6
Where:
sr is the dielectric constant of the electrolyte solution,
so is the permittivity of a vacuum. R is the gas constant.
T is the absolute temperature. F is the Faraday constant.
1.4.2. Electroosmotic flow.
Electroosmotic flow (EOF) is an electrophoretic phenomenon that results in bulk flow of solution through the separation capillary. It results from effect of the applied high voltage on the electrical double layer and is key to all capillary-electroseparation methods.
The following discussion is restricted to untreated fused silica capillaries as they are most commonly employed in electrophoretic separations. The inner walls o f such capillaries may become charged either via ionisation (acid-base equilibria) or adsorption processes. The inner surface of a fused silica capillary consists o f silanol groups, (Si-OH). These groups become ionised above approximately pH 3 to yield negatively charged silanoate, (Si-O') groups. It is common practise to enhance this ionisation process by pre-treating a separation capillary with a base such as sodium hydroxide.
This ionisation process results in a layer of negative charge at the capillary wall. Cations from the background electrolyte solution are attracted to form a tightly held immobile layer at the capillary wall/solution interface (the Stem layer). This process cannot sufficiently neutralise the negative charges exhibited by the silanoate groups resulting in the formation of a second layer of cations. The second layer is not as tightly bound as the Stem layer and is referred to as the mobile (or diffuse) layer.
Figure 1.2 The electrical double layer
I n n e r w a l l o f
c a p ill a r y C —
S t e m l a y e r .
©©; ®
0Q ©
©
©
© ©
©
:©
■ a ©
©
D i f f u s e l a y e r
©
©
S u lk , s o lu t io n
©
©
©
©
©
©
©
©
©
XS u r f a c e o f s h e a r
Application of a high voltage across the length of the capillary causes the mobile layer of cations to be attracted towards the cathode. The cations are solvated and hence their movement causes the bulk solution in the capillary to be dragged with them yielding a net flow from anode to cathode. The flow velocity is generated uniformly along the capillary and is independent of its internal diameter.
The magnitude of the EOF is proportional to the zeta potential that is in turn proportional to the thickness of the diffuse double layer. The magnitude of the zeta potential is given by equation 1.7.
^ = 4 7i8e Equation 1.7
8
Where:
8 is the dielectric constant of the electrolyte medium.
The magnitude of the EOF is dependent on the internal diameter of the capillary, d, and the thickness of the electrical double layer, 5. Rice and Whitehead[12] stated that the EOF velocity would be independent of d only when d is significantly greater than 8. They concluded that as the internal diameter of the capillary was reduced and the value of d approached that of 8, double layer overlap would result in parabolic flow profile that would limit efficiency. Double layer overlap is therefore unlikely to pose a problem under typical CE operating conditions. A consideration of double layer overlap in terms of capillary electrochromatography (CEC) is given in section 1.8.5.2.
1.4.2.1. Im portant characteristics of EOF.
EOF has a plug-like flow profile that is totally in contrast to the typical pumped (or laminar) flow associated with HPLC as indicated in figure 1.3. Parabolic flow is caused by the difference in flow velocity between the centre and the walls of the separation column. The velocity at the centre of the tube is twice the average velocity whilst at the walls it is virtually zero.
Figure 1.3 Comparison of EOF and pressure-driven flow profiles.
EOF
PUMPED
1.4.2.2. EOF velocity and mobilities.
The electroosmotic velocity, vE0F, is given by equation 1.8.
vE0F= . g Equation 1.8 4nr\
The electroosmotic mobility, p E0F, is given by equation 1.9.
g r
p E0F = _______________ Equation 1.9 4nx\
It is clear from equation 1.9 that the EOF mobility is independent o f the applied voltage and is solely based upon dielectric constant and viscosity which are characteristic o f the separation medium that is employed.
Figure 1.4 Migration order in CE (flow from + to -).
Charged species may therefore be separated from each other on the basis o f differences in their electrophoretic mobilities. Neutral compounds may be separated from charged species but not from each other. Without EOF some very large and/or weakly charged ions would require a extremely long time to migrate to the point of detection and it would be impossible to separate anions and cations in a single analysis.
1.5. DEVELOPMENT OF SEPARATIONS. 1.5.1. Control of EOF.
Reproducible separations are dependent on efficient control of the EOF. The EOF may be manipulated via alteration of the surface charge on the capillary inner wall or the properties of the buffer. Conditions that alter the surface charge of the wall such as buffer pH often also affect analytes. Successful separations are the result of optimising both the EOF and analyte mobilities.
1.5.1.1. Applied electrical field.
Lowering the applied electrical voltage will decrease the EOF (equation 1.8.5.1). However, this strategy typically results in detrimental effects to resolution, efficiency and separation time. Conversely, raising the applied voltage will yield a faster EOF but the increased current may result in Joule heating (section 1.5.3.1).
1.5.1.2. Buffer.
The EOF may also be manipulated by simply altering the pH of the buffer. However, this may also affect the charge and mobility of analytes. The EOF varies with pH because of alteration in the charge density at the capillary wall.
The concentration and ionic strength of the buffer also influence the magnitude o f the EOF [13]. Typical buffer concentrations range from 10-lOOmM. High buffer concentrations can be useful for limiting coulombic interactions between analytes and the capillary by lowering the effective charge at the capillary wall.
1.5.1.3. Modification of the capillary wall.
The EOF may be increased, decreased or even reversed via modification o f the capillary wall. Modification may be accomplished using either dynamic coatings involving buffer additives or by employing capillaries whereby the inner wall has been permanently chemically modified.
1.5.2. Solute mobilities and migration times.
Figure 1.5 Definition of the two capillary dimensions employed in CE.
Lt
\
Id
~
D ete ction window. ,
The magnitude o f the two length terms is instrument specific and minimum capillary dimensions are often fixed. The latter restraint has been overcome using the so-called “short end injection ” technique[14, 15] whereby the sample is introduced at the end of the capillary that is closest to the detector.
The migration time of a solute is simply the time taken for it to migrate to the point of detection. The observed electrophoretic velocity v0BS may be determined using equation 1.10.
v0BS = L d/tm Equation 1.10
Analyte mobilities may be calculated using equation 1.11.
Papp = Ld.Lt Equation 1.11
tm.V
Where:
papp is the apparent (observed) mobility (cm2 V'1 s'1). V is the applied voltage (V).
tm is the migration time (s).
Ld is the effective capillary length i.e. length from inlet to detection window (cm).
In some instrumental configurations the difference between these two length terms is negligible and Ld Lt in equation 1.11 has been reduced to L2. Analyte mobilities calculated in this manner are termed apparent mobilities since they include the contribution from the EOF. The effective (or true) mobility of an analyte, pefT may be determined by subtracting pE0F from papp as demonstrated in equation 1.12
H'eff=Happ-P'EOF Equation 1.12
The magnitude of pE0F may be determined experimentally via the injection of a neutral marker compound such as acetone, thiourea or mesityl oxide that travels through the capillary at an identical rate to that of the EOF. Such compounds are typically included within sample solutions during their preparation.
1.5.3. EFFICIENCY AND ZONE BROADENING.
The time taken for an analyte to migrate the entire length o f the capillary is given by equation 1.13.
t = L Equation 1.13
v
Substituting the expression for velocity in equation 1.3 yields equation 1.14.
t _ L2 Equation 1.14 HeV
It is evident from equation 1.14 that the analysis time is proportional to the square of the capillary length and inversely proportional to the applied voltage. Assuming that molecular diffusion is the sole contributor to sample zone broadening, the spatial variance, a 2, o f a sample zone after time, t, is given by equation 1.15 that is termed the Einstein equation.
a 2 = 2Dt Equation 1.15
Substituting the expression for time in equation 1.14 into equation 1.15 yields equation 1.16.
a 2 = 2DL2/peV Equation 1.16
The expression for the number o f theoretical plates, N, in electrophoretic separations derived by Giddings[16] is given in equation 1.17
N = L2/g 2 Equation 1.17
Substitution of equation 1.16 into equation 1.17 yields an important expression in electrophoretic separations that is given in equation 1.18[11].
N = |_ieV Equation 1.18.
2D
These equations must be modified in the presence of EOF. Efficiency in terms o f number of theoretical plates in the presence of EOF is given by equation 1.19.
(uEQF + uelV Equation 1.19.
2D
Van Deemter and co-workers[17] determined that there was an optimum mobile phase velocity in chromatography at which band broadening is a minimum and column efficiency is greatest. They also defined three processes (A, B and C) that contribute towards band broadening. Under ideal conditions the sole contribution to analyte zone broadening in CE is the van Deemter B term, longitudinal diffusion (i.e. along the length o f the capillary). However, other dispersive effects are often present as described in the following sections[18]. Note, the van Deemter equation is discussed in greater detail in section 1.8.5.1 as an introduction to capillary electrochromatography.
I.5.3.I. Temperature effects: Joule heating.
Efficiency is directly proportional to the applied voltage (equation 1.19) whereas separation time is proportional to the square of the capillary length (equation 1.14). It would therefore be reasonable to assume optimum separation in terms of speed and efficiency would be achieved using a very high voltage and a short capillary. Jorgenson and Lukacs[19] reported that a plot of efficiency versus applied voltage was a straight line except for a negative deviation from linearity at high voltages. They predicted that the inability to dissipate generated heat was a limiting factor to the use of high separation voltages.
Joule heat is generated by the passage of current through a background electrolyte within a capillary. Heat is generated uniformly throughout the capillary but is only dissipated at the inner walls and ends. This results in a parabolic temperature gradient across the capillary such that the centre becomes warmer than at the inner walls[20]. Under extreme circumstances the temperature difference between the walls and centre is so great that the electrophoretic process can breakdown completely. However, the effects o f Joule heat are more commonly observed as reduced efficiency.
The radial position of analyte molecules is constantly changing due to diffusion across the capillary. Reducing the internal diameter of the capillary effectively enhances this radial diffusion of analyte molecules back and forth across the temperature gradient thus averaging their velocities and minimising the effects of Joule heat. The magnitude of the radial temperature gradient is proportional to the square of the capillary radius and hence reduction of the internal diameter significantly reduces any temperature differences across the capillary.
The majority of commercially available instruments incorporate some form of cooling system to maintain a constant separation temperature[21]. Zare et al. [22] patented a design for a capillary with a rectangular cross-section that was claimed to efficiently dissipate heat.
1.5.3.2. Interaction between analytes and the capillary wall.
Adsorption of solutes to the capillary wall can lead to a variety of problems such as alteration of the EOF, irreproducible migration times, degradation o f efficiency, capillary fouling and loss of sample.
The large surface area to volume ratio of the separation capillary enhances the likelihood o f such effects occurring. The main causes of adsorption are ionic interactions between the negatively charged capillary wall and cationic analytes and hydrophobic interactions. It is perhaps not surprising that peptides are the most commonly cited examples o f these adsorptive effects since they possess numerous charges and hydrophobic groups. A number of strategies may be employed to reduce analyte-wall interactions such as increased buffer concentrations, operation at extremes of pH and use of coated capillaries.
1.5.3.3. Electromigration dispersion.
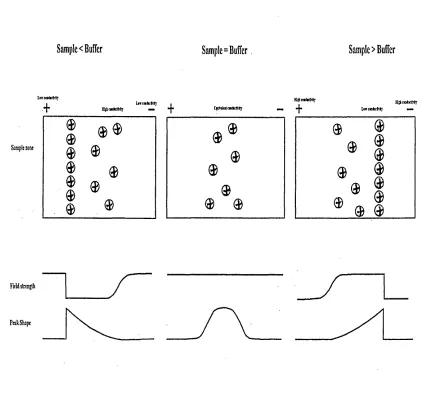
The leading edge of the sample zone will be diffuse and the trailing edge sharp (termed tailing) when the sample zone has a higher mobility than the separation medium. Conversely, the leading edge will be sharp and the trailing edge diffuse (termed fronting) when the sample conductivity is lower than the separation media. No distortion is observed when the sample and media conductivities are equal. Each situation is illustrated in figure
1.6.
Figure 1.6 Electrodispersion resulting from mismatched sample and buffer conductivities.
Sample< Buffer
Sample=Buffer
Sample > Buffer
L w teidir& ty
+ ffig hw dirlM lj L iic o id u fiT ij — i 4-*
Sample zone
C fd n k itM f c rtty
HUhnidictMlj
H gktiD toctity Liw cmfctffrkj
Field strength
[image:35.614.78.500.229.630.2]1.5.3.4. Length of sample injection plug.
An excessively long sample plug will have a detrimental effect on resolution and efficiency. Injection zone lengths typically do not exceed 1-2% of the total capillary length. However, even a 1% plug length may be excessive in many instances[24].
Issues with detection limits (section 1.6.3) under typical conditions often necessitate longer plug lengths. Methods o f improving detection limits without compromising efficiency are discussed in section 1.6.3.2.
1.5.4. RESOLUTION.
Resolution in electrophoresis is given in equation 1.20[18].
Rs = . Av Equation 1.20
4 vavg
The relative velocity difference between the two analyte zones (Av/vavg) is defined in equations 1.21 and 1.22 (with and without the presence of EOF respectively).
Av = qi-U2 Equation 1.21
^ a v g P 'avg- ^' M'EOF
Av = \\,\-\i2 Equation 1.22
^ a v g M'avg
Where:
Pj and p2 are the mobilities of the two analytes. pavg is the average mobility of the pair.
Substitution o f equations 1.19 and 1.21 into equation 1.20 followed by rearrangement yields equation 1.23 which is an important expression for resolution in electrophoretic separations[ll].
A linear gain in resolution with increased applied voltage is not observed due to the square root term. The separation voltage must therefore be quadrupled to effect a two-fold increase in resolution. However, this strategy is ultimately restricted by the generation of Joule heat.
It is evident from equation 1.23 that a large EOF in the same direction as the analytes will reduce the resolution between the pair. Jorgenson and Lukacs[ll] compared the separation o f a series o f derivatised amino acids in both a normal glass capillary and a glass capillary in which the inner surface was modified to suppress EOF. Enhanced resolution was achieved in the coated capillary but this was at the expense of increased separation time.
Optimum resolution will be achieved when the when the magnitude o f the EOF is equal but opposite to the migration of the analytes (i.e. pE0F = - pavg). Under such conditions it should be possible to resolve analytes with extremely similar mobilities.
1.5.5. SEPARATION SELECTIVITY.
Resolution in CE is improved via the alteration of important separation parameters[25]. The most common strategies involve variation of buffer pH and/or the use o f additives such as surfactants, chiral selectors and organic solvents.
1.5.5.1 Buffer.
Variations in buffer preparation have less pronounced effects in HPLC than in CE. Some workers have proposed standardising the documentation o f CE buffer preparation procedures and other important operating parameters[26]. Altria[27] has recently detailed several generic buffers that are applicable for a variety of applications.
Crucial separation parameters such as migration velocity and efficiency are sensitive to changes in buffer characteristics. In particular, pH is of crucial importance. Buffering capacity (a quantitative measure of buffering efficiency/ability) must be sufficient to ensure that local pH and conductivity do not change significantly as a result o f sample injection. Valko and co-workers[28] demonstrated that adequate buffering is crucial to obtaining reproducible migration times.
An effective buffer exhibits a range of approximately 2 pH units centred on its pKa value. A number o f commonly used buffers and their useful pH ranges are listed in table 1.1. Polybasic buffers such as phosphate and citrate have more than one pKa value and hence can be employed in more than one pH range. Additionally, the buffer should exhibit a low absorbance at the relevant detection wavelength and possess a low mobility to minimise current generation. The commonly termed biological buffers such as TRIS are especially useful in terms o f the latter property. Hjerten and Liao[29] investigated and subsequently patented a series of low conductivity buffers.
Table 1.1. Commonly employed materials for the preparation of CE separation media.
Name pKa[30]
Phosphate 2.12 (pKal), 7.21 (pKa2), 12.32 (pKa3).
Citrate 3.06 (pKal), 4.74 (pKa2), 5.40 (pKa3).
Formate 3.75
Borate 9.24
Alteration of buffer pH is a powerful means of manipulating selectivity since it affects both the EOF and analyte mobilities. Small changes in pH can result in the separation of closely migrating analytes. Altria and Simpson[31] observed that mobility was inversely proportional to buffer concentration and that a logarithmic plot o f concentration Vs mobility was linear.
1.5.5.2 Surfactants.
The following discussion is limited to surfactants that are added to the buffer at a concentration below the relevant critical micelle concentration (CMC). Surfactant concentrations above the CMC result in an alternative mode of separation termed micellar electrokinetic chromatography that is discussed in section 1.8.4.
Ionic surfactant molecules may act as solubilising agents for hydrophobic solutes, ion- pairing reagents or as capillary-wall modifiers. The latter may be used to modify the EOF and/or limit adsorption of analytes onto the capillary wall. Cationic surfactants such as CTAB adhere to the wall via ionic interactions. Hydrophobic interactions o f free CTAB molecules with those adhered results in the generation of a positive charge in the vicinity of the wall and a reversal of the EOF flow.
1.5.5.3 Chiral selectors.
It is possible to introduce a variety of compounds into the hydrophobic cavity via a mechanism termed guest-host (or inclusion) complexation. After dissolution the cavity of a cyclodextrin will “host” a water molecule. The latter is in an energetically unfavourable situation since the cavity is hydrophobic. Hence, molecules such as aromatics that can form non polar-non polar interactions with the cavity readily replace it. Further stabilisation is possible if the “guest” molecule also possesses a hydrophilic region that can interact with the opening of the CD cavity. CDs are dextrorotatory as a result of the chiral D-(+)- glycopyranose units present in their structure. Hence they can be employed as a chiral environment for the resolution of enantiomers[32-34].
Another popular means of effecting enantiomeric separations in CE is via the use o f crown ethers. Crown ethers are macrocyclic polyethers that form stable inclusion complexes with alkali, alkaline earth and primary ammonium cations. Khun[35] gave an extensive review o f the practical applications of crown ethers.
1.5.5.4. Temperature.
Most CE systems are thermostatically controlled to maintain capillary temperature and to dissipate Joule heat[21]. However, temperature may be employed to manipulate separations. An elevated or reduced temperature will alter buffer viscosity, EOF and analysis time. It may also be used to alter reaction kinetics and chemical equilibria.
1.5.5.5. Modification of the capillary wall.
The most common form of permanent modification involves silylation followed by deactivation with a functional group. However, the siloxane (Si-O-Si) bond is stable only between pH 4-7 and hydrolysis may limit long term stability of some capillaries. Neutral deactivation with polyacrylamide, polyethylene glycol or similar eliminates EOF whereas deactivation with a cationic material reverses the EOF. Deactivation with amphoteric materials such as an amino acid yields a reversible EOF that is dependent on the buffer pH and the pi of the coating.
1.5.6. The Role of Organic solvents in CE.
Solvents such as acetonitrile and methanol have been employed in CE as either pure materials or constituents of an aqueous-organic mixture. The use o f pure solvents is referred to as non-aqueous capillary electrophoresis (NACE)[36, 37]. Separation selectivity may be radically altered since the acid-base properties o f analytes are different in organic solvents. Additionally, migration is dependent upon the physiochemical properties o f the of the separation media (£, r\) and the radius of the solvated ion which will be different in a non-aqueous environment.
Separation selectivity may be manipulated via the addition of organic solvents to CE buffers due to their effects on the physiochemical parameters that are decisive for separation (£, EOF, nanalyte)[38, 39].
I.5.6.I. Classification of solvents.
Table 1.2 Classification o f solvents.
High dielectric constant Low dielectric constant
H-Bonded Non H-bonded H-Bonded Non H-bonded
Water Acetonitrile Ethanol Acetone
Methanol Dimethylsulphoxide iso-propanol Benzene
Formic acid Nitrobenzene Acetic acid Chloroform
N-methylformamide
Further division o f each subclass may be made according to acidic or basic properties. For
example formic acid is an acidic (or protogenic) solvent whereas dimethylsulphoxide is a
basic (or protophilic) solvent. A third category may be assigned involving amphiprotic
solvents that display both acidic and basic properties. These solvents are characterised by
appreciable self-ionisation (or autoprotolysis) as illustrated in equation 1.24.
SH + SH - SH2+ + S
-1.5.6.2. Levelling and differentiation.
In solvents undergoing autoprotolysis the strongest acid is the solvent cation SH2+ and the
strongest base is the solvent anion S'. Water completely converts strong acids to their
conjugate anions and H30 + (the solvent cation). Hence, strong acids such as H N 0 3, HC1
and HC104 appear to be o f identical strength. Likewise, bases such as NH 2" and CH30 ' are
completely converted to their conjugate acids and OH' (the solvent anion). Strongly acidic
The intrinsic differences in the strength of acids and bases are not levelled in solvents such as acetonitrile and are said to be differentiated. The differentiation limits o f a solvent are defined by the autoprotolysis constant. In water studies are restricted to acids with pKa values between 0 and 14 units whereas in acetonitrile it is possible to study acids with pKa values between 0 and 32.
1.5.6.3. Non-Aqueous Capillary Electrophoresis (NACE).
This area has received considerable interest during the past 5 years. Although impressive separations have been reported the technique is still not well understood. NACE was recently reviewed by Riekkola et al. [37].
1.5.6.4. EOF in pure solvents.
EOF has been observed in a number of solvents even without the addition o f electrolyte. Whitaker and Sepaniak[41] observed cathodic flow rates in pure acetonitrile that were around three times faster than in typical aqueous media. Meanwhile, Wright and co- w o rk e rs ^ ] reported rapid EOF in various organic solvents (acetonitrile, methanol, N,N- dimethylformamide and DMF).
Many organic solvents have lower dielectric constants than water resulting in less free ions to facilitate charge transfer. Hence lower currents are generated and higher electrical field strengths may be employed to effect separations. Reduced Joule heat effects can result in enhanced efficiencies compared to aqueous systems under optimised conditions[24]. Jansson and Roeraade[43] exploited the high field strengths possible with NACE and separated propranolol from felodipine in less than 35 seconds.
The ratio of dielectric constant to viscosity (s/r|) has been shown[41, 42] to be a convenient means o f predicting the magnitude of the EOF generated in a given solvent. Solvents with an s/r| similar to that of water should therefore provide rapid flow as long as a significant £, exists.
N-methyl formamide (NMF) has both a high dielectric constant and an autoprotolysis constant that is comparable to water. It is understood that all species are solvated, principally by hydrogen bonding with the solvent. Jansson and Roeraade[43] demonstrated a reproducible EOF was possible without the presence of background electrolyte. However, NMF contains impurities such as hydrolysis products that are likely to influence the EOF and
1.5.6.5. NACE separations involving background electrolytes.
The term pH* has been adopted as a means of describing acidity and basicity in NACE since the concept o f pH is arguably only valid in dilute aqueous solutions. Many workers have chosen to determine such values using commercially available pH probes. A recent paper by Espinosa and co-workers[45] provides an excellent insight into the complexity o f pH measurements in non-aqueous media.
Altria and co-workers[54] used high pH* non-aqueous media for the separation o f acidic species. Sodium acetate and sodium hydroxide were used to increase pH*. Fillet and co- workers[55] effected the separation of non-steroidal anti-inflammatory drugs using a methanolic buffer comprising 50mM ammonium acetate/13.75mM ammonium acetate (pH* 8.5).
Conversely, Senior et a l [49] employed low pH* (<7) NACE buffers to effect the separation of acidic compounds. Samples were injected at the outlet side o f the capillary and the resulting negatively charged species migrated against the EOF.
Water in concentrations of up to 0.5% v/v has been shown to have only a minor effect on the separation selectivity, efficiency and EOF achieved in NACE[56]. In a separate study Hansen and co-workers[53] reported that the addition o f up to 1% v/v water did not have any significant effect on the selectivity obtained for a series of test compounds.
Temperature control is crucial for obtaining reproducible separations in NACE. Leung and co-workers[46] obtained a significant improvement in the repeatability o f migration times when they transferred their NACE separation to an instrument with superior thermostatic control.
1.5.6.6. Separation of neutral analytes using NACE.
Miller et al. [59] exploited the principle of heteroconjugation between Br0nsted acids and small inorganic anions in acetonitrile to effect the separation of phenols, carboxylic acids and alcohols. The resulting heteroconjugated anions migrated towards the anode. Meanwhile, Wright and Dorsey[60] applied the principles of argentation chromatography to NACE. Silver (I) complexation was demonstrated to be an effective means of manipulating selectivity for heterocyclic containing materials.
1.5.6.7. Enantiomeric separations.
Many organic solvents have dielectric constants lower than water which facilitate ion-pair formation or ion-dipole interactions between analytes and chiral selectors that may not be possible in aqueous buffers. Quinine has been used to resolve dinitrobenzoyl amino acids in methanol[61] whilst pharmaceutical enantiomers have been separated using
camphorsulphonate in acetonitrile[62].
Some cyclodextrins (CDs) exhibit limited solubility in water making NACE an attractive alternative to aqueous-based separations. Formamide and NMF are particularly good solvents for CDs but association constants have been shown to be lower than in water. However, successful separations have been reported[63]. Enantiomeric NACE separations employing a crown ether as the chiral selector have also been reported[64].
1.5.6.8. Quantitative analysis.
Concerns have been expressed regarding whether NACE methods employing volatile separation media are sufficiently stable and repeatable to be employed in quantitative assays.
Cherkaoui and co-workers[50] developed a NACE assay for several atropine and scopolamine related compounds. Method robustness was demonstrated using a full factoral design at two levels. The method was successfully validated and applied to the determination ofN-butylscopolamine in pharmaceutical formulations.
1.5.6.9. Preparative applications employing wide-bore capillaries.
The low currents associated with NACE have led to the development o f separations on a preparative scale[65]. Relatively large solvent volumes are transported from the inlet to outlet vials when wide-bore capillaries are employed in NACE. This is a consequence of reduced viscosity compared to aqueous systems. The resulting difference in liquid levels can lead to a siphoning effect that induces a deviation from the plug-like flow profile. Palonen and co-workers[66] compensated for this effect by lifting the inlet vial. A separation of bumetadine and ethacrynic acid was presented using a 530 pm id capillary.
1.6. INSTRUMENTAL AND OPERATIONAL ASPECTS.
1.6.1. Sample injection techniques.
The high efficiency separations associated with CE may only be realised when the sample injection system does not significantly contribute towards band broadening. Separations typically involve on-capillary loadings of only a few nanolitres. Quantitative and reproducible loading of such small volumes of sample may be achieved using a number of injection techniques.
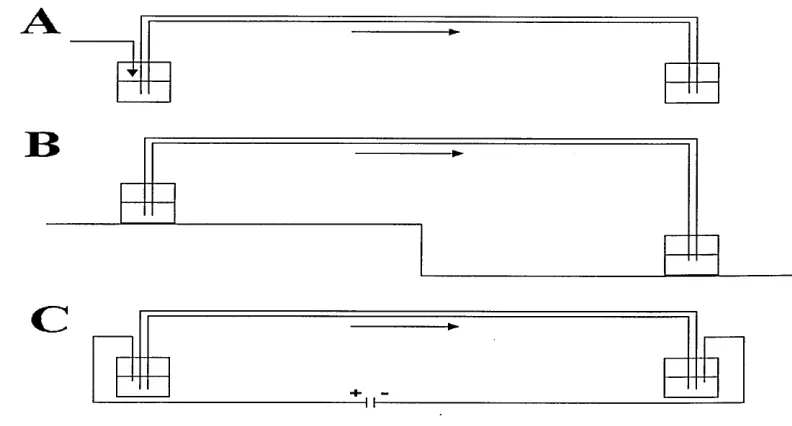
Figure 1.7 Comparison of hydrodynamic (A), Siphoning (B) and Electrokinetic (C) sample introdution.
1 3
1.6.1.1. Hydrodynamic injection.
Hydrodynamic or hydrostatic injection sample injection is the most widely used injection procedure since it does not suffer from the sample composition-based discrimination inherent with electrokinetic injection. It has been shown to have very little effect on separation efficiency and to have an RSD of 2.9% when automated [67].
Sample introduction is accomplished by the application of pressure (25-100 mbar) at the inlet end o f the capillary. The volume of sample, Vs, loaded may be determined using equation 1.25 that is termed the Hagen-Poiseuille equation.
Vs = AP_dVt 128 r\ Lt
[image:48.612.104.500.112.325.2]Where:
AP is the pressure differential across the capillary, d is the internal diameter of the capillary,
t is the duration of the injection.
r| is the viscosity of the background electrolyte.
I.6.I.2. Siphoning.
Hydrodynamic-like injection may be effected in systems that do not have the capability to perform pressure injection via a siphoning process. This is typically performed by elevating the inlet vial such that it is 5-10 cm above the outlet vial for a period of time. The pressure differential in siphoning injection is given by equation 1.26. This value is then employed in equation 1.25 to determine the sample loading.
Where:
p is the density of the background electrolyte, g is a gravitational constant.
Ah is the difference in height between the two buffer vials.
1.6.1.3. Electrokinetic injection.
Electrokinetic injection essentially involves utilising the combination o f electrophoresis and EOF to load sample into the capillary. Injections are accomplished by replacing the inlet buffer vial with the relevant sample vial and applying a high voltage across the capillary. This is typically lower than the voltage that is employed to effect the separation.
The amount o f sample, As, loaded may be determined using equation 1.27
AP = p g Ah Equation 1.26
As — (panalyte + |UEOFl V 71 I*2 Canalyte t L.
Where:
(i analyte is the electrophoretic mobility of the analyte. jj,E0F is the EOF mobility.
V is the applied voltage (kV) r is the radius of the capillary.
Qnaiyte *s concentrati°n of the sample, t is the injection time (s).
Ltis the total length of the capillary (cm).
It is clear from equation 1.27 that sample loading is dependant on analyte mobility and that biased loading will occur in samples containing species with widely differing mobilities[68]. In this situation, sample constituents with high mobilities will be injected onto the capillary in larger quantities than less mobile components.
The resistance of the injected sample solution also influences electrokinetic loading. This is inversely proportional to the conductivity of the background electrolyte. Huang and co- w o rk e rs ^ ] demonstrated that more sample is injected in solutions with a high resistance. The authors suggested that this was due to vE0F and vanalyte increasing with decreasing electrolyte concentration and hence vtotal (where vtotal = vE0F + vanalyte) varies almost linearly with the resistance o f the sample solution.
1.6.1.4. Other injection modes.
1.6.2. Repeatability of CE methods.
CE methods have a reputation for poor repeatability. Understanding and control o f various key factors are crucial to establishing good routine methods[71]. For example, the buffer solution employed in a CE separation is subject to alteration via a number of processes that are discussed in the following sections[72].
1.6.2.1. Unequal buffer reservoirs.
A siphoning effect termed levelling is induced when the levels o f background electrolyte in the two reservoirs are unequal[72]. This results in a laminar flow being superimposed onto the EOF leading to loss of efficiency and poor migration time repeatability[73].
1.6.2.2. Contamination.
Sample carryover during injection and/or the separation can lead to contamination o f the buffer reservoirs. Additionally, impurities on vial caps may cause the applied voltage to skim away from the capillary and be grounded.
1.6.2.3. Electrolysis effects.
Extensive application of a voltage across an electrolyte during a series o f replicate assays results in an effect termed buffer depletion [74, 75]. Essentially, a pH gradient is formed along the length o f the capillary that can effect migration time repeatability and peak efficiency. Approaches to address this issue were discussed by Kelly et al. [76]. The extent of such effects is application dependent but it is generally considered good practice to renew the buffer after a number of replicate separations especially if analytes have pKa values close to the pH of the buffer[77]. Improved reproducibility has been reported using an automated buffer replenishment system[78]
Comparison o f separations effected via application of constant voltage and constant current found that the latter resulted in better migration time repeatability in both successive injections and day to day analysis[81]. Watzig and Dette[82] proposed that separation voltages and associated currents should be recorded when performing routine analyses for the purposes o f traceability and good GLP.
1.6.2.4. Evaporation.
Vial caps cannot be fully sealed in CE since there is a requirement to insert the capillary and electrode into the buffer. Loss of analytes and/or solvents is therefore possible via evaporation especially during long run sequences such as overnight separation. The use of so-called star caps with cross-slotted openings has been shown to reduce losses via evaporation[83].
1.6.2.5. Alteration of the capillary wall.
Rinsing with some form of wash solvent followed by the relevant buffer is commonly performed between replicate separations to remove adsorbed materials, avoid sample carryover and re-equilibrate the capillary. Considerable time may be necessary to re equilibrate the capillary in some applications[84]. It has been stated[85] that a reproducible EOF is not achieved until a capillary has been regularly used for a period o f one to four months. When a capillary has been used for an extended period the inner wall may become altered. Additionally, EOF tends to gradually reduce as the capillary ages[77].
1.6.3. Detection.
1.6.3.1 On-capillary absorbance detection.
The first wave o f commercially available CE detectors were closely based upon established HPLC instrumentation. Conversion for CE detection required only the additional sphere (or ball) optics to collimate light across the diameter o f the capillary. On-capillary UV absorbance detection rapidly became almost universal for all CE application involving organic compounds containing a chromophore. However, concentration detection limits are poor compared to HPLC due to the combination o f the narrow detection light path and nl quantities of materials involved.
Increasing the capillary diameter increases both the amount of sample injected onto the capillary and the length of the UV detection light path. However, wide bore capillaries generate higher currents that cannot be efficiently dissipated leading to the detrimental effects of Joule heating. Hence the use of wide-bore capillaries to improve sensitivity may not be suitable for all applications.
Separation capillaries with modified detection windows are now commercially available. The most common and least expensive example is the so-called “bubble cell” in which the internal diameter of the detection window is significantly larger than the remainder o f the capillary. Typical sensitivity enhancements are in the order of 3-5 fold. Djordjevic and co- workers[87] compared the performance of a sleeve cell extended light path design with a commercially available bubble cell capillary and on-column detection in a 75 pm id capillary. An abrupt change in capillary diameter in the sleeve cell (50 to 220 pm) did not result in excessive band broadening and was found to improve peak symmetry.
1.6.3.2. Preconcentration.
Several methods utilising properties of the electrophoretic process may be employed to concentrate (or stack) a sample on the capillary prior to separation. These methods employ different kinds of discontinuous buffers to invoke different velocities to the same analyte molecules resulting in sharpening of the sample band. An excellent review of this area was recently provided by Shihabi[89].
Sharpening may be accomplished by simply dissolving the sample in an injection solvent with a lower ionic strength than the separation buffer. A similar effect may be achieved by dissolving the analyte in a solvent with a lower viscosity than water such as acetonitrile. Stacking in this manner typically yields a