www.wjpr.net Vol 4, Issue 10, 2015. 886
FORMULATION, DEVELOPMENT AND EVALUATION OF
DELAYED RELEASE TABLETS OF ASPIRIN USP
Palanisamy. P,* R. Margret Chandira, B. Jaykar, A. Pasupathi, B. S. Venkateshwarlu
Department of Pharmaceutics, Vinayaka Mission‟s College of Pharmacy, Vinayaka Mission‟s University, Salem (D.T), Tamil Nadu(State), India.
ABSTRACT
The investigation is undertaken with an aim to formulation, development and evaluation of delayed release tablet of Aspirin. The Assay and Impurity drug were carried out by HPLC method. The drug powders were subjected to Preformulation studies. The Preformulation characteristics are within the Pharmacopeial specifications. The drugs and excipients compatibility were carried out by FT-IR studies and DSC. The spectra showed that there was no interaction between them. The drugs and excipients compatibility were carried out by HPLC method and by physical observation showed that there was no interaction between them. For Aspirin DR tablets direct granulation was method of choice. Optimization was done and it was found that release profile was found to be best with disintegrant i.e. sodium starch glycolate. Enteric coating of Protectab HP-1 Sunset yellow Lake IPA coating 10%w/w was done on Aspirin tablets as to avoid any interaction gastric problems. Results found that release profile of batch no.AF4 matches with Innovator product . The Percentage cumulative drug release of batch. No. AF4 was found at 90 Minutes 104.21%. From results it can be inferred that release profile of Batch. No: AF4matches with that of innovator product, also f1&f2 (62) value are good enough to comply with the innovator‟s product INNOVATOR have reported similar kind of results for studies with Aspirin.
KEYWORDS: Aspirin, Coronary artery disease, Acute coronary syndrome, Delayed release.
Volume 4, Issue 10, 886-911. Research Article ISSN 2277– 7105
Article Received on 20 July 2015,
Revised on 11 Aug 2015, Accepted on 02 Sep 2015
*Correspondence for
Author
Palanisamy. P
Department of
Pharmaceutics, Vinayaka Mission‟s College of
Pharmacy, Vinayaka Mission‟s University,
Salem (D.T), Tamil
www.wjpr.net Vol 4, Issue 10, 2015. 887 INTRODUCTION
The convenient oral drug delivery has been known for decades is the most widely utilized route of administration among all the routes. It remains the preferred route of administration in the discovery and development of new drug candidates. The popularity of oral route is attributed to patient acceptance, ease of administration, accurate dosing, cost effective manufacturing methods and generally improve the shelf life of the product.[1]. These systems are based on pH dependent drug release mechanism of similar to conventional enteric-coated formulations, but they differ in target site for delivery and therefore type of enteric polymers. Most commonly used polymers are derivatives of acrylic acid and cellulose. These polymers have ability to withstand from low pH end several hours. In pharmaceutical practice several approaches exist for administration of drug to the patient. If the drug is given in conventional dosage form, it has to be administered several times to produce designed therapeutic effect. Because of frequent dosing fluctuation in plasma drug level occur. Fluctuation resulting from the conventional dosage form it minimize by delayed release dosage form. Drug concentration can be controlled within narrow therapeutic range by use delayed release system. The delayed release tablets of Aspirin were prepared by using direct compression method. Different formulations were prepared with varying concentration of disintegrating agent and lubricant and optimized formulation was to be found in this present study. This delayed release of the optimized formulation was expected to increase the bioavailability.
MATERIALS AND METHODS
Materials
Aspirin was received as a gift sample from Caplin Point Research Laboratory. MCC pH-102 was gifted by FMC Bio-polymer (India). Sodium Starch Glycolate was gifted by Chetan & Chetan (India). Purified Talc, Aerosil and Magnesium stearate was gifted by Cabot Sanmer (India).
IMPURITYPROFILE
Single and total impurities present in Active pharmaceutical ingredient (API) were measured by HPLC. The results are shown in Table. No: 10.
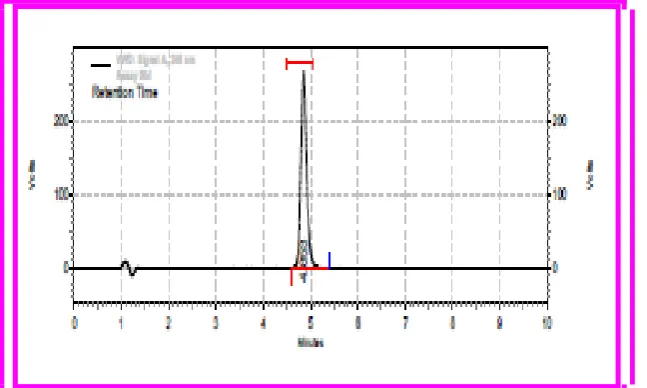
ASSAY
www.wjpr.net Vol 4, Issue 10, 2015. 888 chromatograms were obtained. The concentration of drug was calculated as
Concentration of sample=Peak area of sample x Concentration of reference standard
Peak area of reference standard
The results are shown in Table. No:10 & Figure. No:2
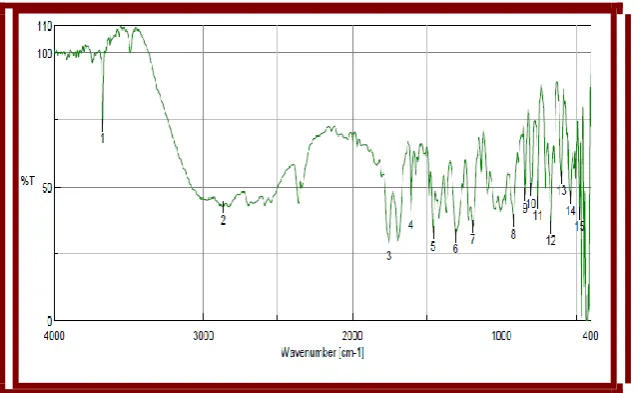
SPECTRAL IDENTIFICATION [2]
Excipients are integral components of almost all pharmaceutical dosage forms. The successful formulation of a stable and effective solid dosage form depends on the careful selection of the excipients, which are added to facilitate administration, to promote the consistent release and bioavailability of the drug and protect it from degradation. Infra red spectroscopy is one of the most powerful analytical techniques to identify functional groups of a drug. In the present study, the potassium bromide disc (pellet) method was employed. Chemical stability was confirmed by IR spectrometry. The results are shown in Figure. No: 3-12.
DIFFERENTIAL SCANNING CALORIMETER STUDIES[3]
The sample of plain drug was scanned in beginning. Than physical mixtures of drug with
excipients kept for one month, were scanned. Both the drug was scanned from50°C to 250°C. The results are shown in Figure. No: 13.
COMPATIBILITY STUDIES[4]
Drug–Excipients compatibility was performed using HPLC method and by physical observation. The results are shown in Table. No: 11-12.
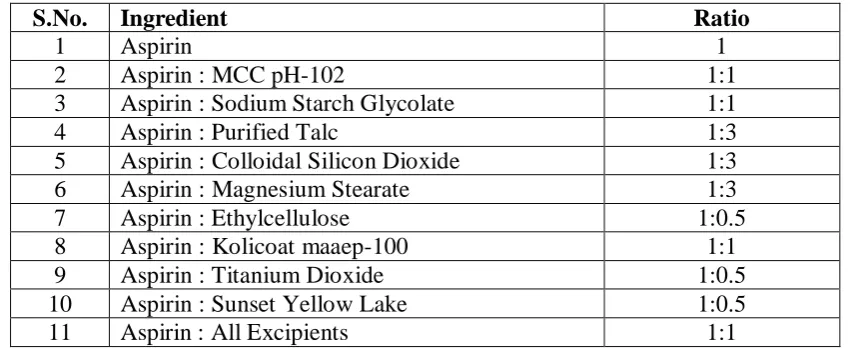
[image:3.595.85.513.593.771.2]Protocol for drug-excipients compatibility for Aspirin
Table. No: 1 Ratio of Aspirin to Excipients Taken For Compatibility Study
S.No. Ingredient Ratio
1 Aspirin 1
www.wjpr.net Vol 4, Issue 10, 2015. 889 INNOVATOR TABLET CHARATERIZATION
Table.no:2 Innovator Tablet Parameters to be Evaluated (Aspirin)
S.NO. PARAMETERSEVALUATEDFOR
1 Strength 2 Label Claim 3 Tablet Color 4 Tablet Shape 5 Description 6 Dimensions 7 Average Weight 8 Hardness
9 Dissolution Study
10 Uniformity Of Dosage Units 11 Impurity-A
12 Any Other Impurity 13 Total Impurities 14 Assay
The results are shown in Table. No:13-15 & Figure. No: 14
PREFORMULATION STUDIES OF PURE DRUG AND EXCIPIENTS[5-6]
Preformulation study relates to pharmaceutical and analytical investigation carried out proceeding and supporting formulation development efforts of the dosage form of the drug substance. Preformulation yields basic knowledge necessary to develop suitable formulation for the toxicological use. It gives information needed to define the nature of the drug substance and provide frame work for the drug combination with pharmaceutical recipients in the dosage form. Hence, the following Preformulation studies were performed on the obtained sample of drug. The results are shown in Table. No: 16-17.
Manufacturing Procedure
Manufacturing Procedure - Aspirin tablets using direct compression
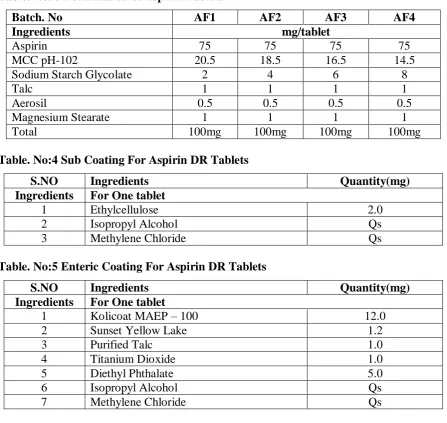
www.wjpr.net Vol 4, Issue 10, 2015. 890 Table. No: 3 Formulation of Aspirin Tablets
Batch. No AF1 AF2 AF3 AF4
Ingredients mg/tablet
Aspirin 75 75 75 75
MCC pH-102 20.5 18.5 16.5 14.5 Sodium Starch Glycolate 2 4 6 8
Talc 1 1 1 1
Aerosil 0.5 0.5 0.5 0.5
Magnesium Stearate 1 1 1 1 Total 100mg 100mg 100mg 100mg
Table. No:4 Sub Coating For Aspirin DR Tablets
S.NO Ingredients Quantity(mg)
Ingredients For One tablet
1 Ethylcellulose 2.0
2 Isopropyl Alcohol Qs
3 Methylene Chloride Qs
Table. No:5 Enteric Coating For Aspirin DR Tablets
S.NO Ingredients Quantity(mg)
Ingredients For One tablet
1 Kolicoat MAEP – 100 12.0 2 Sunset Yellow Lake 1.2
3 Purified Talc 1.0
4 Titanium Dioxide 1.0
5 Diethyl Phthalate 5.0
6 Isopropyl Alcohol Qs
7 Methylene Chloride Qs
Table. No:6 Optimized Parameters for Sub Coating for Aspirin DR Tablets
Conditions Pre-heating Coating Drying
Inlet air temperature (°C) 55-60 60-65 50 Product temperature (°C) 55-60 50-55 55-60 Outlet air temperature (°C) 35-60 55-60 50-55
Spray rate (ml/min) - 1-1.5
-Atomizing air pressure (psi) - 20
Pan speed (rpm) 55-57 55-57 55-57
Table. No:7 Optimized Parameters for Enteric Coating for Aspirin DR Tablets
Conditions Pre-heating Coating Drying
Inlet air temperature (°C) 55-60 60-65 50 Product temperature (°C) 55-60 50-55 55-60 Outlet air temperature (°C) 35-60 55-60 50-55
Spray rate (ml/min) - 2-3
-Atomizing air pressure (psi) - 30
www.wjpr.net Vol 4, Issue 10, 2015. 891
POST COMPRESSION PARAMETERS[7-10]
a) Weight Variation Test
Twenty tablets were selected randomly from each batch and weighed individually to check for weight variation. A little variation was allowed in the weight of a tablet according to U.S. Pharmacopoeia. The following percentage deviation in weight variation was allowed.
Average weight of a tablet Percentage deviation
130 mg or less ± 10 >130 mg and <324 mg ± 7.5
324mg or more ± 5
The results are shown in Table. No: 18-20.
b) Tablet Dimensions
Thickness and diameter were measured using calibrated Vernier calipers. Five tablets of each formulation were picked randomly and thickness and diameter was measured individually. The results are shown in Table. No: 18-20.
c) Thickness
The thickness of the tablets was determined by Vernier calipers. Five tablets from each batch were used and the average values were calculated. The results are shown in Table. No: 18-20.
d) Hardness
Hardness indicates the ability of a tablet to withstand mechanical shocks while handling. The hardness of the tablets was determined using Monsanto hardness tester. It is expressed in kg/cm2. Five tablets were randomly picked and hardness of the tablets was determined. The results are shown in Table. No: 18-20.
e) Friability test
The friability of tablets was determined by using Roche friabilator. It is expressed in percentage (%). Twenty tablets were initially weighed (Wt) and transferred into friabilator. The friabilator was operated at 25 rpm for 4 minutes or run up to 100revolutions. The tablets were weighed again (WF). The % friability was then calculated by-
W (initial)-W (final) %F = __________________×100 W (initial)
www.wjpr.net Vol 4, Issue 10, 2015. 892 f) Disintegration test
The disintegration time for immediate release layer was determined using the disintegration apparatus. One tablet was placed in each of six tubes placed in a beaker containing 1000 ml of purified water maintained at 37 ± 20 C and the apparatus was operated. The time taken for the tablets to disintegrate and pass through the mesh was noted. The results are shown in Table. No: 18-20.
METHOD OF ANALYSIS[11--15]
IN-VITRO DISSOLUTION STUDIES
Apparatus: Dissolution Apparatus USP Type II (Basket) Medium: 0.1N Hydrochloric acid
Volume: 1000mL Speed: 100 RPM Time: 2 Hours.
Time intervals: 30 Minutes, 1 & 2 Hours. Temperature: 37 ± 0.5°C.
Chromatographic Conditions
Apparatus: High Performance Liquid Chromatography system (HPLC) Column: C18, 150 × 4.6, 5µ (Inertsil)
Wavelength: 265nm Detector: UV/PDA Injection volume: 20μl. Flow rate: 1.0ml/min
Sample cooler temp. : 30°C Run Time : 10 minutes Elution : Isocratic
Calculations
www.wjpr.net Vol 4, Issue 10, 2015. 893 Dissolution of Aspirin in mg/tablet
SPL Area STD wt in mg 5 1000 99.85 1
= --- X --- X --- X ---X---X---X 100 STD Area 100 50 1 Tablet 100 100
The results are shown in Table. No:21 Figure. No: 17.
ASSAY
Apparatus : Dissolution Apparatus USP Type I (Paddle) Medium : Buffer pH-6.8
Volume : 1000mL Speed : 100 RPM Time: 90 Minutes.
Time intervals: 15, 30, 45, 60 & 90 Minutes. Temperature: 37 ± 0.5°C.
Chromatographic Conditions
Apparatus: High Performance Liquid Chromatography system (HPLC) Column: C18, 150 × 4.6, 5µ (Inertsil)
Wavelength: 265nm Detector: UV/PDA Injection volume: 20μl. Flow rate: 1.0ml/min Sample cooler temp.: 30°C Run Time: 15 minutes Elution: Isocratic
Calculations
From the Standard and Sample Chromatogram, calculated the percentage of the labeled amount of Aspirin (C9H8O4) percentage release of the Tablets taken by the following formula,
Dissolution of Aspirin in mg/tablet
SPL Area STD wt in mg 5 1000 99.75 1.305
www.wjpr.net Vol 4, Issue 10, 2015. 894 The results are shown in Table. No:22-25 &Figure. No: 18-19.
ASSAY
Chromatographic Conditions
Apparatus: High Performance Liquid Chromatography system (HPLC) Column: C18, 150 × 4.6, 5µ (Inertsil)
Wavelength: 265nm Detector: UV/PDA Injection volume: 20μl. Flow rate: 1.0ml/min Sample cooler temp.: 30°C Run Time: 10 minutes Elution: Isocratic
Calculations
From the Standard and Sample Chromatogram, calculated the percentage of the labeled amount of Aspirin percentage release of the Tablets taken by the following formula,
Assay of Aspirin in mg/tablet
SPL Area STD wt in mg 5 100 50 99.76 1
= --- X --- X ---X---X ---X---X---X 100 STD Area 100 50 SPLwt 5 100 100
The results are shown in Table. No:24.
STABILITY STUDIES[16-18]
Stability testing forms an integral part of formulation development. It is important to assess the effect of temperature and humidity on stability of drug and in-vitro drug release rate. It helps to generate information for predicting the shelf life of the product and recommended storage conditions. Stability data is required to be submitted as part of the dossier submitted to the regulatory agencies.
Protocol For stability studies
Formulation was selected on the basis of in-vitro drug release profile which was comparable to that of the DR formulation under reference i.e. optimized formula for both Aspirin batches. Optimized formula Batch.no:AT4for Asp ir in DR(75mg),in Alu Blister Pack.
www.wjpr.net Vol 4, Issue 10, 2015. 895 Table. No:8 Stability Condition for Aspirin Tablet
Study Storage condition Time Period Covered
Room Temperature (RT) 25°C ± 2°C/60%RH± 5%RH
3months
Testing :If accelerated condition tablet is passed
Accelerated 40°C ± 2°C/75%RH± 5%RH 3 months
Testing:1,2,3month
These were evaluated for their physicochemical characteristics, drug content, assay and in-vitro release profile of Aspirin Tablet. In–in-vitro release and content of active ingredients was estimated at one month interval during to rage period. The results are shown in Table. No:26-27 & Figure. No: 20-2
[image:10.595.74.466.263.703.2]RESULT AND DISCUSSION
Table.no: 9 Standard Calibration Curve of Aspirin
S.No Concentration in ppm Area
1 10 25.8885
2 20 54.8114
3 50 140.4123
4 100 298.1254
5 120 375.2312
6 160 497.0895
7 200 607.1886
[image:10.595.143.455.480.682.2]*Mean±SD n=3
www.wjpr.net Vol 4, Issue 10, 2015. 896 Table. No:10 Impurity Profile and Assay of Aspirin API
Impurity A 0.05%
Impurity B Not Detected
Impurity C Not Detected
Impurity D 0.06%
Any Other Impurity Not Detected
Total Impurity 0.25%
Assay 99.85%
Conversional factor 1
[image:11.595.139.463.243.437.2]*Mean±SD (n=6)
Figure. No: 2 Aspirin Assay Chromatogram
[image:11.595.141.457.481.672.2]www.wjpr.net Vol 4, Issue 10, 2015. 897 Figure. No:4 FTIR Spectrum of Aspirin + MCC pH-102
Figure.No: 5 FTIR Spectrum of Aspirin + Sodium Starch Glycolate
[image:12.595.140.459.540.736.2]www.wjpr.net Vol 4, Issue 10, 2015. 898 Figure.No:7 FTIR Spectrum of Aspirin + Aerosil
Figure.No:8 FTIR Spectrum of Aspirin + Magnesium Stearate
www.wjpr.net Vol 4, Issue 10, 2015. 899 Figure.No:10 FTIR Spectrum of Aspirin + Enteric Coating polymer
Figure.No:11 FTIR Spectrum of Aspirin + Colure
www.wjpr.net Vol 4, Issue 10, 2015. 900 DIFFERENTIAL SCANNINGCALORIMETERSTUDIES
Figure.No: 13 DSC Graph of Aspirin
DISCUSSION: From this figure. No:13 it can be seen that peak value of Aspirin was found
to be 141.98°C in DSC thermogram. This value matches with that given in the literature and confirm the purity of API.
Table. No:11 Compatibility study of Aspirin with Excipients The RS Data of Aspirin
(By HPLC) of 1 month excipients Compatability @ 40°C-75% RH
S.No. Ingredient Ratio Related substances %w/w
1 Aspirin 1 0.10
2 Aspirin : MCC pH-102 1:1 0.12 3 Aspirin : Sodium Starch Glycolate 1:1 0.14 4 Aspirin : Purified Talc 1:3 0.18 5 Aspirin : Colloidal Silicon Dioxide 1:3 0.19 6 Aspirin : Magnesium Stearate 1:3 0.18 7 Aspirin : Ethylcellulose 1:0.5 0.16 8 Aspirin : Kolicoat MAEP-100 1:1 0.17 9 Aspirin : Titanium Dioxide 1:0.5 0.14 10 Aspirin : Sunset Yellow Lake 1:0.5 0.13 11 Aspirin : All Excipients 1:1 0.19 *Mean±SD (n=6)
www.wjpr.net Vol 4, Issue 10, 2015. 901 Table. No: 12 Compatibility study of Aspirin with Excipients The RS Data of Aspirin
(By HPLC) of 1 month excipients Compatability @ 40°C-75% RH
Ingredient Ratio
Description
Related substance %w/w
1 Month 1 Month 25°C/60
%RH
40°C/75 %RH Aspirin 1 White to pale yellow, granular powder * * Aspirin : MCC pH-102 1:1 White to pale yellow, granular powder * * Aspirin : Sodium
Starch Glycolate 1:1
White to Grayish white, granular FF
powder * *
Aspirin : Purified Talc 1:3 White to pale yellow, granular powder * * Aspirin : Colloidal
Silicon Dioxide 1:3 White to pale yellow, granular powder * * Aspirin : Magnesium
Stearate 1:3 White to pale yellow, granular powder * * Aspirin : Ethylcellulose 1:0.5 White to pale yellow, granular powder * * Aspirin : Kolicoat
maaep-100 1:1 White to pale yellow, granular powder * * Aspirin : Titanium
Dioxide 1:0.5 White to pale yellow, granular powder * * Aspirin : Sunset
Yellow Lake 1:0.5
White to Grayish white, granular FF
powder * *
Aspirin : All Excipients 1:1 White to pale yellow, granular powder * * Result: * Indicated That No Change Was Observed
[image:16.595.67.534.472.709.2]ASPIRIN INNOVATORTABLET CHARACTERIZATION
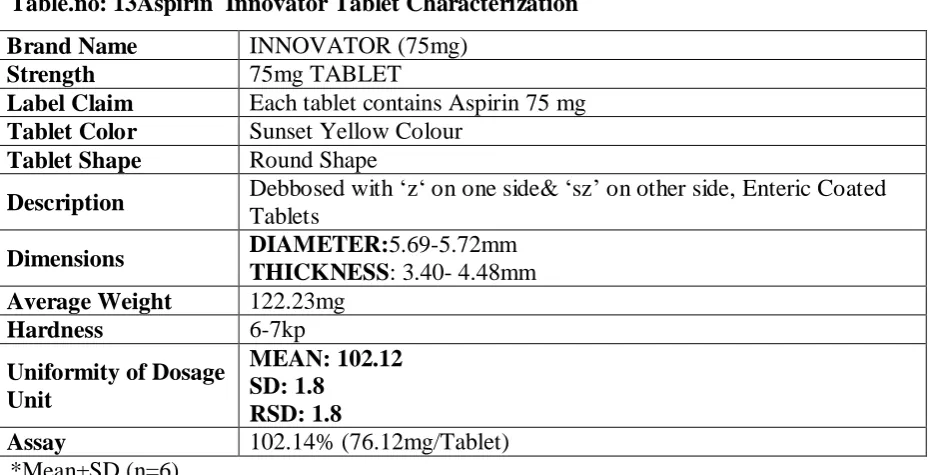
Table.no: 13Aspirin Innovator Tablet Characterization
Brand Name INNOVATOR (75mg)
Strength 75mg TABLET
Label Claim Each tablet contains Aspirin 75 mg
Tablet Color Sunset Yellow Colour
Tablet Shape Round Shape
Description Debbosed with „z„ on one side& „sz‟ on other side, Enteric Coated
Tablets
Dimensions DIAMETER:5.69-5.72mm
THICKNESS: 3.40- 4.48mm
Average Weight 122.23mg
Hardness 6-7kp
Uniformity of Dosage Unit
MEAN: 102.12 SD: 1.8
RSD: 1.8
Assay 102.14% (76.12mg/Tablet)
www.wjpr.net Vol 4, Issue 10, 2015. 902 Figure. No:14 Assay chromatogram of the Aspirin Innovator (pH-6.8 Phosphate buffer)
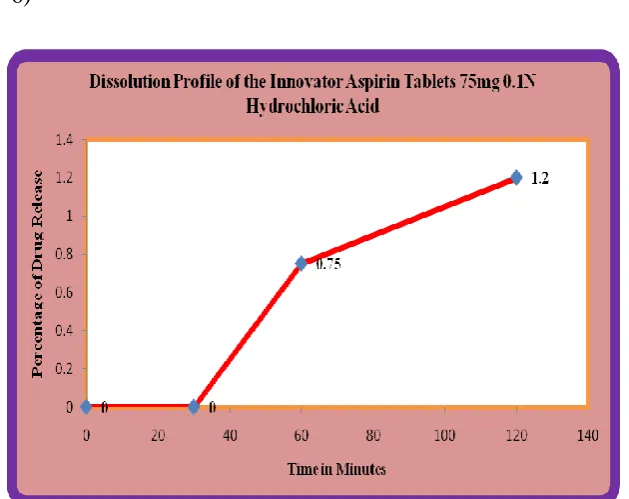
Table. No:14 Dissolution profile of the Aspirin Innovator Tablet (0.1N Hydrochloric
acid)
Dissolution Media (1000mL Media, at 100RPM)
Number of Units Used 6
Percentage of Drug Dissolved in Minutes
30 60 120
0.1 N Hydrochloric acid
Mean 0 0.75 1.2
±SD 0 0 0
±RSD 0 0 0
*Mean±SD (n=6)
Figure. No: 15 Dissolution Profile of the Innovator Aspirin Tablets 75mg 0.1N
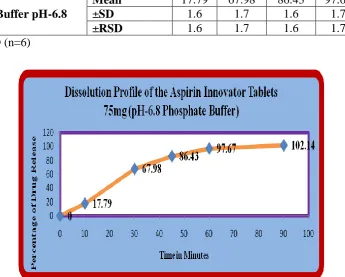
[image:17.595.141.456.451.700.2]www.wjpr.net Vol 4, Issue 10, 2015. 903 Table. No: 15 Dissolution Profile of the Aspirin Innovator Tablets 75mg (pH-6.8
Phosphate Buffer)
Dissolution Media (1000mL Media, at 100RPM)
Number of Units Used 6
Percentage of Drug Dissolved in Minutes
10 30 45 60 90
Phosphate Buffer pH-6.8
Mean 17.79 67.98 86.43 97.67 102.14
±SD 1.6 1.7 1.6 1.7 1.8
±RSD 1.6 1.7 1.6 1.7 1.8
*Mean±SD (n=6)
Figure. No: 16 Dissolution Profile of the Aspirin Innovator Tablets 75mg (pH-6.8
Phosphate Buffer)
Discussion: From this figure. No:16 it can be seen that amount of Aspirin DR dissolved in
10 & 90 Minutes is NLT 75% respectively. So, the above criteria as acceptance limit.
Table.No 16 Preformulation Study of Pure Drug (Aspirin).
S.NO. Parameters Result Conclusion
1 Bulk Density* 0.765 gm/ml --- 2 Tapped Density* 0.675 gm/ml --- 3 Angle of Repose* 18.61 Excellent 4 Carr‟s Index* 11 % Excellent Flow 5 Hausner Ratio* 1.21 Better Flow 6 Melting Point* 1350 C ----
[image:18.595.126.472.150.427.2] [image:18.595.62.535.565.696.2]www.wjpr.net Vol 4, Issue 10, 2015. 904 Table No 17 Preformulation Study of the blend (ASPIRIN)
[image:19.595.69.531.248.348.2]Batch Code Bulk Density* Tapped Density* Angle of repose* % Compressibility* Hausner Ratio* Loss on Drying* AF1 0.41 0.47 24.58 12.76 1.15 1.9 AF2 0.44 0.52 25.91 15.38 1.18 1.8 AF3 0.45 0.51 26.86 13.72 1.16 1.6 AF4 0.46 0.53 24.75 13.24 1.15 1.4 *Mean±SD (n=6); The physical parameters of drug as well as blends concluded that these were considerably good to formulate the tablet using direct compression technique.
Table No: 18 Evaluations of Aspirin Core-Tablets
Batch No Weight variation (mm)** Diameter (mm)* Thickness (mm)* Hardness (kg/cm2)*
Friability (%)
[image:19.595.68.536.386.484.2]Disintegrat ion Time* AF1 103±6.5 5.29±0.01 3.22±0.04 3.35±0.18 0.24 53 seconds AF2 104±6.5 5.38±0.02 323±0.03 3.41±0.19 0.29 47 seconds AT3 104±5.6 5.29±0.02 3.24±0.02 3.35±0.17 0.26 49 seconds AT4 104±6.5 5.37±0.03 3.35±0.04 3.37±0.17 0.29 51 seconds *Mean±SD (n=6) **Mean±SD (n=20)
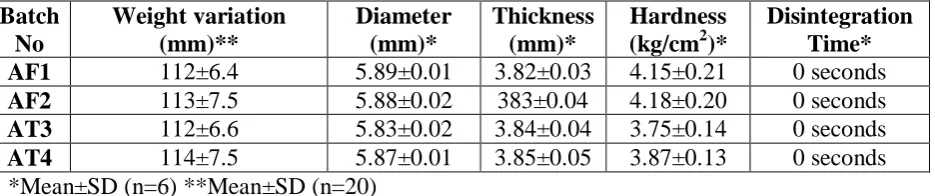
Table No: 19 Evaluation of Aspirin Enteric Coated-Tablets (0.1 N Hydrochloric acid)
Batch No Weight variation (mm)** Diameter (mm)* Thickness (mm)* Hardness (kg/cm2)*
Disintegration Time* AF1 112±6.4 5.89±0.01 3.82±0.03 4.15±0.21 0 seconds AF2 113±7.5 5.88±0.02 383±0.04 4.18±0.20 0 seconds AT3 112±6.6 5.83±0.02 3.84±0.04 3.75±0.14 0 seconds AT4 114±7.5 5.87±0.01 3.85±0.05 3.87±0.13 0 seconds *Mean±SD (n=6) **Mean±SD (n=20)
Table No: 20 Evaluation of Aspirin Enteric Coated-Tablets (pH-6.8 phosphate buffer)
Batch No Weight variation (mm)* Diameter (mm)* Thickness (mm)* Hardness (kg/cm2)*
Disintegration Time AF1 112±6.4 5.89±0.01 3.82±0.03 4.15±0.21 2 mts 23 sec AF2 113±7.6 5.88±0.02 383±0.04 4.18±0.20 2 mts 34 sec AT3 112±6.6 5.83±0.02 3.84±0.04 3.75±0.14 2 mts 42 sec AT4 114±7.5 5.87±0.01 3.85±0.05 3.87±0.13 2 mts 53 sec *Mean±SD (n=6) **Mean±SD (n=20)
Table.No:21 Dissolution Profile of the Aspirin DR Tablet AT1-AT4 with Innovator
(0.1N Hydrochloric acid)
% Cumulative Amount of Drug Release
Time (Minutes) AF1 AF2 AF3 AF4 INNOVATOR
30 0 0 0 0 0
www.wjpr.net Vol 4, Issue 10, 2015. 905 Figure. No :17 Dissolution Profile of the Aspirin DR Tablet AT1-AT4 with Innovator
[image:20.595.79.504.347.718.2](0.1N Hydrochloric acid)
Table.No:22 Dissolution Profile of the Aspirin DR Tablet AT1-AT4 with Innovator
(PHOSPHATE BUFFER pH-6.8)
% Cumulative Amount of Drug Release
Time (Minutes) AF1 AF2 AF3 AF4 INNOVATOR
10 14.13 14.36 14.78 15.12 17.79 30 50.45 52.34 54.67 69.12 67.98 45 72.35 74.67 77.78 89.13 86.43 60 91.87 93.87 95.57 99.89 97.67 90 93.89 95.98 98.43 104.21 102.14 *Mean±SD (n=6)
Figure. No: 18 Dissolution Profile of the Aspirin DR Tablet AT1-AT4 with Innovator
[image:20.595.146.452.525.711.2]www.wjpr.net Vol 4, Issue 10, 2015. 906 Table.No:23 Dissolution Profile of the Aspirin DR Tablet Optimized Formulation of
AT4 with Innovator (PHOSPHATE BUFFER pH-6.8)
% Cumulative Amount of Drug Release
Time (Minutes) AF4 INNOVATOR
10 15.12 17.79
30 69.12 67.98
45 89.13 86.43
60 99.89 97.67
90 104.21 102.14
*Mean±SD (n=6)
Figure. No:19 Dissolution Profile of the Aspirin DR Tablet Optimized Formulation of
AT4 with Innovator (PHOSPHATE BUFFER pH-6.8)
[image:21.595.144.454.249.444.2]www.wjpr.net Vol 4, Issue 10, 2015. 907 ASSAY AND CONTENT UNIFORMITY FOR ASPIRIN
Content Uniformity
Aspirin Optimized AF4 (ALU BLISTER PACK)
Mean SD RSD
102.46 1.6 1.6 *Mean±SD (n=6)
Table. No:24 Assay of the Aspirin
Tablet (Batch No) % of Drug Release* Content uniformity**
AF4 104.21 101.177±0.478
[image:22.595.44.557.289.408.2]INNOVATOR 102.14 100.674±0.453 *Mean±SD (n=6) *Mean=Not less than 75% ; **Mean = Not less than 80%
Table. No:25 Dissolution Profile of the Aspirin DR Innovator with AT4
Dissolution Media (1000mL Media, at 100RPM)
Number of Units Used 6
Percentage of Drug Dissolved in Minutes
10 30 45 60 90
INNOVATOR Phosphate Buffer pH-6.8
Mean 17.79 67.98 86.43 97.67 102.14
±SD 1.6 1.7 1.6 1.7 1.8
±RSD 1.6 1.7 1.6 1.7 1.8
AT4
Phosphate Buffer pH-6.8
Mean 15.12 69.12 89.12 99.89 104.21
±SD 1.7 1.7 1.8 1.8 1.9
±RSD 1.7 1.6 1.8 1.8 1.9
*Mean±SD (n=6)
[image:22.595.20.580.500.679.2]STABILITY STUDIES
Table. No:26 Stability Studies Data of the Aspirin Optimized Formulations (AF4) (ALU
BLISTER PACK)
Parameters Initial 1
st
Month 2nd Month 3rd Month
RT 40°C RT 40°C RT 40°C
Weight variation
(mm)** 114±7.5 113.5±7.3 113.5±7.2
113.5±7. 3
113.5±7.
1 113.5±7.3 113.5±6.9
Diameter (mm)* 5.87±0.01 5.85±0.26 5.85±0.24 5.85±0.2
6
5.85±0.2
3 5.85±0.26 5.85±0.21
Thickness (mm)* 3.85±0.05 3.83±0.21 3.83±0.18 3.83±0.2
1
3.83±0.1
8 3.83±0.21 3.83±0.18
Hardness (kg/cm2)* 3.87±0.13 3.84±0.11 3.84±0.08 3.84±0.1
1
3.84±0.0
8 3.84±0.11 3.84±0.04
Disintegration Time* 2 mts 53
sec
2 mts 47 sec
2 mts 34 sec
2 mts 47 sec
2 mts 30 sec
2 mts 47 sec
www.wjpr.net Vol 4, Issue 10, 2015. 908 Table. No:27 Stability Studies Data Assay & Dissolution of the Aspirin Optimized
Formulations (AF4) With INNOVATOR (ALU BLISTER PACK) &
Parameters Initial 1
st
Month 2nd Month 3rd Month
RT 40°C RT 40°C RT 40°C
*Assay 101.177
±0.478
101.128 ±0.468
101.101 ±0.418
101.128 ±0.453
101.091 ±0.418
101.128 ±0.447
101.065 ±0.389 *INNOVATOR
(Assay)
100.674
±0.453 100.556±0.454 100.574±0.483 100.574±0.453 *% of Cumulative
Release 104.21 103.89 103.29 103.65 102.79 103.56 102.49
*INNOVATOR (% of Cumulative Release)
102.14 102.22 101.98 102.09
*Mean±SD (n=6)
Discussion: Assay*Mean=Not less than 75% ; Dissolution**Mean = Not less than 80%.
The results indicated that the, optimized formulated tablets were within the Pharmacopeial specifications.
Figure. No:20 Stability Studies Data of the Assay of Aspirin Optimized Formulations
[image:23.595.49.552.110.273.2] [image:23.595.145.452.379.580.2]www.wjpr.net Vol 4, Issue 10, 2015. 909 Table. No:21 Stability Studies Data of the Dissolution Profile of Aspirin Optimized
Formulations (AF4) With INNOVATOR (ALU BLISTER PACK)
Discussion: From Table and Figure , it w a s seen that Aspirin DR Tablets Batch. No: AT4,
was showing good stability for three months accelerated condition @ 40°C &75%RH. It wa s found that dissolution and assay value are not affected for the batch, and total impurity is also less than 1%.
SUMMARY AND CONCLUSION
[image:24.595.144.453.69.258.2]www.wjpr.net Vol 4, Issue 10, 2015. 910 Optimization was done and it was found that release profile was found to be best with disintegrant i.e. sodium starch glycolate. Enteric coating of Protectab HP-1 Sunset yellow Lake IPA coating 10%w/w was done on Aspirin tablets as to avoid gastric irritations. Results found that release profile of batch no.AF4 matches with Innovator product DR Tablet. The Percentage cumulative drug release of batch. No. AF4 was found at 90 Minutes 104.21%. From results it can be inferred that release profile of Batch. No: AF4matches with that of innovator product, also f1&f2 values are good enough to comply with the innovator‟s product have reported similar kind of results for studies with Aspirin. Finally, the optimized formulations were subjected to accelerated stability studies and at room temperature (RT) as per ICH guidelines. The result obtained showed that there were no significant changes in tablet parameters such as appearance, hardness, friability, weight variation, drug content uniformity, and in-vitro drug release profile.
ACKNOWLEDGEMENTS
Authors are thankful to Prof (Dr.).B.Jaykar, Principal Vinayaka Mission‟s College of Pharmacy, Salem, Tamil nadu and providing all the facilities for this research project.
REFERENCES
1. Remington, The Science and pharmacy practice of pharmacy, 21st edition volume I & II, : 869-870.
2. Swarbrick J, Boylan J.C., Encyclopedia of Pharmaceutical Technology, Second Volume-1992; 531-536.
3. Vyas S, Khar R. Targeted and Controlled drug delivery; Novel carrier systems. First edition, CBS Publishers; New Delhi; 2006; 417-457.
4. Amidon, G. E.; Augsburger, L. L.; “Physical test methods for powder flow characterization of pharmaceutical materials: a review of methods"Pharmacopeial Forum 25, 1999; 8298-8308.
5. Clarke‟s “Isolation and Identification of drugs”, 2nd edition, The pharmaceutical press, London, 1986; 838.
6. Regmington : The Science and practice of Pharmacy. 20th Edition; 2000; 903-929.
www.wjpr.net Vol 4, Issue 10, 2015. 911 8. Fonner “Characterization of Granulation” in “Pharmaceutical dosage forms: Tablets”,
Volume. No:2, edited by Lieberman H.A., Lachman L., Marcel Dekker; 240-249. 9. Carver, L.D.: Particle Size Analysis, Industrial Research, August, 1971; 39 – 43.
10.Agbada, C.O., and P.York, “Dehydration of theophylline monohydrate powder effects of particle size and sample weight”, Int. J. Pharm, 1994; 106: 33-40.
11.The United States Pharmacopoeia. The National Formulary, USP 22, NF 17, United States Pharmacopoeial Convention, Inc., Rockville, M.D., 1990; Page.No: 1528.
12.Carver, L.D.: Particle Size Analysis, Industrial Research, August, 1971: 39 – 43.
13.Agbada, C.O., and P.York. “Dehydration of theophylline monohydrate powder effects of particle size and sample weight”, Int. J. Pharm, 1994; 106: 33-40.
14.Guidance for Industry SUPAC-MR. Modified Release Solid Oral Dosage Forms Scale- Up and Post approval Changes: Chemistry, Manufacturing, and Controls. In vitro Dissolution Testing and In Vivo Bioequivalence Documentation.
15.Moore, J., Flanner, H., Mathematical comparison of dissolution profiles. Pharm Tech, 1996; 20: 64-74.
16.Ahlneck, C., and Zografi. The molecular Basis of moisture effects on the physical and chemical stability of drugs in the solid state, Int. J. Pharm. 1990; 62: 87-85.
17.ICH Guideline Published by Europian Medicines agency CAMP /ICH/ 2736/99 August 2003.