EFFECT OF CONDUCTIVITY AND pH ON THE SOIL IN DIFFERENT
TRAFFIC AREAS OF HYDERABAD
K. Srilaxmi1*, G. Ramya Sree1 and Dr. D. Sirisha1
Department of Chemistry, St.Ann’s College for Women, Mehidipatnam, Hyderabad,
Telangana, India.
ABSTRACT
Urban soils act as a sink for heavy metals and other pollutants due to
anthropogenic activities such as vehicular emissions, waste water
sludges and industrial wastes. Anthropogenic activities like industrial
and energy production, construction waste disposal, domestic heating
systems contribute to increase levels of heavy metals in the soil. Heavy
metal accumulation in the soils is of considerable important because
they are persistent, non biodegradable and toxic to biota if they exceed
threshold value. Urban soils vary spatially due to soil composition and
they bring change in land use and land cover and play a key role in
environmental change. Additional input of waste materials, land
scaping and rapid change of land use also contributed unpredictable
modifications of soil properties and poor soil structure increasing the concentration of heavy
metals. Road side soil samples were collected from different places in the twin cities of
Hyderabad representing activities taking place across the metropolitan city of Hyderabad.
PH, conductivity, colour of the soil, crystalline amorphous nature of soils were determined.
From the results of this study, the samples collected from different areas shows variation in
their colour like dark brown, reddish brown, black, reddish and Black/Brown colour. From
the brown colour of soil indicates the presence of iron component goethite Fe(OH)3, hematite
Fe2O3, black colour indicates MnO2 and humus content. The electrical conductivity of soil
samples was varied between 0.09 to 3.2. In all the samples Conductivity of with respect to
levels from surface to 10 cms decreased variably. The PH of the road side soils is ranging
from 7.5 to 8.3 which enhance the increased heavy metals.
KEYWORDS: Traffic areas, Soil, p H, Conductivity, Heavy Metals, Pollution.
Volume 6, Issue 12, 736-746. Research Article ISSN 2277– 7105
*Corresponding Author
K. Srilaxmi
Department of Chemistry,
St.Ann’s College for
Women, Mehidipatnam,
Hyderabad, Telangana,
India.
Article Received on 04 August 2017,
Revised on 25 August 2017, Accepted on 16 Sept. 2017
INTRODUCTION
Urban soils[1] act as a sink for heavy metals and other pollutants due to anthropogenic
activities such as vehicular emissions, waste water sludges and industrial wastes.
Anthropogenic activities like industrial and energy production, construction waste disposal,
domestic heating systems contribute to increase levels of heavy metals in the soil. [3]Heavy
metal accumulation in the soils is of considerable important because they are persistent,
nonbiodegradable and toxic to biota if they exceed threshold value.
[5]
Urban soils vary spatially due to soil composition and they bring change in land use and
land cover and play a key role in environmental change. [7]Additional input of waste
materials, land scaping and rapid change of land use also contributed unpredictable
modifications of soil properties and poor soil structure increasing the concentration of heavy
metals.
Soil pH2 is an indication of the acidity or alkalinity of the soil and it is measured in pH units.
Soil PH is defined as the negative logarithm of the hydrogen ion concentration. The pH scale
ranges from 0 to 14 with pH-7 as the neutral point. As the amount of hydrogen ions in the soil
increases the pH decreases indicating the acidic nature and from pH 7 to 14 the soil
increasingly more alkaline or basic.
The electrical conductivity is the property that has a material to transmit or conduct electrical
current (1-12). The apparent soil conductivity is a measure of the bulk electrical conductivity
and it is influenced by porosity, concentration of dissolved electrolyses texture, quantity and
composition of colloids organic matter and water content in soil.[8]
Hyderabad is a common capital of Telangana and Andhra Pradesh. It has a population of
6,809,970. It is the fourth biggest city in India. It is the fourth biggest city in India. It is
governed by Greater Hyderabad Municipal Corporation (GHMC). It has an area of 650
sq.kms. The topography of the city is sloping rocky terrain of grey and pink granites. It has a
unique combination of wet and dry climate that borders hot-semi arid climate. The city lies at
17.366oN and a attitude of 78.476 Eo longitude. Most of rain will be received by south-west
summer monsoon and it falls between June and September. This city is polluted heavily by
industrial, vehicular activities. Taking that factor into consideration, present study has been
Topography
The city lies in Deccan Plateau and rises above an average height of 536m. Rocky and hilly
regions are under obliteration for urbanisation. Grey and Pink granites are among worlds
oldest geographically it is located in the northern part of Deccan plateau, on banks of river
musi. It is a slopy terrain. The city’s soil is red sandy with areas of black cotton soil.
MATERIALS AND METHODS
Sample collection areas
[12]
The selection of the sampling sites was mainly based on the approach that sampling must
be carried out wherever possible near road-ascents, road descents, roadblocks, detours and at
points of traffic jams that may assure high rates of polluted soils.
Banjara Hills
(Collections from google maps).
Banjarahills, original habitants are Banjara tribes and they use to perform folk dances at
family functions and wedding till about 12 years ago. It is named after Banjara Bhavan the
residence of Mehdi Nawab Jung. This area is of rocky terrain. It has 14 roads it is one of 150
boroughs of Greater Hyderabad. The coordinates of Banjara Hills are 17.4167oN and
78438247 E. It Tank bund road in the Hyderabad,
Tankbund
Tankbund road runs between Hyderabad and Secunderabad and it connects the two cities.
Somajiguda
Somajiguda initially a peaceful residential locality and now it has turned into a modern
business centre and it is close to city centres such as Begumpet, Punjagutta and Khairthabad.
The cooridinates are 17o 428911o Nand 78.455343oE.
Khairthabad
Khairthabad lies at the coordinates 17.436793oN and 78. 443906oE. Khairthabad is named
after a khairunnisa bomb placed next khairthabad mosque. It is a major road junction of
somajiguda, Ameerpet, Khairthabad circle, Anand nagar, and Lakdikapul.
Masabtank
Masabtank is named after Maa-Sahaba tank. It is a major suburb of Hyderabad, India. The
population of this area is 1, 50,000. The area lies at the junction Road1 Banjarahills,
Humuyunnager and Lakdikapul.
Lingampally is a suburb near Hyderabad (city). It is close to BHEL and is located on national
high way of Mumbai. Many residential colonies lie around Lingampally. The coordinates of
this area are 17.483473oN and 78.311731oE.
Lothukunta
Lothkunta is a suburb in the cantonment on the northern border of
Hyderabad city, Telangana, India. It is situated at a distance of around 7 km
from Secunderabad and approximately 14 km from Hyderabad. It lies on the national
highway. Lothkunta comes under mandal- Malkajgiri -Population - 193,863.Lothukunta is a
suburb in the cantonment on the northern border of Hyderabad city in Telangana.
Medhipatnam
Medhipatnam is the major suburb in Hyderabad India. It derives its name from Nawab Mehdi
Nawaz Jung. It is located in 17.3959oN and 78.4312oE.
Tolichowki
Tolichowki is a major suburb in Hyderabad, India. The name Tolichowki comes from the
Urdu word 'Toli', meaning 'troupe', and 'Chowki', meaning 'post'. It is located in
Secunderabad
Secunderabad also spelled sometimes as Sikandar-a-bad), popularly known as the twin
city of Hyderabad is located in the Indian state of Telangana. Geographically divided from
Hyderabad by the Hussain Sagar lake, Secunderabad is no longer a separate municipal unit
and has become part of Hyderabad's GHMC municipality. It is located in 17.45, 78.5.
Aaramghar
Aramghar is near to shivarampally in outskrit of Hyderabad.It is located in 17°19'12"N
78°25'53"E.
Secretariat
It is placed in center of the hyderbad city near to tankbund and surrounded by many tourism
places, Because of it heavy present in this area.it is located 17° 27′ 0″ N, 78° 30′ 0″ E.
Beeramguda is the place where to Famous Temple of Lord Shiva is located. It is located on
the Hyderabad-Bombay NH-9 Hwy, near to Patancheru in the Ramachandrapuram
Area.Nearby cities: Sangareddy, Tandur, Armoor,Coordinates: 17°31'10"N 78°18'3"E.
Sample Collection: From the mentioned area, samples were collected by using spiral auger
of 2-5 cm diameter and all the road side samples were placed in clean plastic bags for further
analysis.
Experimental Methods: The conductivity, PH, colour intensity of the soil samples were
determined by using digital conduct meter, PH meter and colorimeter.
[image:7.595.86.513.313.776.2]RESULTS AND DISCUSSIONS
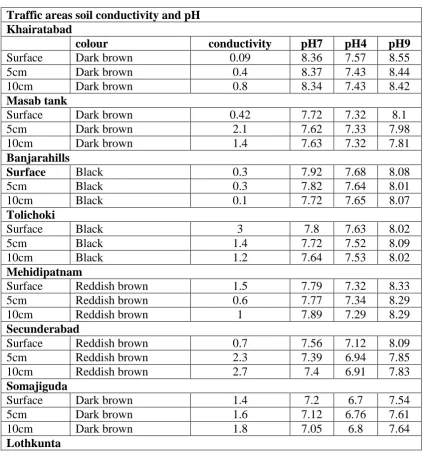
Table -1.
Traffic areas soil conductivity and pH Khairatabad
colour conductivity pH7 pH4 pH9
Surface Dark brown 0.09 8.36 7.57 8.55
5cm Dark brown 0.4 8.37 7.43 8.44
10cm Dark brown 0.8 8.34 7.43 8.42
Masab tank
Surface Dark brown 0.42 7.72 7.32 8.1
5cm Dark brown 2.1 7.62 7.33 7.98
10cm Dark brown 1.4 7.63 7.32 7.81
Banjarahills
Surface Black 0.3 7.92 7.68 8.08
5cm Black 0.3 7.82 7.64 8.01
10cm Black 0.1 7.72 7.65 8.07
Tolichoki
Surface Black 3 7.8 7.63 8.02
5cm Black 1.4 7.72 7.52 8.09
10cm Black 1.2 7.64 7.53 8.02
Mehidipatnam
Surface Reddish brown 1.5 7.79 7.32 8.33
5cm Reddish brown 0.6 7.77 7.34 8.29
10cm Reddish brown 1 7.89 7.29 8.29
Secunderabad
Surface Reddish brown 0.7 7.56 7.12 8.09
5cm Reddish brown 2.3 7.39 6.94 7.85
10cm Reddish brown 2.7 7.4 6.91 7.83
Somajiguda
Surface Dark brown 1.4 7.2 6.7 7.54
5cm Dark brown 1.6 7.12 6.76 7.61
10cm Dark brown 1.8 7.05 6.8 7.64
Surface Reddish 3.2 7.3 6.9 7.77
5cm Reddish 1 7.64 7.26 8.15
10cm Reddish 1.2 7.49 7.12 8.07
Table-2.
Soil electrical conductivity and pH of Soil Samples
[4]
Road surfaces receive varying amount of heavy metals by the process of atmospheric
deposition, sedimentation, impaction and interception.[14] Land use has generally been
considered a local environmental issue, but it is becoming a force of global importance[15] The
pH and EC are usually considered as indicators or measurement of the chemical nature of
road dusts.
In Masab tank, the conductivity of soil is varying from 0.42 dS/m to 2.1 dS/m. At surface the
conductivity is low at 5 cm it is high and again at 10 cm it is decreased. The texture of soil
slit lome and non saline in nature.
In Mehdipatnam, the conductivity is from 1 dS/m to 1.5 dS/m. At surface it is high and
decreased at 5 cm and increased at 10 cm indicating the slit loam and non saline in nature. In
Secunderabad soil conductivity is 0.7 dS/m at surface as depth is increasing conductivity is
increased to 2.7 dS/m variation is about 2.0 dS/m. The soil was saline in nature, as the
salinity increase growth of the plants decreases In Banjara hills Lothkunta, Tolichowki,
Somajiguda it is almost constant. The pavement soil samples conductivity was ranging from
0.5 to 3.2 dS/m. pH is one of the factors which influence the bioavailability and the transport
of heavy metal [6]in the soil and according to [10]heavy metal mobility decreases with
increasing soil pH (8 and above) due to precipitation of hydroxides, carbonates or formation
Pavement soil of different areas
Area Colour Conductivity pH9
Khairatabad Dark brown 2.5 8.95
Tank bund Black 3.2 7.69
Somajiguda Brownish black 1 8.06
Banjara hills Black 1.6 8.21
Masab tank Dark brown 2.6 8.6
Tolickoki Black 3 8.02
Aaramgud Black 1.6 8.41
Secratariat Dark brown 0.5 7.84
Lingampally Black 2.1 8.3
Colour of the soil in the different areas of Hyderabad
[8]
Soil colour exhibits wide range of colours such as grey, black, white, red, brown, yellow
and indicates the composition of soils. Colour of soil and distribution of colour is due to the
chemical and biological weathering due to redox reactions taking place in the soil. From
table, it can be indicated that most of the soils Khairthabad, Masab tank samjiguda are dark
brown in colour and Medhipatnam, Secunderabad, Lothukunta soils are reddish brown in
colour. Banjara hills, Tolichowki are black in colour. Lothukunta soil samples are reddish in
colour. Black/Brown colour soil samples content. [5]The brown colour soil consists of iron
component goethite FeOH, hemalite Fe2O3 black colour indicates MnO2 and humas content
(14 Conductivity of the soil samples with respect to levels from surface to 10 cms.
CONCLUSIONS
The soil electrical conductivity (EC) also differed significantly among sampling points (< 0.5
dS/m). By comparison, [9]classified EC of soils as: non saline < 2; moderately saline 2 - 8;
very saline 8 - 16; extremely saline > 16. From the result of the study, the EC is classified as
extremely saline. In secunderabad, Tolichoki, Lothkunta conductivity of soils were
moderately saline in nature. Due to saline nature of soil plants can’t grow normally in traffic
areas.[12] The relatively higher EC values compared to the control site could be due to the
presence of high levels of ionisable materials in the sampling sites, including metal cations as
well as anions.
[13]
pH values distribution is related to geology. Most of soil samples showed neutral and
alkaline nature and there is no much variation with depth up to 10cm.The pH values obtained
at all sampling sites were within the alkaline range that is in between 7.29 to 8.46 pH except
Secunderabad, Lothkunta and Somajiguda which are slightly acidic in nature. The effect of
pH on heavy metal availability to plants has been reported by many researchers and it is
accepted that as pH decreases, the solubility of cationic forms of metals in the soil solution
increases and, therefore, they become more available to plants.[16]
REFERENCES
1. R.A. Sutherland “Bed sediment associated trace metals in an urban stream Oaho Hawail
“Environmental Geology, 39(6): 2000611-627.
2. P.Lee. Y.Yu.S.Yun and B.Meyer “Metal contamination and solid phase partitioning of
3. M. Coskun, E. Stieness M.V. Frontasyeva E. Sjohakk and S. Demkina “ Heavy metal
pollution of surface soil in the Thrance region Turkey” Environmental maintaining and
Assesment, 2006; (1-3): 119, 545-556.
4. Brady, Nyle C and Ray. R “well elements of the nature and properties of soil 95, 2006.
Lynnw.C and pearson, M.J the colour of soil, The Science Teacher 2000. C.W. Jain, S.J.
zhang Y.F.He.G.D.Zhou and Z.X.Zhou “Lead contamination in tea garden soils and
factors affecting the bioavailability chemosphere, 2005; 59: 1151-1159.
5. S. R. Smith and K. E. Giller, “Effective Rhizombium leguminosarum biovar Trifolii
Present in Five Soils Contaminated with Heavy Metals from Long-Term Applications of
Sewage Sludge or Metal Mine Spoil,”Soil Biology and Biochemistry, 1992; 24(8):
781-788. doi:10.1016/0038-0717(92)90253-T.
6. Omar A. Al-Khashman a,*, Reyad A. Shawabkeh b,Metals distribution in soils around
the cement factory in southern Jordan, Received 10 August 2005; accepted 11 August
2005.
7. I.Massas, S.Ehaliotis, S.Gerontids and E.Saris Elevated heavy metal concentration in top
soils of an Aegan Islan Town, Total available forms, orgins and distribution
“Environmental monitoring and Assessment, 2008.
8. N. M. Zhang, B. G. Li and K. L. Hu, “The Spatial Variation Characteristics of Lead and
Cadmium in the Soil of the Sewage Irrigation Area,” Actapedologicasinica, 2003; 40(1):
152-154.
9. J. A. Foley, A. Defries, G. P. Anser, G. Barford, G. Bo nan and S. R. Capenter, “Global
Consequences of Land Use,” Science, 2005; 309, 5734: 570-574.
doi:10.1126/science.1111772.
10.J. Imberion “Pattern and development of land use changes in the Kenya high lands since
the 1950’s Agriculture, Ecosystems and Environment, 1999; 76(1): 67-73.
11.Shakya Pawan Raj* and Pradhananga Achut Ram Determination and Contamination
Assessment of Pb, Cd, and Hg in Roadside Dust along Kathmandu-Bhaktapur Road
Section of Arniko Highway, Nepal, September 2013; 3(9): 18-25, ISSN 2231-606X,
Research Journal of Chemical Sciences.
12.Sana’a Odat 1)and Ahmed M. Alshammari 2), Spacial Distribution of Soil Pollution
along the Main Highways in Hail City, Saudi Arabia, Jordan Journal of Civil Engineeing,
13.S. Sauve, H. W. Enderson and H. E. Allen, “Solid-Solution Portioning of Metals in
Contaminated Soils: Dependence on pH, Total Metal Burden, and Organic Matter,”
Environmental Science & Technology, 2000; 1125-1131.
14.Water and Environment Study Center, Mutah University, Al-Karak 61710, Jordan b
Department of Chemical Engineering, Mutah University, Al-Karak 61710, Jordan.
15.Joseph Clement Akan*, Stephen I. Audu, Zakari Mohammed, Victor Obioma Ogugbuaja,
Assessment of Heavy Metals, pH, Organic Matter and Organic Carbon in Roadside Soils
in Makurdi Metropolis, Benue State, Nigeria , Journal of Environmental Protection, 2013;