Study of the Different Factors That Influence Jet Pump
Performance
A. A. Saker, H. Z. Hassan
Public Authority of Applied Education and Training,Kuwait City, Kuwait
Email: [email protected]
Received March 14, 2013; revised April 15, 2013; accepted April 22, 2013
Copyright © 2013 A. A. Saker, H. Z. Hassan. This is an open access article distributed under the Creative Commons Attribution License, which permits unrestricted use, distribution, and reproduction in any medium, provided the original work is properly cited.
ABSTRACT
The objective of this work is to study experimentally the characteristics of jet pump. Suction head, driving air pressure and the percentage of the distance between throat section and nozzle are recorded. The effect of each parameter on the pump performance is investigated, in order to have a better understanding about the behavior of such pump under vari-ous conditions. A simple geometry jet pump was designed, developed and tested. The experiments show that we should be careful in increasing the suction head, and stability must be considered between the suction head and the driving air mass flow rate. While the effect of increasing Pa will stop at certain maximum of the ratio of the mass flow rate of water to air (M), that is any increase in Pa will meet no change in M. While increasing S/Dth will leads to decrease in the per-centage of M because the optimum S/Dth = 0.5 so that at this value we will have the best performance and any other values for S/Dth the percentage M will decreases, but this effect is not so clear and it could be neglected. The pump per-formance is not so sensitive with the change of S/Dth after S/Dth = 0.5. Also this information will help improving and extending the use of the jet pump in many practical applications.
Keywords: Jet Pump; Nozzle-Throat Interface; Driving Air Pressure
1. Introduction
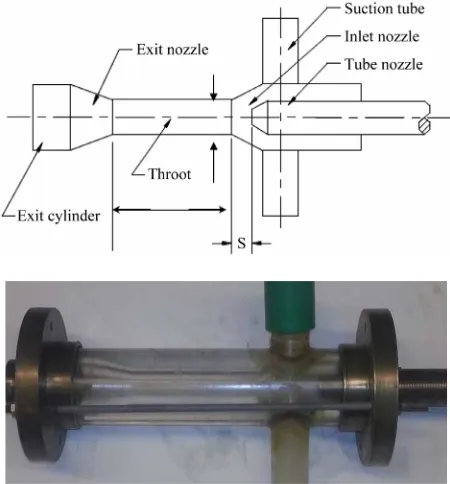
The jet pump is a low-pressure high volume flow rate pump. Simplicity of design, absence of any moving parts, ability to handle muddy water, reliability, ruggedness, and low cost, more than compensate for the relatively poor efficiency of the pump. There has been little com-mercial interest in the development of low area jet pumps because of their characteristically low head rise. The ba-sic components of jet pump are inlet nozzle, throat and diffuser.
Beside the later mentioned advantages of the jet pumps the applications through industry are too numer- ous to mention but some of the most common ones are, in power stations jet pump has been considered as an auxiliary boost pump in Rankine cycle, in ventilation and air conditioning, pneumatic or hydraulic conveyance of products in power form, coal and cinder transport in power plants, pumping of slug from shafts bore holes and pits, solid handling eductor is a special type called a hop- per eductor, pumping sand from filter beds and sparkler nozzle which is the simplest type of eductors and steam lined eductors used to remove condensate from vessels under vacuum.
A model for jet pumps is driven under the assumption that the power and the well fluids are incompressible liquids several times. When either the well or the power fluid contains gas, Lisowski [1] used liquid water as mo- tive and driven fluids. A flow phenomenon that appears during jet pump operation is investigated. Three designs of motive nozzle: standard, with additional circumferen- tial holes and with set of circumferential holes are exami- ned on motive nozzle. By modification of motive nozzle it is possible to increase pumping height with almost 45%.
The same equations driven for incompressible liquids are used with modifying the mass flow rate ratio and the friction loss coefficient, in order to obtain an acceptable conformity between the theory and observation, we have to increase the hydraulic loss coefficient—up to 30 times for the present case study, which is closed-conduits, this level of correction has been determined by means of the trial and error method, Jerzy [2].
literature on the design of liquid-liquid jet pumps contain empirical information on the coefficient S/Dth. I. El-Sa- waf [4] Study the effects of the pump operating condi- tions and geometries on the performance, the experimen-tal investigations that the jet pump head and the head ratio decrease with increasing suction capacity and the area ratio R (An/AMC) of 0.25 gives the maximum highest efficiency and the area ratio of 0.155 gives a lowest effi- ciency. The optimum value for S/Dth for pumping water is about 1.0. Ibrahim [5] insure the same investigations and the driving pressure of 1 bar gives the maximum delivered concentration in case of R = 0.25 and 0.4 but at R = 0.155 the driving pressure of 1.5 bar gives the ma- ximum delivered concentration.
In addition to promoting cavitation, interference be- tween the nozzle exterior and the throat entry interior surfaces is an important cause of the large losses in the jet pumps. The distance between the driving nozzle to the beginning of mixing chamber to driving nozzle diameter ratio of 1.5, gives the maximum for all tested cases. The mixing chamber length of 7.25 Dmix had proven superi- ority over the other two mixing chambers length of 6.75 and 7.86 Dmix. Mixing throat length ranging from 3.5 to approximately 10 times the throat diameters has been studied. Mueller [6] was one of the few investigators who measured the throat entry loss coefficient and his results graphically illustrate the profound effect of an adequate nozzle to throat spacing on the loss coefficient Ken (If S/Dth = 0.55 where the measured Ken value was 0.061). When the nozzle is inserted to S/Dth = 0.023, the measured Ken values were increased by an order of mag-nitude to 0.745, actually this radical increase in the throat entry loss coefficient reflects a combination of the main flow losses and a secondary flow losses.
Vogal [7] measured the static pressure rise in a very long throat length up to 20 diameters in length, the re-sults illuminated an often over looked point that is the dependence of optimum throat length on the flow ratio M, regardless, of the design area ratio of the pump. For an area ratio of R = 0.219 he found that the pressure rise in the mixing throat is at 5.3 diameters at low secondary flows approaching the cut-off point, and the required or optimum mixing length increased many times the dia- meters at high values of the flow ratio m, i.e., under low
Pd conditions.
Schulz [8] used a larger area of area ratio R = 0.219 found that the pressure peaked at L/Dth = 4.2 for (M) goes to zero as contracted with a required mixing length of L/Dth > 8.3 at a maximum flow ratio.
The mixing length required to achieve maximum pres- sure rise in the throat is properly viewed as the total dis- tance from the tip of the nozzle to completion of mixing.
i.e. (S/Dth + L/Dth). Note that the optimum S/Dth in-
creased from zero for the longest throat to 2.3 throat di-
ameters for the shortest length. Since the L/Dth values declined at a more rapid rate than growth in S/Dth, the totals declined somewhat. Note that the peak efficiency was obtained with the intermediate case, i.e., 1 diameter
spacing and a 5.66 diameter mixing throat length show in the same table for two short-throat pumps.
The same trend is evident; namely, a reduction in throat length requires a doubling in nozzle to throat spa- cing. Sanger’s [9] study provided further information on one of the undesirable effects of excessive S/Dth values when used with a long (7.25)-mixing throat. The corre- sponding static pressure profiles with S/Dth = 0 or 0.96 showed continuous pressure rise through the throat and leveling off at the exit, indicating an optimum length. In contrast, a similar profile with S/Dth = 2.68 resulted in a throat pressure rise, which peaked at about 4.5 diameters and then declined due to frictional losses in the throat.
Unfortunately, the liquid jet pump is increasingly prone to cavitation as the throat spacing (S/Dth) is re- duced to zero. Static pressure measurements at the throat entry show that zero spacing causes large pressure drops at the throat entry and consequently promotes cavitation. For S/Dth = 0 optimum nozzle setting for pump efficien- cy.
Hammoud [10] showed that nozzle to throat spacing to nozzle diameter ratio (L/D), for optimum jet pump per-formance the drive pressure was of 1.5 bar, while in-creasing the motive pump pressure the pump perform- ance decreased. Kumaraswamy [11] insured that nozzle to mixing tube spacing play an important role in the per- formance of the jet pump.
2. Expermental Set-Up and Measurement
The test rig description and components are herein in- troduced to demonstrate its ability to determine the value performance and to study the different parameters af- fecting this value. Consequently, the operational concept, detailed design of the jet pump and its internal compo- nents are illustrated. Subsequently, the measurement techniques and uncertainty analysis are introduced. Fi- nally test rig tuning up is achieved. The experimental apparatus of steam jet pump is shown in Figure 1. It con-
sists of compressed air tank, feed water tank, delivered water tank, manometer, orifice meter, jet pump, and other associated equipment’s for flow control and mea- surement.
Figure 1. Schematic diagram of the set-up assembly.
The Jet Pump consists of a converging diverging tube fabricated from Perspex plastic for visual observations studies, see Figure 2.
The upstream air pressure is measured using Bourdon gauge with measuring range of 0 - 10 bar with ±2% ac- curacy of full scale, while downstream air pressure is measured using Digital compound gauge with measuring range of 0 - 10 bar with ±0.1% accuracy of full scale. water mass flow rate is measured using graduated cylin- der and stop watch. Air mass flow rate is measured using an orifice meter, of discharge coefficient (Cd) 62.5%, with measuring range 0 - 500 mm and ±2 mm accuracy as shown in Figure 3.
3. Results and Discussion
In this work the jet pump is studied experimentally to investigate the effect of Suction head, driving air pres- sure and the percentage of the distance between throat section and nozzle on the pump performance. Such pa- rameters are studied and discussed below.
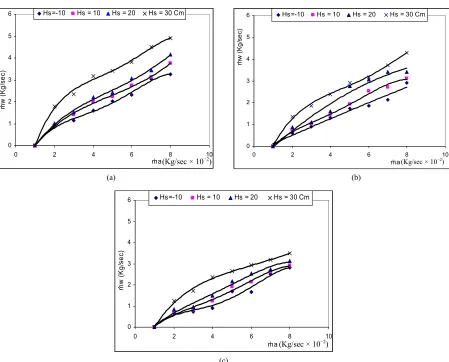
Figures 4(a)-(c) shows the relation between the
driv-ing air mass flow rate, and water mass flow rate at a con-stant S/Dth = 0.5, 1.5, and 3.0, respectively for different suction heads (Hs = −10, 10, 20, 30 cm). The driving air momentum starts to entrain water at flow rate of 1.1 × 10⁻² Kg/sec (corresponding to a supply pressure of ap-proximately 6.5 atm.). The results show that mw is di-rectly proportional to ma at various values of both Hs and S/Dth. Also, increasing the suction head improves the pump performance, where the water mass flow rate in- creases at the same driving air flow rate. Besides, de- creasing S/Dth causes a slight increase in the water mass flow rate.
Figure 2. Schematic diagram of Jet pump components.
Figures 5(a)-(c) shows the variations of water to air
[image:3.595.310.535.334.576.2]
Figure 3. Schematic drawing and photo of the orifice meter assembly.
0 1 2 3 4 5 6
0 2 4 6 8 1
ṁa (Kg/sec X 10 -2)
ṁ
w (
K
g/
se
c)
0
0 1 2 3 4 5 6
0 2 4 6 8
ṁa (Kg/sec X 10 -2)
ṁ
w (
K
g/
sec
)
Hs=-10 Hs = 10 Hs = 20 Hs = 30 Cm
10 Hs=-10 Hs = 10 Hs = 20 Hs = 30 Cm
(Kg/sec × 10−2)
(Kg/sec × 10−2)
(a) (b)
0 1 2 3 4 5 6
0 2 4 6 8
ṁa (Kg/sec X 10-2)
ṁ
w
(
K
g
/se
c)
10
Hs=-10 Hs = 10 Hs = 20 Hs = 30 Cm
(Kg/sec × 10−2)
(c)
Figure 4. (a), (b), and (c) Relation between water mass flow rate and driving air mass flow rate at S/D = 0.5, 1.5, and 3.0, re-spectively for different values of suction heads.
driving air is increased dramatically and consequently the water to mass ratio starts to decreases as shown from
Figure 5.
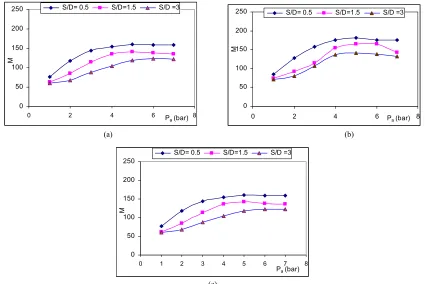
Figures 6(a)-(c) shows the variations of water to air
[image:4.595.74.523.285.647.2]0 40 80 120 160 200 240 280
0 2 4 6 Pa (bar)
M
8
H = 30 H = 20 H =10
0 40 80 120 160 200 240 280
0 2 4 6 Pa (bar) 8
M
H = 30 H = 20 H =10
(a) (b)
0 40 80 120 160 200 240 280
0 2 4 6 Pa (bar)
M
8
H = 30 H = 20 H =10
(c)
Figure 5. (a), (b), and (c) Relation between water to air mass ratio, and driving air pressure at S/D = 0.5, 1.5, and 3.0, respec- tively for different values of suction heads.
0 50 100 150 200 250
0 2 4 6 P 8
a (bar)
M
S/D= 0.5 S/D=1.5 S/D =3
0 50 100 150 200 250
0 2 4 6 P
a (bar)
M
8 S/D= 0.5 S/D=1.5 S/D =3
(a) (b)
0 50 100 150 200 250
0 1 2 3 4 5 6 7 8
Pa (bar)
M
S/D= 0.5 S/D=1.5 S/D =3
(c)
Figure 6. (a), (b), and (c) Relation between water to air mass ratio, and the driving air pressure at Hs = 10, 20, and 30 cm,
[image:5.595.93.505.86.374.2] [image:5.595.85.511.419.703.2]the water, and consequently additional cost of the pump-ing process. Hence, increaspump-ing the suction head and de-creasing the geometrical parameter (S/Dth) will recover the performance of the jet pump at the same driving pressure. Consequently, no additional cost is required anymore and the efficiency is conserved.
4. Conclusions
Increasing Hs leads to increase in ṁw for the same ṁa. But the optimum performance is at S/Dth = 0.5
The driving air pressure Pa leads to proportional in- crease in M up to the optimum region, and then in- creasing Pa will lead to decreases in M. This means that driving air pressure must be limited otherwise it causes a reverse effect.
REFERENCES
[1] E. Lisowski and H. Momeni, “CFD Modeling of a Jet
Pump with Circumferential Nozzles for Large Flow
Rates,” Archives of Foundry Engineering, Vol. 10, No. 3,
2010. pp. 69-72.
[2] J. M. Sawicki, “Hydraulic Loss Coefficient in 1D Flows,”
Archives of Hydro-Engineering and Environmental Me- chanics, Vol. 54, No. 2, 2007, pp. 95-116
[3] H. J. Zhu, B. S. Qiu, Q. K. Jia and X. L. Yang, “Simula-
tion Analysis of Hydraulic Jet Pump,” Advanced Material
Research, Vol. 204-210, 2011, pp. 293-296.
[4] I. A. El-Sawaf, M. A. Halawa, M. A. Younes and I. R.
Teaima, “Study of the Different Parameters that Influence
on the Performance of Water Jet Pump,” Fifteenth
Inter-national Water Technology Conference, Alexandria, 2011.
[5] R. T. Ibrahim, “A Central-Type Jet Pump Model For
Wheat Grains Removing From Water Channels,” Sixteenth
International Water Technology Conference, Turkey, 2012.
[6] N. H. G. Mueller, “Water Jet Pump,” 1964.
[7] R. Vogal, “Theoretische und Experimentelle
Untersuchun-gen as Strohlopparaten,” Vol. 5, Maschinenbautechnick, Berlin, 1965.
[8] F. Schulz and K. H. Fasol, “Wasserstahlpumen Zur
For-derung Von Flussegkeiten,” “Springer-Verlag, Vienna, 1958.
[9] N. L. Sanger, “Non-Cavitation Performance of Two Low
Area Ratio Water Jet Pumps Having Throat Lengths of 7.25 Diameters,” 1985.
[10] A. H. Hammoud, “Effect of Design and Operational
pa-rameters on Jet Pump Performance,” Proceedings of the
4th WSEAS International Conference onFluid Mechanics and Aerodynamics, Elounda, 21-23 August 2006, pp. 245-
252.
[11] V. P. sharma, S. Kumaraswamy and A. Mani,
“Exper-mental Investigations with Nozzle in a Two Phase Flow Jet Pump,” 2011.
Nomenclature
A: Cross sectional area (m2) At: Total flow area (m2)
An: Nozzle (jet) cross sectional area (m2) AMC: Mixing chamber cross sectional area (m2)
Cd: Calibration coefficient from the orifice calibration curve (−)
do: Orifice diameter (m2)
Dth: Driving nozzle exit diameter (m2) D: Tube diameter (m2)
Doi: Orifice inside diameter (m) Doo: Orifice outside diameter (m) Dmix: Mixing chamber diameter (m) H: Static suction head (m)
Hs: Suction head is the net vertical distance between the water level in the feeding water tank and the center line of the suction tubes (m)
K: Constant (−)
Ken: Friction loss coefficient, throat entrance (−)
Lth: Throat length (m)
(ṁa): Air mass flow rate (m3/s) (ṁw): Water mass flow rate (m3/s) M: Water to air mass ratio (ṁw/ṁa) (−) N: Efficiency %
Pa: The driving air pressure “pressure of the jet of air coming from the nozzle (Pa)
PUS: Up-stream pressure (Pa) PdS: Down-stream pressure (Pa) Pv: Vapor pressure (Pa) R: Area ratio (An/AMC) (−)
S: The distance between throat interface and driving noz-zle interface (m)
T: Time (Sec) T: Temperature (˚C)
Z: High of water in the upper tank (Connected to the discharge line) (m)