Original citation:
Kuwahara, Hiroyuki and Soyer, Orkun S.. (2012) Bistability in feedback circuits as a
byproduct of evolution of evolvability. Molecular Systems Biology, Vol.8 . Article no. 564..
Permanent WRAP url:
http://wrap.warwick.ac.uk/54261
Copyright and reuse:
The Warwick Research Archive Portal (WRAP) makes the work of researchers of the
University of Warwick available open access under the following conditions.
This article is made available under the Creative Commons
Attribution-NonCommercial-NoDerivs 3.0 Unported (CC BY-NC-ND 3.0) license and may be reused according to the
conditions of the license. For more details see:
http://creativecommons.org/licenses/by-nc-nd/3.0/
A note on versions:
The version presented in WRAP is the published version, or, version of record, and may
be cited as it appears here.
Bistability in feedback circuits as a byproduct
of evolution of evolvability
Hiroyuki Kuwahara1and Orkun S Soyer2,*
1 The Ray and Stephanie Lane Center for Computational Biology, School of Computer Science, Carnegie Mellon University, Pittsburgh, PA, USA and2 Systems
Biology Program, College of Engineering, Mathematics, and Physical Sciences, University of Exeter, Exeter, UK
* Corresponding author. Systems Biology Program, College of Engineering, Mathematics, and Physical Sciences, University of Exeter, Harrison Building, North Park Road, Exeter, Devon EX4 4QF, UK. Tel.:þ44 1392 263628; Fax: þ44 1392 217965; E-mail: [email protected]
Received 27.7.11; accepted 6.12.11
Noisy bistable dynamics in gene regulation can underlie stochastic switching and is demonstrated to be beneficial under fluctuating environments. It is not known, however, if fluctuating selection alone can result in bistable dynamics. Using a stochastic model of simple feedback networks, we apply fluctuating selection on gene expression and runin silicoevolutionary simulations. We find that independent of the specific nature of the environment–fitness relationship, the main outcome of fluctuating selection is the evolution of increased evolvability in the network; system parameters evolve toward a nonlinear regime where phenotypic diversity is increased and small changes in genotype cause large changes in expression level. In the presence of noise, the evolution of increased nonlinearity results in the emergence and maintenance of bistability. Our results provide the first direct evidence that bistability and stochastic switching in a gene regulatory network can emerge as a mechanism to cope with fluctuating environments. They strongly suggest that such emergence occurs as a byproduct of evolution of evolvability and exploitation of noise by evolution.
Molecular Systems Biology8: 564; published online 17 January 2012; doi:10.1038/msb.2011.98 Subject Categories: metabolic and regulatory networks; simulation and data analysis
Keywords: environmental fluctuations; gene regulatory network; noise; phenotypic variability; stochastic switching
Introduction
Organisms are able to display diverse phenotypes under a given environment. This ability is first described in higher organisms as a bet-hedging strategy (Cohen, 1966; Philippi, 1993), but is increasingly found to be common at the cellular level, where it is underlined by stochastic switching among different phenotypic states (Raoet al, 2002; Raser and O’Shea, 2005; Samoilovet al, 2006; Losick and Desplan, 2008; Lo´pez-Mauryet al, 2008; Raj and van Oudenaarden, 2008). In microbes, stochastic switching is demonstrated in several phenotypic traits including persis-tence to antibiotics (Balabanet al, 2004) and lactose metabo-lism (Novick and Weiner, 1957; Ozbudaket al, 2004; Robert et al, 2010) inEscherichia coli, sporulation (Veeninget al, 2008) and DNA uptake competence (Maamaret al, 2007) inBacillus subtilis, and galactose metabolism in yeast (Acaret al, 2005). By allowing a certain fraction of the population to display a distinct phenotype, stochastic switching can allow populations to survive environmental changes (Balaban et al, 2004; Visco et al, 2010) and adapt faster to a new environment (Blakeet al, 2006; Kashiwagiet al, 2006; Acar et al, 2008). On the other hand, the heterogeneity in the population can incur a fitness cost as some fraction of its members would always be maladaptive in a given environment. Theoretical studies have
shown that such potential fitness costs can be balanced under environmental fluctuations, resulting in a net fitness gain from stochastic switching under a range of fluctuation rates and fitness costs (Thattai and van Oudenaarden, 2004; Salathe´et al, 2009; Gaa´let al, 2010; Libermanet al, 2011). Further, switching rates can evolve to be in tune with environmental fluctuation rates so as to optimize the associated fitness tradeoffs (Kussell and Leibler, 2005; Kussell et al, 2005). In line with these theoretical findings, experimental evolution implementing different environmental fluctuation rates can be used to select for higher or lower rates of stochastic switching (Stompet al, 2008; Beaumontet al, 2009).
requires the interplay of noise and bistable dynamics in a gene regulatory network (Dubnau and Losick, 2006); bistability gives rise to two distinct states of gene expression, and noise in gene expression can then lead some cells to be tipped to one state from the other. Theoretical and experimental studies indicate that such bistable dynamics underlie the phenotypic switching seen inE. colipersister cell formation (Rotemet al, 2010) and lactose metabolism (Ozbudak et al, 2004; Robert et al, 2010),B. subtilisDNA uptake competence (Maamaret al, 2007) and sporulation (Fujitaet al, 2005), and yeast galactose metabolism (Acar et al, 2005). Further, a specific synthetic implementation of a bistable gene network inE. coliis shown to display stochastic switching, and enables an adaptive response to environmental changes (Kashiwagiet al, 2006).
Here, we analyze the molecular evolution of bistability and noise in simple gene regulatory networks incorporating feedback loops and capable of displaying bistability. Starting with parameters that result in a monostable system without feedback, we run evolutionary simulations under fluctuating environments that select for different optimal gene expression levels. We find that such fluctuating selection results in the emergence and maintenance of bistability only in presence of noise and under a limited range of environmental fluctuation rates. We show that bistability emerges due to selection for increased nonlinearity, which renders the system more evolvable and allows faster adaptation to fluctuating environ-ments. In the absence of noise, the system still evolves higher evolvability by attaining nonlinear dynamics near the bistable regime; however, the evolution of bistability is not observed. These findings suggest that bistability and consequent stochastic switching in gene regulatory networks allowing for feedback loops, evolves only in the presence of noise and as a byproduct of selection for increased evolvability.
Results
In order to study the evolution of molecular mechanisms underpinning stochastic switching in microbes, we first
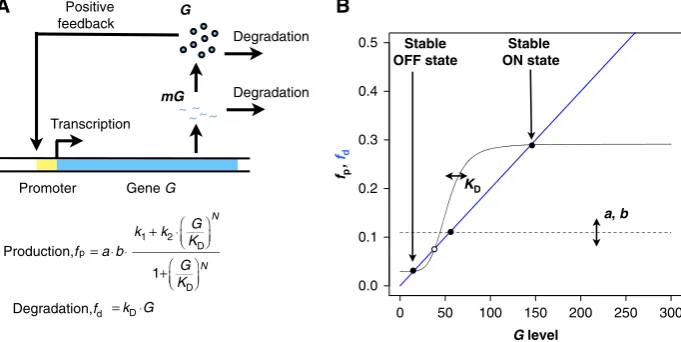
develop a model of the simplest genetic regulatory network that can display bistability (see Materials and methods). In this system, a single geneGregulates its own expression by acting as a transcription factor binding to its own cis-regulatory module (Figure 1A). As experimentally shown (Becskeiet al, 2001; Isaacset al, 2003; Kaufmannet al, 2007), the resulting nonlinearity from such feedback regulation can exhibit bistability, that is, two distinct and stable states of expression levels separated by an unstable state acting as a threshold (Figure 1B, open circle). Noise in gene expression can then result in protein levels stochastically reaching above the threshold of the bistable system. When this happens, the feedback regulation ensures that protein levels converge to a high value (the ON state). In contrast, when protein levels drop below threshold, protein levels can converge to a low value (OFF state). Under the right conditions, in particular when the expression level in the OFF state is close to the threshold, noise-enabled stochastic switching could maintain a hetero-geneous population of cells in the ON and OFF states. This would translate to phenotypic diversity when these two states correspond to distinct phenotypes (e.g., geneGencodes for a master transcription regulator controlling downstream genes). To explore the evolution of stochastic switching and bistability under fluctuating environments, we evolve an asexual population of virtual unicellular organisms, each embedding a stochastic model of the system (stochastic phenotype from now on) shown in Figure 1 (see Materials and methods). To understand the role of noise in the evolution of bistability, we also run evolutionary simulations where cells implement a deterministic version of this model (deterministic phenotypefrom now on). In each case, the parameters of the system that are subject to mutation area, the scaling factor for the rate of transcription, b, the average number of proteins produced per transcript (i.e., the average size of protein bursts),N, the parameter controlling the strength of the auto-regulatory feedback and KD, the parameter controlling the
threshold level of the dynamics resulting from this feedback. Changes in these parameters are biologically plausible and can result from point mutations in promoter regions and/or
Gene G
G
Transcription Positive feedback
Stable OFF state
Stable ON state
Promoter
Production,fp = a b k1 + k2
G KD
N
1+ G KD N
=kDG
Degradation
Degradation,fd
~ ~ ~ ~~
mG Degradation
0 50 100 150 200 250 300
0.0 0.1 0.2 0.3 0.4 0.5
G level
a, b KD
fp
,
fd
[image:3.595.130.471.522.693.2]A B
transcription factors regulating gene expression (Blakeet al, 2006; Murphyet al, 2007). Fitness of individuals is determined according to the environment. For our main simulations, we consider a binary relationship between environment and fitness, where either low (in low environment,Elow) or high (in high environment,Ehigh) level of expression results in optimal
fitness (see Equation 6). This scenario could arise wheneverG encodes a protein that conveys high fitness in a certain environment, but whose activity is detrimental or highly costly in another. In additional simulations, discussed below, we also consider variations on the modeling of the simple feedback network, an alternative feedback circuit and alternative environment–fitness couplings. In the main simulations, we consider that the environment switches stochastically at a certain probabilityvper generation. At the start of the simu-lation, the population is homogenous with initial system parameters set to give a monostable system that lacks the auto-regulatory feedback loop (see Materials and methods).
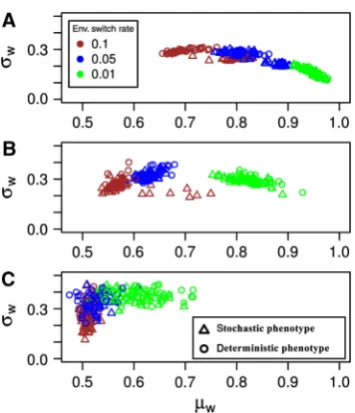
Under all the environmental fluctuation rates we consider, we find that evolution leads to significant improvements over the initial fitness and results both in an increase in the mean of population fitness averaged over 5000 generations,mwand a
decrease in its variance,sw (Figure 2). The extent of these fitness improvements depends closely on the mutation rate and the rate of environmental fluctuations. Interestingly, the presence of noise (i.e., stochastic versus deterministic pheno-types) only improves fitness under intermediate ranges of environmental fluctuation rates with the exact range depending also on the mutation rate. To better understand this general trend in the improvement of fitness and its molecular basis, we quantify steady-state system behavior, resulting from the mean parameter values from the individual
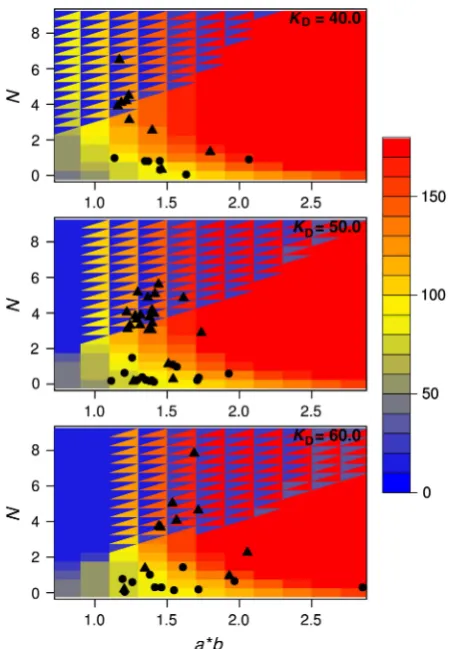
evolved populations (see Equation 5). Summarized in Figure 3 and Supplementary Figure S1, this analysis suggest evolution of three different strategies under three representative fluctua-tion rates (slow, intermediate and fast). Under slowly switch-ing environments (v¼0.001), the system evolves monostable dynamics with steady-state level ofGbeing either very high or very low (Supplementary Figure S1C). This is because the system spends a relatively long time in eitherEhighorElowand behaves as if it is under stable selection to adapt to one of these environments. When environments fluctuate very fast (v¼0.5), the period of selection underEhighorElowis so short
that the best strategy seems to be to set G at a level that corresponds to a reasonable fitness value in both environ-ments. For the particular fitness function used in the simulations shown in Figure 3, this corresponds to G¼50 (see Equation 6) and all simulations have evolved parameters that gave a steady-state value close to this (Supplementary Figure S1A). These two strategies that evolved for dealing with slow and fast environmental fluctuations are interestingly independent of the presence or absence of noise in the system. In other words, evolution under these environmental fluctua-tion rates neither exploited nor was affected by noise.
Under intermediary fluctuation rates (v¼0.05) system parameters mostly evolved to values that resulted in an intermediary level of G, especially in those simulations that resulted in high fitness (Figure 3 and Supplementary Figure S1B). In the hypothetical fluctuation-free deterministic phe-notype, this seems to be achieved by system dynamics that is underpinned by a non-zero N and that places steady-state expression on a ridge in the phase plane that is roughly equidistant to both low and high levels ofG(black circles in Figure 3). Simulations with the stochastic phenotype took this approach of ‘being at the edge’ one step further and have predominantly evolved system parameters resulting in bist-ability (black triangles in Figure 3). It is important to note that in both simulations with the deterministic and stochastic phenotypes, simulations resulting in the highest fitness values (blue outliers in Figure 2A) have evolved non-zeroN corresponding to nonlinearity in protein production (Supple-mentary Figure S1B). In the stochastic case, this nonlinearity was more pronounced and resulted in bistability.
While suggestive, these analyses based on the population average of systems parameters over generations might give misleading conclusions about systems dynamics of genotypes in each generation. Further, they do not provide detailed insight on the evolutionary dynamics, raising the question about why these simulations resulted in the evolution of nonlinearity and bistability in gene expression dynamics. A possible explanation comes from considering the selection process under such intermediary fluctuation rates. Cells experience long enough selection periods underEhighandElow but also frequent environmental change, such that they need to be capable of quickly shifting their steady-state expression level. In the absence of signaling and other feedback mecha-nisms, such as those seen spatial epigenetic control (Kelemen et al, 2010), this can only be achieved through muta-tions. Thus, cells evolving under intermediary rates of environmental fluctuations are under selection for achieving abrupt changes in expression levels as fast as possible, that is, with fewest number of mutations. Such ability of a system
[image:4.595.79.257.74.281.2]to maximize its rate of adaptation either by decreasing number of mutations needed for adaptation or by increasing their beneficial effects is broadly referred to as evolvability (Wagner and Altenberg, 1996). Thus, we can hypothesize that the seeming evolution of nonlinearity in the dynamics of the system depicted in Figure 1 confers on it an increased evolvability.
To test this hypothesis and gain a better insight on the evolutionary dynamics, we run additional simulations under a deterministically switching environment and monitored evolvability and the distribution of parameters over indi-viduals in the population. We concentrated this analysis on the intermediary environmental fluctuation rates, where stochastic and deterministic phenotypes gave different results (v¼0.05), and run simulations with an environmental epoch duration of 20 generations. We defined evolvability as the ratio
of the normalized fitness change (i.e., adaptation) over the sum of relative changes in parameters (i.e., genetic shift) (see Materials and methods and Equation 8). We also considered an alternative approach and quantified adaptation time as a proxy for evolvability (see Materials and methods).
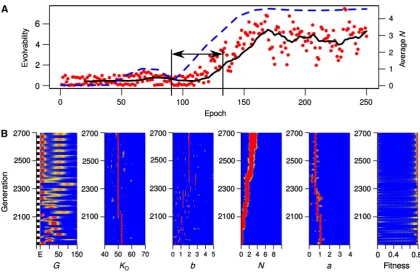
In line with the analysis of average parameter values, these simulations showed evolution of larger values of Nboth in simulations with deterministic and stochastic phenotypes. Interestingly, we found that such evolution of higher values of Nare associated with an increase in evolvability (Figure 4A; Supplementary Figure S2) and a decrease in adaptation time (Supplementary Figures S3A and S4). Importantly, this effect is visible in simulations with the stochastic phenotype well before the emergence of bistability (Figure 4). These findings suggest that evolution of higherNis selected for its ability to confer higher evolvability (i.e., faster adaptation) in environ-ments with intermediary fluctuation rates. To further support this finding, we run additional simulations with fixedN. We found that increasing values ofNallow populations to adapt faster to environmental fluctuations (Figure 5; Supplementary Figure S5). Importantly, this trend is mostly independent of the presence or absence of noise and is visible before the bistable regime, indicating that it is mainly the increasing nonlinearity in system dynamics that confers a higher evolvability to the system.
To better understand how higherNis linked to an increase in evolvability, we performed a systematic study of phenotypic effects of mutations in other parameters under different values of N. This analysis revealed that increasingN results in an increase in the diversity of gene expression level, and in the phenotypic effects of mutations ina,bandKD(Figure 6). The latter effect was also evident in systems encoded by the average parameters obtained from our original simulations. These display significant phenotypic shift with as few as two mutations (Supplementary Figure S6). We note that the relation of increasingNand increasing mutational effects is a direct result of howN changes the shape of the production curvefp(e.g., see Supplementary Figure S1). The former effect
of increasing diversity with increasingNcan be understood in light of a positive correlation between noise and nonlinearity that is also shown to exist in certain signaling motifs (Shibata and Fujimoto, 2005). To better understand how increasing noise results from increasing N in the feedback circuit, we derived an analytical expression for the protein level (see Supplementary information). This showed that, up until bistability emerges, increasing N (while keeping all other parameters of the model fixed) does not strongly affect the peak of the steady-state distribution of the protein levels, but results in a widening of it (Supplementary Figure S7A). Thus, increasing N results in higher noise level (Supplementary Figure S7B), while the mean protein level remains mostly unaltered. Exploiting this uncoupling between the effects ofN on noise and on the mean protein level, we then asked if solely the increase in noise can provide a fitness advantage in either of the two environments. Fixing all other parameters of the model, we calculated the fitness of the resulting genetic system in both environments for increasing levels of noise through an increase inN(see Supplementary information). We found that increasing noise levels, while the mean protein level remains mostly unchanged, is beneficial under the fitness scheme
[image:5.595.58.283.76.401.2]given in Equation (6) and in the ‘low’ (‘high’) environment when mean protein levels are below (above) 50 (Supplemen-tary Figure S8). This result also extends to an alternative scheme for coupling fitness and protein levels (see below and Supplementary Figure S16). Taken together, these results indicate that increasingN (and thus noise) is beneficial for adaptation when mean protein levels are far from optimal.
This finding is in line with previous findings, which showed a beneficial effect of noise under a convex fitness function (Zhanget al, 2009).
[image:6.595.84.505.75.347.2]These analyses strongly suggest that increasingNis selected for in our simulations, due to its positive fitness effects that arise from an increased noise (i.e., increased heterogeneity in the population) and increased effects of mutations. We have observed both of these effects in the evolutionary simulations with stochastic and deterministic phenotypes (Figure 4B; Supplementary Figure S3B). First, we find that as large values ofNevolve, adaptation to a new environment occurs very fast and with few mutations (Figure 4B, generations 2100–2160). Furthermore, simulations with the deterministic phenotype show a clear pattern of increased phenotypic movement with mutations after the evolution of larger N; while expression level of Gstays close to 50 and shifting slightly above and below it with every environmental epoch, it moves to more extreme values (achieving higher fitness) after the evolution of largerN(Supplementary Figure S3B, generations 0–300 versus generations 400–1000). Second, asNevolves to larger values, we observe a general increase in the phenotypic diversity in the population (Figure 4B, generations before versus after generation 2100). This increase in diversity adds on top of that resulting from the mutational diversity around the wild type (i.e., quasi species), which is evident in both the runs with the stochastic and deterministic phenotypes and is mainly driven by changes in the parameterb(e.g., see corresponding panels
Figure 4 (A) Evolvability and population mean ofNover environmental epochs for a sample simulation with stochastic phenotype and implementing deterministic environmental fluctuations. The environment switches every 20 generations and mutation rate is set to 0.01. Evolvability is defined as the ratio of the normalized fitness change (i.e., adaptation) over the sum of relative changes in parameters (i.e., genetic shift). The red points show the actual evolvability data, calculated for each epoch, while the black line gives its moving average over epochs. The blue dotted line gives population average ofNover epochs. (B) The distribution of individual parameters, fitness and expression level ofGover the population and over generations. Each row on each panel encodes a distribution for a specific quantity (as indicated at the bottom of the panel) and for the specific generation shown on theyaxis. The distributions are shown as a heat map ranging from red (highest density) to blue (lowest density). EnvironmentsElowandEhighare indicated as black and white bars on theyaxis of the left-most panel.
Figure 5 Boxplots showing a summary of the distribution of evolvability from 10 simulation runs for each fixed value ofNas shown on thexaxis. Note that at
[image:6.595.49.287.442.548.2]in Figure 4B and Supplementary Figure S3B). We note, however, that mutational diversity in all parameters is lost in the stochastic phenotype after the emergence of bistability. This is because bistability mostly alleviates the need for diversity by resulting in stochastic switching; two distinct phenotypes expressed from the same genotype (see Figure 4B, generations42400). Subsequent mutations can then tune the noise level and the size of basins of attractions in the bistable system to achieve maximal fitness and minimal adaptation time. The former process can be seen to a certain extent in Figure 4B.
While we observed evolution of largerNin all simulations under intermediary rates of environmental fluctuations, we also observed—mainly in simulations with the deterministic phenotype—that a large value ofNcan also be lost again after its emergence (Supplementary Figures S2 and S4). Such loss of nonlinearity could be explained by the fact that in the deterministic phenotype, the effect of increasingNis limited to only a change of phenotypic effects of mutations in other parameters, and that mutations inNthemselves also change
[image:7.595.56.547.78.390.2]the expression level of Geven slightly. In particular, every time the environment switches so to favor lowerG, mutations that decreaseNcan increase in frequency. In contrast, in the stochastic phenotype, the associated phenotypic diversity with higherNensures that the population can move to a lowerG level without necessarily drifting out of the nonlinear regime. In addition, the presence of noise in the stochastic phenotype results in a positive fitness effect (Supplementary Figure S8), and potentially reduces the efficiency of selection (Wang and Zhang, 2011). Both effects would allow easier maintenance of larger values ofN in the stochastic phenotype model, even under long stretches of stable environments. In other words, increased diversity provides a type of robustness against mutations that decreaseN. Eventually, further mutations can lead N to reach above a certain threshold and result in the emergence of bistability. This results in stochastic switching and provides the system with the perfect solution to the particular fluctuating environment we implement. Such high fitness associated with the stochastic switching ‘strategy’ under the fluctuating environment then ensures stable
Figure 6 Analysis of mutational effects of parameters on the phenotype (i.e., level of proteinG) in genotypes with increasing value ofN. This analysis shows that asN
maintenance of largeNand bistable dynamics. In line with this view, we find that in evolutionary simulations starting with an initially large value ofN, bistability is maintained under a broad range of environmental fluctuation and mutation rates (Supplementary Figure S9).
In summary, these findings strongly indicate that the fitness benefit of having a largerN (i.e., nonlinearfp) comes from
an increased evolvability, rather than from noise-enabled stochastic switching per se. Such a key role for selection for higher evolvability under intermediate fluctuation rates could also explain the general trend we observe in Figure 2 with regards to fitness difference between simulations with stochastic and deterministic phenotypes. The fitness differ-ence between these simulations is significant only when the best strategy to cope with the environmental fluctuation is to evolve a nonlinear fp, in which case simulations with the
stochastic phenotype can achieve higher fitness by evolving bistability. As can be seen from Figure 2, this situation arises not only for a specific range of environmental fluctuation rates but rather for a specific combination of mutation rate and environmental fluctuation rate. This is in line with the previous findings on the evolution of evolvability (Meyers et al, 2005; Stompet al, 2008; Tsuda and Kawata, 2010), and is a manifestation of the fact that selection for higher evolvability only becomes significant when generation of mutations and their time to fixation are in line with the duration of selection under a specific environment. Population genetic models of simple systems suggest that both higher mutation rate and higher rates of fluctuating selection can decrease the time to fixation of beneficial and neutral mutants (Ota and Kimura, 1972; Kimura, 1980), thus potentially allowing for selection of systems that can generate more of these types of mutations (Tsuda and Kawata, 2010). In our simulations, and in nature, these effects of mutation rate and fluctuating selection have to be in balance for the evolution of evolvability as suggested before (Meyerset al, 2005).
How general are these findings? In particular, could selection for incremental increase in N operate in other feedback circuits, under different modeling choices or under other environment–fitness relationships? To address this question, we run several additional simulations. First, we confirmed the robustness of the above results for a variety of alternative modeling choices in our original feedback model. We found that higher N and consequently higher evolvability evolves when we allow all of the model parameters to evolve, when feedback is modeled with an alternative form to that given in Equation (1), and finally when we consider a coupling between gene expression dynamics and growth (see Supple-mentary information and SuppleSupple-mentary Figure S10). Of these alternative modeling choices, the last one is particularly interesting as both protein and mRNA levels in bacteria are found to relate to growth rate in intricate ways (Klumppet al, 2009). While such a coupling can itself lead to bistable gene expression when a constitutively expressed gene has a direct effect on growth rate (Klumppet al, 2009), our simulations indicate that it might not have a bearing on the evolution of higher nonlinearity in a feedback-based gene regulatory system under fluctuating environments. It can be envisioned, however, that a constitutively expressed gene that alters growth under certain environments could act as the precursor
to the feedback motif we consider here, by providing a primary increase in heterogeneity (and thus potentially in evolvability).
Second, we run additional simulations with a model that captures another commonly observed gene regulatory motif; the double negative feedback loop. This regulatory motif is well studied in the l phage, where it underlies the lysis-lysogeny decision (Ptashne, 2004), and an engineered version of it is experimentally shown to display bistability in bacteria (Gardneret al, 2000). We developed a mathematical model of this system using the same approach as in the original model (see Supplementary information and Supplementary Figure S11A). Using this double negative feedback model, we run five evolutionary simulations for 5000 generations under a deterministically switching environment switching every 20 generations (same conditions as above). All of these simulations resulted in the evolution of bistability under-pinned by higher values ofNin the two feedback loops. In all these simulations, we confirmed the positive relation between nonlinearity and evolvability (Supplementary Figure S11B and C). This suggests that this positive relation could be a generic feature in a diverse set of gene regulatory motifs that involve feedback loops.
Finally, we considered alternative fitness–environment couplings and run simulations with the simple feedback model. We first relaxed the assumption of a highly nonlinear relation between the level of G and fitness. Using a more linear relationship (Hill coefficient in Equation (6) set to 2), we found that the main results remain unaltered (Supplementary Figure S12). Next, we relaxed the assumption of a sigmoidal fitness relation altogether and considered that fitness is given by a normal distribution, where the optimal fitness in a given environment corresponds to a specific level ofGand where any deviations from this level are detrimental to fitness (Equation 7). Under such an environment–fitness relation-ship, we assumed that evolutionary fluctuations correspond to changes in the optimal level ofG(i.e., the mean of the normal distribution). Biologically, this scenario might be more broadly applicable and simply assumes that each of the different environments an organism encounters requires a different optimal level ofG. Within this scenario we considered two types of environmental fluctuations: (i) environments fluctu-ating between two specific optimal mean values (high and low) and (ii) environments fluctuating randomly between optimal mean values in a wide range.
G. When the normal distribution of fitness has a wider variance, this detrimental effect of noise and consequently the difference between the fitness resulting from stochastic and deterministic phenotypes is reduced (Supplementary Figure S13). Under the environment–fitness relationship given by Equation (7), the evolution of bistability is much more limited and is only observed in few cases under the scenario where environment fluctuates between two specific optimal values of G(Supplementary Figure S14).
Both sets of results are in line with the above-described relation of noise, N and fitness. In our model, increasing Nresults in an increase in noise (Supplementary Figure S7), which then can have a positive effect on noise under a convex fitness function (Supplementary Figure S8). While reducing the Hill coefficient in Equation (6) does not alter these dynamics significantly, using a normal distribution for fitness (as in Equation 7) results in a fitness function that is concave near optima. This limits the positive fitness effects of increasing noise (see Supplementary Figure S16). While the effect of increasingNon other mutations is maintained, this can limit the evolution ofNto high values and emergence of bistability as observed in the simulations. Taken together, these results suggest that evolution of increased evolvability (through evolution of nonlinear system dynamics), but not the evolution of bistability, might occur under broad fitness– environment relationships.
Discussion
This analysis shows that the main and broadly applicable effect of fluctuating selection on the evolution of gene regulatory networks that allow for a feedback loop is selection for specific system dynamics that confer an increased evolvability. Increased evolvability mainly results from evolu-tion of system parameters controlling the feedback loop, into a nonlinear regime, where both phenotypic diversity and the amount of phenotypic shift caused by individual mutations are increased. We find that under a specific but biologically plausible form of fluctuating environment, selection for having system parameters in such a nonlinear regime results in the emergence of bistability and the associated stochastic switching. Under a switch-like environment, bistability offers immediate adaptation by allowing expression of two distinct phenotypes from the same genotype and offers additional ‘points of operation’ for evolution, such as the size of basins of attractions for the steady states.
Under the evolutionary scenario considered here and in the gene regulatory motifs involving a feedback loop, the beneficial effects of bistability are realized only under specific environment–fitness relationships and in the presence of noise. Consequently, we find that noise is a necessary but not sufficient condition for the evolution of bistability through fluctuating selection under these conditions. Once bistability arises, noise-induced stochastic switching can give rise to additional fitness benefits, such as survival under advert conditions (Balaban et al, 2004). Furthermore, the rate of switching can be tuned to environmental fluctuation rates (Kussell and Leibler, 2005) via changes altering system dynamics and/or noise level (Ribeiro, 2008). Noise is an
inevitable feature of cellular systems (Lestaset al, 2010) and could itself be under positive or negative selection (van Hoek and Hogeweg, 2007; Ta˘nase-Nicola and ten Wolde, 2008; Zhang et al, 2009; Wang and Zhang, 2011). Thus, other selective forces that lead to higher/lower noise might also enhance/inhibit the evolution of bistability and nonlinearity in gene regulation as indicated for example in the lactose metabolism ofE. coli(van Hoek and Hogeweg, 2007).
We find that for the gene regulatory networks considered here, evolution of both evolvability and bistability are limited to a specific combination of mutation and environmental fluctuation rates. This is in line with other observations reporting the evolution of higher evolvability (Meyerset al, 2005; Stompet al, 2008; Tsuda and Kawata, 2010) and indi-cates a need for a balance between environmental fluctuation rate and mutation rate so that the latter can lead to a selection for higher evolvability (Meyerset al, 2005). In our simulations, evolvability leads to the emergence of bistability in the gene regulatory network and interestingly, we find this bistability to be maintained in subsequent evolution under a broader range of environmental fluctuation and mutation rates (Supplemen-tary Figure S9). These findings do not contradict earlier studies, demonstrating a fitness benefit for stochastic switch-ing under a wide range of environmental fluctuation rates (Thattai and van Oudenaarden, 2004; Kussell and Leibler, 2005; Kussellet al, 2005; Salathe´et al, 2009; Gaa´let al, 2010; Viscoet al, 2010; Libermanet al, 2011), but show that those results cannot be interpreted as fluctuating selection to be a general mechanism for leading to molecular evolution of stochastic switching.
Materials and methods
Single gene positive-feedback loop model
In order to capture the underlying stochasticity of gene regulation, we constructed a positive-feedback model using the stochastic chemical kinetic framework (Gillespie, 2007). The model describes the regula-tion of a geneGby its own protein productG. In particular, we consider thatGcan positively regulate the transcription ofGby binding to its
cis-regulatory module. This type of regulation is common in biology and a synthetic implementation of it has experimentally verified its potential for achieving bistability so to give rise to two distinct steady-state levels of protein amount (Becskeiet al, 2001; Isaacset al, 2003). The model consists of two species corresponding to the protein (G) and mRNA (mG) and four reaction processes: transcription, translation, mRNA degradation and protein degradation (Figure 1A). One molecule ofmG is synthesized from Gvia the transcription reaction whose propensity is given by:
r1ðmG;GÞ ¼a
k1þk2 ðG=KDÞN
1þ ðG=KDÞN
!
ð1Þ
where the parametersk1andk2are arbitrarily set to 0.02 and 0.2, respectively, while parametersa,KDandNare free to evolve. This production function is based on the equilibrium statistical thermo-dynamic model of transcriptional regulation (Ackers et al, 1982), which is used frequently for modeling the dynamics of gene expression processes. This approach represents transcription dynamics based on the probabilities of the configuration of the promoter and operator sites in thermodynamic equilibrium. In the Supplementary informa-tion, we consider an alternative model that uses the Hill function as the production term.
One molecule ofGis synthesized usingmGas a template through the translation reaction while one molecule ofmGis removed through the mRNA degradation reaction. The propensity functions of these reactions are, respectively, given by:
r2ðmG;GÞ ¼k3mG ð2Þ
r3ðmG;GÞ ¼k4mG ð3Þ
where the parameterk4is set to 0.1 and parameterk3is free to evolve. At the start of evolutionary simulations, we setk3¼0.1 resulting in
b¼k3/k4¼1, which indicates that on average one copy of protein will be synthesized per transcript. The other reaction process in our model is the protein degradation where one molecule ofGis removed from the system. The propensity function of this reaction is given by:
r4ðmG;GÞ ¼k5G ð4Þ
where the parameter k5 is set to 0.002. See also Supplementary information for an alternative implementation of these parameters, considering their coupling to growth rate (i.e., fitness), and also for simulations that allow all of the parameters to evolve.
In the continuous-deterministic framework, setting all the kinetic law functions to zero allows us to solve for the steady-state values of
mGand G. In particular, using the G* notation for the steady-state value ofG, we can derive the following relation at steady state:
ba k1þk2 ðG =K
DÞN
1þ ðG=K
DÞN
!
¼k1G ð5Þ
where the left and right sides denote the production (fp) and degradation (fd) functions forG, respectively. This reveals that, with an appropriately high value ofN(i.e., a high-binding cooperativity ofG
to the promoter of the geneG), we can have three distinct and unique steady-state values forG, making the system bistable (Figure 1B).
Evolutionary simulations
We consider a population of 1000 cells, each of which contains the positive-feedback genetic circuit described above. The evolutionary
simulations start with a homogenous population with initial para-meters set toa¼1.0,b¼1,KD¼50 andN¼0. Note that this results in a monostable system that is lacking feedback regulation (Figure 1B). We simulated the population in a fluctuating environment for 10 000 generations. The initial values ofmGandGat the first generation are both set to zero. For each generation, the stochastic models are simulated using the direct method implementation of Gillespie’s stochastic simulation algorithm (Gillespie, 1977) for 2000 time units. In the deterministic case of the model, we iterate functionsfpandfdto update the amount ofGto calculate the steady-state level for each generation. We assume that the system reached steady state when the difference between fp and fd becomes less than 1/(k5c), where
c¼5105. At the beginning of each succeeding generation, the values ofmGandGare reduced to the largest integers that are smaller than
mG/2 andG/2, respectively, to model cell division. We have also considered the case of relating fitness to concentration, in which case we run simulations without the cell division step described above (as concentrations can be considered to remain constant during cell division). These simulations resulted in qualitatively the same results as described in the main text (see Supplementary Figures S17 and S18). At the end of each generation, a new population is produced from the current one using random drawing with replacement. A random individual is picked from the population and is cloned into the new population if a uniformly distributed random number (from the interval [0,1]) is below its normalized fitness. Then, it is put back into the current population and a new draw is made, the process continued until the new population contains 1000 individuals. During cell replication, mutations happen at a rateu, and are modeled as small perturbations to either one of the parametersa,k3,KDandN(with equal probability). Note that mutatingk3is equivalent to mutating the burst size,b. Mutations ofa,bandKDare captured by adding A(0, 0.22), A(0, 1.02) and A(0, 5.02), respectively, where A(m, s2) is a normal random variable with meanmand s.d.s. Note that we imposed the condition that the values ofa,bandKDbe at least 0.01, 0.01 and 1020, respectively. The mutation ofNis captured by adding 0.5 or
0.5 at the equal probability, where the value ofNis set to beX0. See also Supplementary information for alternative simulations that allow all of the model parameters to evolve.
Fitness is determined as a function of the environment and the amount ofGat the end of each generation. For the main simulations, we consider two environments, where either a low (Elow) or high (Ehigh) level of the protein is beneficial. The simulations start inEhigh and subsequently the environment changes in each generation with a probabilityv. The fitness under the two environments is given by functionswhighandwlow:
whigh¼
ðGt¼2000=50Þ5
1þ ðGt¼2000=50Þ5
wlow¼1whigh
ð6Þ
whereGt¼2000corresponds to the amount ofGin the cell at the end of one generation. Note that Equation (6) assumes a symmetric fitness in the two environments in relation to the level of G, and assumes that the costs of producingGare negligible. Based on previous studies, we expect that such a cost, or more broadly, having an asymmetric fitness for the two environments would reduce selection for bistability and stochastic switching as indicated previously (Salathe´et al, 2009).
In additional simulations, we considered alternative scenarios for environmental fluctuations and environment–fitness relations. For these simulations, fitness was given by;
w¼exp ðGt¼2000xÞ
2
2s2
!
ð7Þ
(x¼20) and ‘high’ (x¼80) environment and (ii)xchanges randomly in the interval [0,120].
All evolutionary simulations are coded in the C language. The source code for simulations that implement the single feedback loop model with all its parameters defined as evolvable and deterministic environmental switching are made available as Supplementary information. Source code of the remaining simulations, as described in the main text and the Supplementary information, can be derived from the provided code or could be obtained from the authors upon request.
Measuring evolvability
For the evolutionary simulations with a deterministically switching environment, we quantified the evolvability of a population adapting to a fluctuating environment as the ratio of the normalized fitness change over the sum of relative changes in parameters. This measure is similar to the control coefficient used in the analysis of metabolic networks (Heinrich and Schuster, 1996). The control coefficient gives the logarithmic sensitivity as the relative change of a system variable (e.g., flux) in response to a relative change in a rate. Similarly, we define evolvability as the sensitivity of the systems’ fitness, and measure it as a relative change of the average fitness arising from relative mutational shifting of the parameters over a given epoch (i.e., time window). We define relative change in fitness with respect to final rather than initial fitness, so to avoid relative change in fitness to become artificially sensitive to a small value of the initial fitness, and to account for the experimentally observed saturation in fitness as it approaches higher values (Schoustraet al, 2009; MacLeanet al, 2010). Thus, evolvability is given as;
evolvability¼ ðwnsþdwnsÞ wnsþd e2þ
ffiffiffiffiffiffiffiffiffiffiffiffiffiffiffiffiffiffiffiffiffiffiffiffiffiffiffiffiffiffiffiffi P
p
pnsþdpns
pnsþe1
2
r ð8Þ
wherewnandpnare the average of the fitness and evolvable
para-meterpover the population at generationn, respectively.nsindicates the first generation following an environmental switch, whiledis the number of generations between the first and last generation in an environmental epoch in the evolutionary simulations with a determi-nistically switching environment (i.e.,d¼19 when epoch length is 20). We use the small correcting factors e1¼1010and e2¼1, to avoid division by zero. In Equation (8), the nominator gives the gain in the average fitness in a given epoch scaled by the average fitness of the last generation in that epoch (i.e., the extent of adaptation), while the denominator expresses the relative change in evolvable parameters during that same epoch (i.e., the extent of genetic change).
As an alternative measure for evolvability, we have also monitored adaptation time defined as the number of generations it takes for the mean fitness to reach 80% of the maximum possible following an environmental switching event.
Supplementary information
Supplementary information is available at the Molecular Systems Biologywebsite (www.nature.com/msb).
Acknowledgements
We thank Nicolas Buchler, Marcel Salathe´, Juan Poyatos, Raul Guantes and Peter Ashwin for comments. OSS acknowledges support of Exeter University Science Strategy. HK was supported by Lane fellowship through the Ray and Stephanie Lane Center for Computational Biology at Carnegie Mellon University.
Author contributions:OSS and HK together conceived the research, developed the tools, run simulations, analyzed the data and wrote the manuscript.
Conflict of interest
The authors declare that they have no conflict of interest.
References
Acar M, Becskei A, van Oudenaarden A (2005) Enhancement of cellular memory by reducing stochastic transitions.Nature435:228–232 Acar M, Mettetal JT, van Oudenaarden A (2008) Stochastic switching
as a survival strategy in fluctuating environments.Nat Genet40:
471–475
Ackers GK, Johnson AD, Shea MA (1982) Quantitative model for gene regulation by lambda phage repressor.Proc Natl Acad Sci USA
79:4
Aharoni A, Gaidukov L, Khersonsky O, McQ Gould S, Roodveldt C, Tawfik DS (2005) The ‘evolvability’ of promiscuous protein functions.Nat Genet37:73–76
Balaban NQ, Merrin J, Chait R, Kowalik L, Leibler S (2004) Bacterial persistence as a phenotypic switch.Science305:1622
Beaumont HJ, Gallie J, Kost C, Ferguson GC, Rainey PB (2009) Experimental evolution of bet hedging.Nature462:90–93 Becskei A, Se´raphin B, Serrano L (2001) Positive feedback in
eukaryotic gene networks: cell differentiation by graded to binary response conversion.EMBO J20:2528–2535
Blake WJ, Bala´zsi G, Kohanski MA, Isaacs FJ, Isaacs FJ, Murphy KF, Kuang Y, Cantor CR, Walt DR, Collins JJ (2006) Phenotypic conse-quences of promoter-mediated transcriptional noise.Mol Cell24:
853–865
Burch CL, Chao L (2000) Evolvability of an RNA virus is determined by its mutational neighbourhood.Nature406:625–628
Cohen D (1966) Optimizing reproduction in a randomly varying environment.J Theor Biol12:119–129
Crombach A, Hogeweg P (2008) Evolution of evolvability in gene regulatory networks.PLoS Comput Biol4:e1000112
Dubnau D, Losick R (2006) Bistability in bacteria.Mol Microbiol61:
564–572
Fujita M, Gonza´lez-Pastor JE, Losick R (2005) High- and low-threshold genes in the Spo0A regulon of Bacillus subtilis.J Bacteriol187:
1357–1368
Gaa´l B, Pitchford JW, Wood JA (2010) Exact results for the evolution of stochastic switching in variable asymmetric environments.
Genetics184:4
Gardner TS, Cantor CR, Collins JJ (2000) Construction of a genetic toggle switch inEscherichia coli.Nature403:6767
Gillespie DT (1977) Exact stochastic simulation of coupled chemical reactions.J Phys Chem81:2340–2361
Gillespie DT (2007) Stochastic simulation of chemical kinetics.Annu Rev Phys Chem58:35–55
Heinrich R, Schuster S (1996)The Regulation of Cellular Systems. USA: Springer
Isaacs FJ, Hasty J, Cantor CR, Collins JJ (2003) Prediction and measurement of an autoregulatory genetic module.Proc Natl Acad Sci USA100:7714–7719
Kashiwagi A, Urabe I, Kaneko K, Yomo T (2006) Adaptive response of a gene network to environmental changes by fitness-induced attractor selection.PLoS One1:e49
Kaufmann BB, Yang Q, Mettetal JT, van Oudenaarden A (2007) Heritable stochastic switching revealed by single-cell genealogy.
PLoS Biol5:e239
Kelemen JZ, Ratna P, Scherrer S, Becskei A (2010) Spatial epigenetic control of mono- and bistable gene expression. PLoS Biol 8:
e1000332
Kimura M (1980) Average time until fixation of a mutant allele in a finite population under continued mutation pressure: studies by analytical, numerical, and pseudo-sampling methods. Proc Natl Acad Sci USA77:522–526
Klumpp S, Zhongge Z, Hwa T (2009) Growth rate-dependent global effects on gene expression in bacteria.Cell139:7
Kussell E, Kishony R, Balaban NQ, Leibler S (2005) Bacterial persistence: a model of survival in changing environments.
Genetics169:1807–1814
Landry CR, Lemos B, Rifkin SA, Dickinson WJ, Hartl DL (2007) Genetic properties influencing the evolvability of gene expression.Science
317:118–121
Lestas I, Vinnicombe G, Paulsson J (2010) Fundamental limits on the suppression of molecular fluctuations.Nature467:174–178 Liberman U, Cleve JV, Feldman MW (2011) On the evolution of
mutation in changing environments: recombination and phenotypic switching.Genetics187:3
Lo´pez-Maury L, Marguerat S, Ba¨hler J (2008) Tuning gene expression to changing environments: from rapid responses to evolutionary adaptation.Nat Rev Genet9:583–593
Losick R, Desplan C (2008) Stochasticity and cell fate.Science320:
65–68
Maamar H, Raj A, Dubnau D (2007) Noise in gene expression deter-mines cell fate in Bacillus subtilis.Science317:526–529
MacLean RC, Perron GG, Gardner A (2010) Diminishing returns from beneficial mutations and pervasive Epistasis shape the fitness landscape for Rifampicin resistance in Pseudomonas Aeruginosa.
Genetics186:4
Meyers LA, Ancel FD, Lachmann M (2005) Evolution of genetic potential.PLoS Comput Biol1:236–243
Murphy KF, Bala´zsi G, Collins JJ (2007) Combinatorial promoter design for engineering noisy gene expression.Proc Natl Acad Sci USA104:12726–12731
Novick A, Weiner M (1957) Enzyme induction as an all-or-none phenomenon.Proc Natl Acad Sci USA43:553–566
Ota T, Kimura M (1972) Fixation time of overdominant alleles influenced by random fluctuation of selection intensity.Genet Res20:1–7 Ozbudak EM, Thattai M, Lim HN, Shraiman BI, van Oudenaarden A
(2004) Multistability in the lactose utilization network of Escherichia coli.Nature427:737–740
Parter M, Kashtan N, Alon U (2008) Facilitated variation: how evolution learns from past environments to generalize to new environments.PLoS Comput Biol4:e1000206
Philippi T (1993) Bet-hedging germination of desert annuals: variation among populations and maternal effects in Lepidium lasiocarpum.
Am Nat142:488–507
Ptashne MA (2004)Genetic Switch: Phage Lambda Revisited. USA: Cold Spring Harbor Laboratory Press
Raj A, van Oudenaarden A (2008) Nature, nurture, or chance: stochastic gene expression and its consequences.Cell135:216–226 Rao CV, Wolf DM, Arkin AP (2002) Control, exploitation and tolerance
of intracellular noise.Nature420:231–237
Raser JM, O’Shea EK (2005) Noise in gene expression: origins, consequences, and control.Science309:2010–2013
Ribeiro AS (2008) Dynamics and evolution of stochastic bistable gene networks with sensing in fluctuating environments.Phys Rev E Stat Nonlin Soft Matter Phys78:061902
Robert L, Paul G, Chen Y, Taddei F, Baigl D, Lindner AB (2010) Pre-dispositions and epigenetic inheritance in the Escherichia coli lactose operon bistable switch.Mol Syst Biol6:357
Rotem E, Loinger A, Ronin I, Levin-Reisman I, Gabay C, Shoresh N, Biham O, Balaban NQ (2010) Regulation of phenotypic variability
by a threshold-based mechanism underlies bacterial persistence.
Proc Natl Acad Sci USA107:12541–12546
Salathe´ M, van Cleve J, Feldman MW (2009) Evolution of stochastic switching rates in asymmetric fitness landscapes.Genetics 182:
1159–1164
Samoilov MS, Price G, Arkin AP (2006) From fluctuations to phenotypes: the physiology of noise.Sci STKE2006:re17 Sedighi M, Sengupta AM (2007) Epigenetic chromatin silencing:
bistability and front propagation.Phys Biol4:4
Schoustra SE, Bataillon T, Gifford DR, Kassen R (2009) The properties of adaptive walks in evolving populations of fungus.PLoS Biol
7:11
Shibata T, Fujimoto K (2005) Noisy signal amplification in ultra-sensitive signal transduction. Proc Natl Acad Sci USA 102:
331–336
Stomp M, van Dijk MA, van Overzee HM, Wortel MT, Wortel MT, Sigon CA, Egas M, Hoogveld H, Gons HJ, Huisman J (2008) The timescale of phenotypic plasticity and its impact on competition in fluctuating environments.Am Nat172:169–185
Ta˘nase-Nicola S, ten Wolde PR (2008) Regulatory control and the costs and benefits of biochemical noise. PLoS Comput Biol 4:
e1000125
Thattai M, van Oudenaarden A (2004) Stochastic gene expression in fluctuating environments.Genetics167:523–530
Tsuda ME, Kawata M (2010) Evolution of gene regulatory networks by fluctuating selection and intrinsic constraints.PLoS Comput Biol6, pii: e1000873
van Der Woude MW, Baumler AJ (2004) Phase and antigenic variation in bacteria.Clin Microbiol Rev17:3
van Hoek M, Hogeweg P (2007) The effect of stochasticity on the lac operon: an evolutionary perspective.PLoS Comput Biol3:e111 Veening JW, Stewart EJ, Berngruber TW, Taddei F, Kuipers OP,
Hamoen LW (2008) Bet-hedging and epigenetic inheritance in bacterial cell development. Proc Natl Acad Sci USA 105:
4393–4398
Visco P, Allen RJ, Majumdar SN, Evans MR (2010) Switching and growth for microbial populations in catastrophic responsive environments.Biophys J98:7
Wagner GP, Altenberg L (1996) Complex adaptations and the evolution of evolvability.Evolution50:967–976
Wang Z, Zhang J (2011) Impact of gene expression noise on organismal fitness and the efficacy of natural selection.Proc Natl Acad Sci USA
108:E67–E76
Zhang Z, Qian W, Zhang J (2009) Positive selection for elevated gene expression noise in yeast.Mol Syst Biol5:299