Original citation:
Cain, Rebecca, Jennings, P. A. (Paul A.) and Poxon, John E. W.. (2013) The development and application of the emotional dimensions of a soundscape. Applied Acoustics, 74 (2). pp. 232-239.http://dx.doi.org/10.1016/j.apacoust.2011.11.006
Permanent WRAP url:
http://wrap.warwick.ac.uk/51888
Copyright and reuse:
The Warwick Research Archive Portal (WRAP) makes this work of researchers of the University of Warwick available open access under the following conditions. Copyright © and all moral rights to the version of the paper presented here belong to the individual author(s) and/or other copyright owners. To the extent reasonable and practicable the material made available in WRAP has been checked for eligibility before being made available.
Copies of full items can be used for personal research or study, educational, or not-for-profit purposes without prior permission or charge. Provided that the authors, title and full bibliographic details are credited, a hyperlink and/or URL is given for the original metadata page and the content is not changed in any way.
A note on versions:
The version presented here may differ from the published version or, version of record, if you wish to cite this item you are advised to consult the publisher’s version. Please see the ‘permanent WRAP url’ above for details on accessing the published version and note that access may require a subscription.
The development and application of the emotional dimensions of a
soundscape
Rebecca Caina*, Paul Jenningsa, John Poxona
aWMG, International Digital Laboratory, University of Warwick, Coventry, CV4 7AL, UK
*Corresponding author: [email protected] Tel. +44 (0) 247 657 5951
Abstract
People have emotional reactions to the built environment, and the sonic environment is one of the major contributing factors of people’s experiences of places. It is useful for decision makers such as planners, architects, engineers and designers to understand the link between the soundscapes of built environments, and their resultant emotional reactions within users of those environments. This understanding can allow these decision makers to make better informed decisions about built environment design, and achieve the desired positive emotional responses from users. The issue under question, and the subject of this paper, was to understand and define the emotional dimensions of a soundscape, and then to explore how the resultant dimensional space could have a practical application in decision making. Through data generated through the Positive Soundscapes Project, a Principal Component Analysis was conducted to decompose descriptors of the urban soundscape into two independent emotional dimensions. It was found that the 2 independent emotional dimensions of a soundscape relate to its “Calmness” and “Vibrancy”, and these could be positioned to describe a 2-Dimensional (2-D) perceptual space. Listening evaluations were then conducted to explore how perceptions of different types of urban
soundscape could be plotted with the 2D emotional perceptual space, and to illustrate how (i) introducing design interventions can change the position of soundscapes within this space and (ii) how metrics such as dB(A) do not necessarily correlate with calmness and vibrancy scores. Through illustrative examples, we suggest how such a 2d perceptual space might have a practical use in the planning process, primarily as a means for presenting users’ perceptions of soundscapes in a simple, visual, and easy to compare manner, and for setting targets for current and future soundscape design. We conclude with
recommendations for further work required to fully develop these emotional dimensions and the 2D perceptual space into a useful tool.
Keywords: Soundscape; Perceptual Dimensions; Target-setting; Planning; Calmness; Vibrancy
1. Introduction
Generally, the concept of soundscape takes a more holistic approach than simply considering the
unwanted health effects of noise, such as sleep disturbance or annoyance [13], and considers the way that environmental sounds are meaningful events that affect people [4, 14]. The concept of soundscape includes a subjective component – namely the way that the environment is perceived and understood by individuals and communities [15], and it takes into account concepts such as expectation [16]. The emphasis is now on “positive “ soundscapes. Simply removing negative sounds however, is not enough – if negative sounds are not replaced by more positive ones the soundscape can become less negative but not necessarily more positive. Furthermore, the simple elimination of “noise” is not always appropriate either, and can create anxiety [1].
The study of soundscapes is challenging because it is also necessary to consider the context of the soundscape, rather than simply evaluating its different acoustical qualities [17, 18]. Yang and Kang [19] for example, have found considerable differences between quantitative measurements of acoustic comfort, and the subjective evaluation of the same soundscapes. Dubois et al [4] related the cognitive categories which described soundscapes to the individual experiences of people and the collective representations shared in the language of society. Demographic issues are also an issue in soundscape evaluation as pointed out by Kang and Zhang [20] who identified the differences in soundscape perception between designers and the general public. Cain et al [17] and Jennings and Cain [21, in this issue] propose an activity-centric framework, whereby evaluation of the soundscape must take into consideration other contextual factors, such as the demographics of the listener, the activity they are doing, and other temporal factors such as time of day or year. Listening state is also important as a “tuned in” or “tuned out” state will effect perception of the soundscape. In “tuning out”, listeners effectively “hear away” from them in a manner that lets the sounds “disappear” from the conscious sphere [1].
The soundscape in urban spaces is a complex system, relating to physical, psychological and social factors. It is therefore important to identify the key factors which characterize the soundscape [20]. Semantic processing has increasingly been used as a method for achieving this, and has been proposed as a suitable method for connecting users’ feelings at linguistic and psychophysical levels with the sounds in urban spaces [20].
In this paper, we aim to understand and define the dimensions of a soundscape which describe an emotional perceptual space, through data generated through the Positive Soundscapes Project. We then explore how the resultant dimensional space could have a practical application in decision making. We approach this through a multi-disciplinary approach, and we take as our inspiration, an approach traditionally used in sound quality.
1.1 Soundscape dimensions
The link between the acoustic environment and people’s reaction to it has traditionally been considered in the context of noise evaluation. In these cases, noises tend to be described by quantitative metrics such as Sound Pressure Level. However, if we are to consider the psychological effects of the sound
environment, a more qualitative description may be more appropriate. Descriptions of soundscapes need not only the acoustical numbers, but also semantic data [18] which can be presented as key factors, principal components or perceptual dimensions (these names all mean the same thing and can be used interchangeably). These perceptual dimensions of a soundscape can form a kind of “evaluation structure” [22], on which people can assess soundscapes. Therefore, for studies which focus on the study of
Semantic differential technique
Semantic features play an important role in auditory judgements, which are conveyed in language when we communicate [23]. These semantic features can be explored through semantic differential (SD) rating scales - a technique first proposed by Osgood [24]. While not a specific test, it is a valuable technique for identifying the psychological dimensions along which concepts or sensory stimuli are evaluated [25]. The SD technique can be successfully applied to the perception of complex sounds and is often used to characterise urban environments (e.g. 20] and other specific sounds such as interior car noise [26]. Many earlier studies focused on the timbre of individual sounds [e.g. 27], and later studies expanded to consider environmental sound [20]. The SD technique works by rating a number of entities (e.g. different
soundscapes) on a number of bipolar rating scales such as calming-disturbing. A larger number of rating scales than the expected number of actual psychological dimensions on which the entities can be judged is essential. The ratings are typically subjected to factor analysis to determine the underlying dimensions on which the stimuli are evaluated [25].
Several researchers have previously studied the multi-dimensional evaluation of different types of sounds and soundscapes, and field investigation has revealed a number of principal components in the subjective description of these. A brief summary is presented below:
• Aircraft sound quality - Barbot et al [28] extracted 4 dimensions: local fluctuations of the level (staccato, irregular, fluctuating vs. continuous, stable); Rise time of sound level (progressive, long, prolonged vs. continuous, stable); Timbre (high pitched vs. low pitched); and the presence of harmonics created by fan noise.
• Environmental sounds and soundscapes – Kawai et al [22] extracted 3 dimensions which accounted for approximately 50% of the variance: preference; activity; sense of life. Kang and Zhang [20] identified 4 factors which accounted for 53% of the variance: relaxation;
communication; spatiality; and dynamics. For residential areas, Berglund et al [29] found 4 dimensions: adverse; reposing; affective; and expressionless.
• Music, vehicle and artificial sounds – Kerrick et al [27] extracted 2 dimensions which
accounted for 73% of the variance: active, loud, familiar, noisy; and pleasant, acceptable, good, natural.
• Common sounds – Kidd and Watson [25] defined 4 dimensions: harshness; complexity; size; and appeal, accounting for 89% of the variance.
1.2 Emotional soundscape dimensions
It can be seen from previous efforts to define soundscape dimensions that they can be a combination of descriptors which describe the sound, (e.g. loud, harshness, clarity, spatiality) and descriptors which are more emotional, and allude to how the listener feels from hearing the sound. However, our rationale is that understanding how a place makes a person feel emotionally, is actually of more use to planners and decision makers than understanding the acoustical signal of the soundscape. For this reason, in our investigation of perceptual dimensions of a soundscape, we have chosen to focus on emotional semantic descriptors which relate to how a person feels from hearing a soundscape. So while there have been previous attempts to decompose a soundscape into a small number of dimensions, none could be found to have focused specifically on emotional dimensions. Of note, however, is Guillen and Lopez Barrio [30], who obtained 3 dimensions (emotional evaluation and strength; activity; and clarity) which accounted for 66% of the total variance. This combined an element of emotion with more objective auditory attributes.
automotive sound quality [31], where for instance, it has been found that 80% of the variability of automotive 2nd gear wide open throttle sounds (i.e. foot flat to the floor in 2nd gear) could be described using 2 principal components: “powerfulness” and “refinement” [26]. This enabled different vehicles and brands to be positioned on a two-dimensional target space, with powerfulness on the x-axis and
refinement on the y-axis. It is interesting to note that these dimensions do not describe the sound itself, but they describe the listeners’ perceptions of the vehicle from hearing the sound. This is because the manufacturer is most interested in promoting a positive perception of the car itself. (This is analogous to our concept that the dimensions of a soundscape may not describe the sound, but rather describe how a person feels from hearing the sound – for a further discussion, see Jennings and Cain [21, in this issue]).
Intriguingly, following evaluations of vehicle sound quality and plotting their ratings within the 2-Dimensional (2-D) space, it was found that vehicles of the same brand clustered together. This made it possible for manufacturers to set targets for future brands relative to the position of their current brand, and competitor brands on the 2-D target space. The 2-D perceptual space was then used to present to key decision makers a demonstration of how making an engineering intervention (e.g. changing engine mounts) would change the sound, and consequently, move the brand around within the 2-D space. In a similar way, we propose that planners, like NVH engineers would benefit from being able to describe a soundscape on 2 independent principal dimensions. This would allow decision makers to position existing and future soundscapes within a 2-D space, enabling them to understand how making different design interventions (for instance introducing water features or changing traffic flow) could move
soundscapes around that space. This could also facilitate a target-setting process for soundscape design – allowing planners to visually describe the position of certain soundscapes in relation to other, perhaps competitor soundscapes. Hence, in our development of emotional soundscape dimensions, it was our aim to produce a 2-factor framework.
2. Development of emotional soundscape dimensions
2.1 Methodology
To map out a 2-D perceptual space for emotional soundscape perception, our starting point was to determine an appropriate starting set of dimensions and semantic descriptors to use in the SD technique (as described earlier). In line with the inter-disciplinary ethos of the Positive Soundscapes Project [7, and 8 in this issue], and in line with the recommendation that in cross-disciplinary approaches to soundscape study, experiments and analyses should be performed in strict collaboration within the cross-disciplinary group [1], it was decided to use data already collected from the different strands of the project. It is being increasingly recommended that study of soundscapes should involve inter-disciplinary research teams, and in addition to the Positive Soundscapes Project, further multi-disciplinary projects in soundscapes have been reported [e.g. 18].
It was important that the semantic scales that would be used were representative of the constructs that the everyday users of urban spaces would employ to evaluate their perceptions of urban spaces [22], therefore the data used was rich in listeners’ own personal language.
•The second source of data used was from a number of soundwalk transcripts, in which participants had been asked to listen to the urban soundscape in 5 different locations, and to then describe how the location made them feel [33].
•The third source of data used, came from over 450 responses to a “Favourite Sounds” questionnaire distributed by the sound artist Peter Cusack [34, 35]. The questionnaire asked respondents to name their favourite sound in particular cities (Manchester and London were used), and to explain why. The explanations were searched for descriptions of how the sound made the respondent feel about the place.
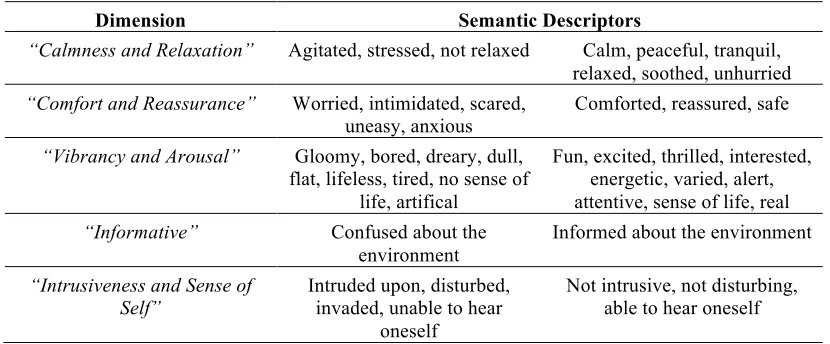
[image:6.612.99.514.354.526.2]The individual comments were coded, and then clustered together so that similar meaning descriptors became grouped in higher level categories. The “rough-cut” set of dimensions was then discussed by the team members in the Positive Soundscapes Project, to produce a final shortlist of 5 dimensions. The “rough-cut” list contained dimensions such as uniqueness, congruency, nostalgia and culturally representative, but these were discarded as they did not fit with our original rationale, that emotional dimensions should describe how the sound makes a person feel about the space. It was also decided not to include “pleasantness” as a dimension as this was considered to be too broad an assessment. Table 1 presents the final 5 emotional dimensions and their semantic descriptors. The semantic descriptors are intended to complete the sentence “this place makes me feel….”
Table 1: Starting set of dimensions
Dimension Semantic Descriptors
“Calmness and Relaxation” Agitated, stressed, not relaxed Calm, peaceful, tranquil,
relaxed, soothed, unhurried
“Comfort and Reassurance” Worried, intimidated, scared,
uneasy, anxious
Comforted, reassured, safe
“Vibrancy and Arousal” Gloomy, bored, dreary, dull,
flat, lifeless, tired, no sense of life, artifical
Fun, excited, thrilled, interested, energetic, varied, alert, attentive, sense of life, real
“Informative” Confused about the
environment
Informed about the environment
“Intrusiveness and Sense of
Self” Intruded upon, disturbed, invaded, unable to hear
oneself
Not intrusive, not disturbing, able to hear oneself
2.1.1 Experimental procedure
Two experiments were then conducted using the dimensions in Table 1.
Experiment 2: Jurors rated 8 different soundscape recordings, on the dimensions in Table 1, using 1-9 semantic differential rating scales. This time, the recordings were recorded binaurally on the University of Warwick campus, and the locations used were intended to be representative of the types of urban setting used in Experiment 1, and included roads with traffic, human sounds, green spaces with distant traffic, wildlife and water features. Experiment 2 also aimed to explore if presenting a visual context with the soundscape recording had an effect on the resulting principal dimensions. Half of the jurors
conducted the experiment while viewing images of the recording locations (Experiment 2A), whereas the other half of the jurors conducted the experiment with auditory stimuli only (Experiment 2B).
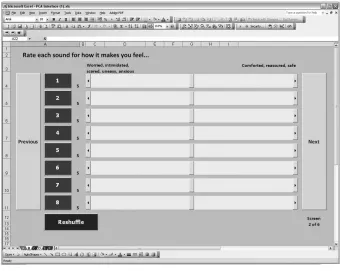
Both experiments were presented to the jurors on a lap-top computer, using an MS Excel interface (Figure 1). Within the interface, each “dimension” and its semantic scales had its own page, and the recordings were presented as buttons numbered 1-8 with corresponding ratings scales. Clicking on each button played the recording, which was listened to over headphones. Jurors were asked the question: “rate the sounds for how it makes you feel” and did so by dragging the marker along the rating scale. The associated semantic descriptors were displayed at either end of the rating scales. After participants had rated each recording, clicking on the “Reshuffle button”, re-ordered the recordings according to the rating score given. This allowed jurors to “fine-tune” their ratings by assessing the recordings relative to each other. The presentation order of the recordings was randomized for each juror. Clicking on the “Next” button allowed the juror to move forwards onto the next screen and the next dimension. The experiments were conducted using headphones which were calibrated for playback to be the same level as the original recordings.
[image:7.612.135.478.372.643.2]
2.2 Results
Experiment 1 –
22 jurors rated the 8 recordings according to the semantic descriptors. The method used for determining how the different rating scales are related to one another is Principal Components Analysis, and is a type of factor analysis. The analysis provides an indication of the number of independent perceptual attributes (principal components or factors) underlying the pattern of ratings, and also a measure (factor loading) of the degree to which each rating scale is associated with each perceived attribute [25].
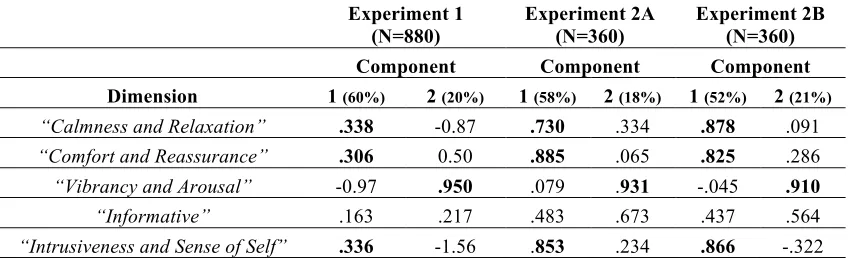
A Principal Component Analysis (varimax rotation) was conducted on the rating data to extract the two orthogonal factors underlying the five semantic scales. Component 1 was found to explain 60% of the variance and had high positive loadings for “Calmness and Relaxation” and “Intrusiveness”, and also with “Comfort and Reassurance”. Component 2 was found to explain 20% of the variance and had a high positive loadings for “Vibrancy and Arousal” (Table 2). These two components retain orthogonality and together, explain 80% of the variability in the original 5 dimensions.
[image:8.612.95.521.306.435.2]
Table 2: Experiment 1, 2A and 2B: Component Score Coefficient Matrices (Varimax Rotation)
Experiment 1 (N=880)
Experiment 2A (N=360)
Experiment 2B (N=360) Component Component Component Dimension 1 (60%) 2 (20%) 1 (58%) 2 (18%) 1 (52%) 2 (21%)
“Calmness and Relaxation” .338 -0.87 .730 .334 .878 .091
“Comfort and Reassurance” .306 0.50 .885 .065 .825 .286
“Vibrancy and Arousal” -0.97 .950 .079 .931 -.045 .910
“Informative” .163 .217 .483 .673 .437 .564
“Intrusiveness and Sense of Self” .336 -1.56 .853 .234 .866 -.322
Experiment 2A –
9 jurors rated the 8 recordings according to the semantic descriptors (this time, with visual stimuli). A Principal Component Analysis showed that Component 1 was found to explain 58% of the variance and had high positive loadings for “Comfort and Reassurance” and “Intrusiveness”, and also with “Calmness and Relaxation”. Component 2 explained 18% of the variance and had a high positive loading with “Vibrancy and Arousal” (Table 2). These two components retain orthogonality and explain 76% of the variability in the original 5 dimensions.
Experiment 2B –
9 different jurors rated the 8 recordings according to the semantic descriptors (without visual stimuli). A Principal Component Analysis showed that Component 1 explained 52% of the variance and had high positive loadings for “Calmness and Relaxation”, and “Intrusiveness” and also with “Comfort and Reassurance”. Component 2 explained 21% of the variance and had a high positive loading for “Vibrancy and Arousal” (Table 2). These two components retain orthogonality and explain 73% of the variability in the original 5 dimensions.
2.3 Conclusions
•Dimension 1 – is a combination of “Calmness and Relaxation”, “Comfort and Reassurance”, and “Intrusiveness”. For ease, we will hereafter refer to Dimension 1 as “Calmness”.
•Dimension 2 – is “Vibrancy and Arousal”. For ease, we will hereafter refer to Dimension 2 as
“Vibrancy”.
[image:9.612.127.497.168.471.2]
Figure 2: Independent soundscape dimensions: “Calmness” and “Vibrancy”.
It is important to note that for ease, we have labeled the 2 dimensions “calmness” and “vibrancy”, however it must be remembered that the full semantic descriptors for these dimensions should be used, in order to represent accurately the semantic meaning of the dimension. Barbot et al [28] for instance, noted that the meaning of the adjectives can be difficult to interpret by subjects and can even be different between subjects, which is why it is important to fully describe our emotional dimensions with multiple semantic descriptors.
3. Discussion on the application of emotional soundscape dimensions
[image:10.612.73.541.211.382.2]To explore the practical use of the 2-D perceptual space, the next stage was to position different soundscapes within this space. Thirteen different soundscapes were used (Table 3), and included 6 common urban soundscapes such as a market square, a park and a street. To explore the effect of design interventions upon soundscape perception, the market square recording was modified through the addition of extra sounds which related to different types of intervention, including different frequencies of air conditioning units, a water fountain, birds, a church bell, human rowdiness and near traffic.
Table 3: Sample of soundscapes recordings for use in exploring applications of the calmness-vibrancy perceptual space
Objective data was also collected for each recording, to explore the relationship between objective measures and listener perception (though this is not covered in depth in this paper). It was the consensus of the team on the Positive Soundscapes project that Loudness and Intelligibility (Articulation Index) were the two metrics which have been most widely used within the area of soundscape studies [e.g. 37]. The psycho acoustic parameters of Intelligibility, Sound Pressure Level and Loudness were calculated as the overall average of the left and right channels for the 8-second sound clips. The parameters Sharpness, Roughness and Fluctuation Strength were also included as they give a better indication of the shape of the sound, as opposed to an average level of magnitude. All metrics were calculated with B&K’s Sound Quality software. To provide us with some illustrative examples, these soundscape recordings were played to volunteers over headphones, using the same interface as described in section 2.1.1. Participants rated the sound recordings according to how calming or how vibrant they made them feel, using the semantic descriptors in Figure 2. Using these illustrative examples (but based on actual data) we can demonstrate some potential applications of the calmness-vibrancy perceptual space:
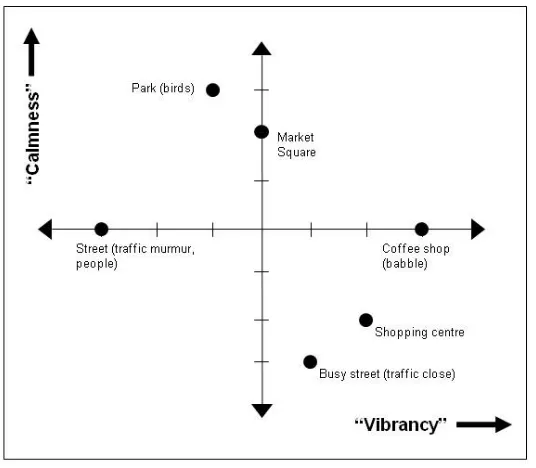
Plotting different soundscapes
Figure 3: Plotting different soundscapes within the calmness-vibrancy perceptual space
Exploring the effects of design interventions on perception of a place
Figure 4 shows the position of a market square, and shows how the position of this changes within the space, as different design interventions are introduced. Interestingly, for this particular listener, adding new things into the soundscape reduced the feeling of calmness. Church bells, rowdiness and nearby traffic were all shown to increase the feeling of vibrancy within the space, whereas air-conditioning units, birdsong and a water fountain all decreased the feeling of vibrancy. Using the perceptual space in this way has a number of potential applications for planners and decision makers:
• To present how different frequencies of air conditioning might change the perception of a specific place.
• To present the potential effects of larger design interventions within an urban space, e.g. introducing a water feature into an urban square, or changing the layout of roads.
• To present how bigger social and technological changes to the soundscape which go beyond planning, such as the future growth in hybrid and electric vehicles will change the calmness and vibrancy perception of our urban spaces.
Using the perceptual space in these ways really relies on the effective use of lab-based evaluations using real and artificial soundscape recordings. Environments such as 3D sound rooms can be used to present different permutations of soundscapes to users and decision makers to guage how different design options would impact upon the perception of people within the space.
Figure 4: Demonstrating the effect of design interventions with the calmness-vibrancy perceptual space
Demonstrating that objective measures cannot be used in isolation
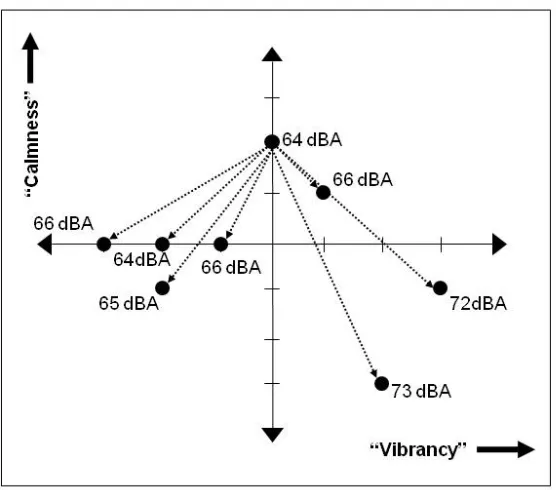
Figure 5 shows the same soundscapes as presented in Figure 4, with the addition of the dB(A) level. Interestingly, it can be seen that many of the recordings have roughly the same level, but they are perceived very differently for calmness and vibrancy. This is important as it serves as evidence that simply using objective measures is not sufficient to fully understand listener perception of the soundscape.
Figure 5: The effect of design interventions on dBA levels within the calmness-vibrancy perceptual space
Target-setting for soundscape design
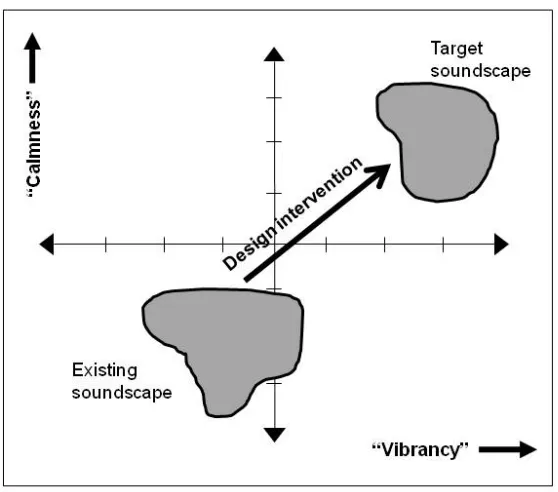
Figure 6 demonstrates that once an existing soundscape has been plotted within the perceptual space, a target or “ideal” position can be identified. In this way, it is then a question of planners understanding how specific design interventions will move perceptions of soundscapes around the space in certain directions. This is where the challenge lies for future research. A great deal more evidence is needed to understand how different design interventions will position different soundscapes within the perceptual space. Combined with the well-known challenges of context, personal experience and cognition and subjectivity in assessing soundscapes, this is a considerable task.
Figure 6: Using the calmness-vibrancy space for target-setting for soundscape design
4. Conclusions
By using semantic differential rating scales and a Principal Component Analysis on data collected across the disciplines on the Positive Soundscapes Project, it has been shown that the two principal emotional dimensions on which people can evaluate how the soundscape of a place makes them feel are calmness and vibrancy. These differed to other soundscape dimensions that had previously been identified in the literature, by only including emotional descriptors (rather than dimensions which specifically described the sound). These dimensions can be positioned to form a 2-D perceptual space, with vibrancy on the x-axis and calmness on the y-x-axis. Through illustrative examples, we demonstrated four different ways in which the space could be used to help planners and decision makers understand the effect of their design interventions upon listener perception. In doing this, we draw attention to the following important issues and limitations, and highlight the need for further research in this area. (These issues are expanded upon further by Jennings and Cain [21 in this issue, and 38].
• Demographic issues will always be an issue in soundscape evaluation and there is the need to collect data from large populations on soundscape perception in order to understand the nuances between different demographic groups. It is then for planners to determine what demographic groups might be in particular urban spaces and to plan the soundscape accordingly. In the same vein, listening state – a “tuned in” or “tuned out” state will effect perception of the soundscape. As listening states can be associated with activity, it is important to understand the intended activities of users within a space, in order to design the soundscape for the corresponding listening state.
• Our emotional dimensions of urban soundscapes could have a role in protecting and preserving places or settings where the conservation of the sound environment is important, for example quiet areas, or places of important cultural identity – by showing how not preserving a soundscape (e.g. through increased traffic noise) could change how people perceive a space.
To conclude, there is a need to develop more soundscape specific indicators and tools that could eventually be used for soundscape design. There is a gap however: which is to rigorously assess deliberate soundscape interventions to understand what design aspects work and which do not. Our proposed 2-D emotional perceptual space may be one such way of understanding the effects of design interventions.
Acknowledgements
The authors have been working as part of the Positive Soundscapes Project, which is funded by the UK’s Engineering and Physical Sciences Research Council.
References
[1] T. Stockfelt, Sound as an existential necessity. J Sound Vib. 151:3 (1991) 367-70 [2] J. Kang, Urban Sound Environment. London: Taylor & Francis (2007)
[3] M. Adams, T. Cox, G. Moore, B. Croxford, M. Refaee, S. Sharples, Sustainable soundscapes: Noise policy and the urban experience, Urban Stud. 43:13 (2006) 2385-98
[4] D. Dubois, C. Guastavino, M. Raimbault, A Cognitive approach to urban soundscapes, Acta Acust United Ac. 92 (2006) 865-74
[5] R.M. Schafer, The new soundscape, Universal Edition, Vienna (1969) [6] R.M. Schafer, The tuning of the world. New York: Knopf (1977)
[7] W. Davies, M. Adams, N. Bruce, R. Cain, A. Carlyle, P. Cusack, K. Hume, P. Jennings, C. Plack, “The Positive Soundscapes Project”, In Proceedings of the 19th International Congress on Acoustics, Madrid, Spain, September (2008)
[8] W.J. Davies, M.D. Adams, N.S. Bruce, R. Cain, A. Carlyle, P. Cusack, D.A. Hall, K.I. Hume, A. Irwin, P. Jennings, M. Marselle, C. Plack, J. Poxon, Perception of Soundscapes: An interdisciplinary approach, Applied Acoustics, this issue
[9] J. Tardieu, P. Susini, F. Poisson, P. Lazareff, S. McAdams, Perceptual study of soundscapes in train stations, Appl Acoust. 69 (2008) 1224-39
[10] A. Craven, A.G. Carton, C.R. McPherson, G. McPherson, Determining and quantifying components of an aquaculture soundscape, Aquacult Eng. 41 (2009) 158-65
[11] K.Genuit, A. Fiebig, Psychoacoustics and its benefits for the soundscape approach. Acta Acust United Ac. 92:6 (2006) 952-8
[12] S.R. Payne, W.J. Davies, M.D. Adams, Research into the Practical Policy Applications of
Soundscapes Concepts and Techniques in Urban Areas, DEFRA Report NANR200 (June 2009) available from http://randd.defra.gov.uk
[13] D. Botteldooren, B. De Coensel, T. De Mur, The temporal structure of urban soundscapes. J Sound Vib. 292 (2006) 105-123
[14] B.Schulte-Fortkamp, The meaning of annoyance in relation to the quality of built environments, Noise and Health, 4 (2002) 13-28
[15] B. Truax, The handbook of acoustical ecology, ARC Publications, Vancouver (1978)
[16] N.S. Bruce, W.J. Davies, M.D. Adams, , Expectation as a factor in the perception of soundscapes , in: Euronoise 2009, 26-28 October 2009, Edinburgh, U.K.
[18] M. Rychtarikova, G.Vermeir, M.Domecka, The application of the soundscape approach in the evaluation of urban public spaces, In: Proceedings of Acoustics 08, Paris, France (2008)
[19] W. Yang, J.Kang, Acoustic comfort evaluation in urban open public spaces, Appl Acoust. 66 (2005) 211-29
[20] J. Kang, M. Zhang, Semantic analysis of the soundscape in urban open public spaces. Build Environ. 45 (2010) 150-7
[21] P. Jennings, R. Cain, A Framework for Improving Urban Soundscapes, Applied Acoustics, this issue [22] K.Kawai, T. Kojima, K. Hirate, M. Yasuoka, Personal evaluation structure of environmental sounds: experiments of subjective evaluation using subjects’ own terms. J Sound Vib. 277 (2004) 523-33
[23] C. Guastavino, P. Cheminée, A psycholinguistic approach to the ecological validity of experimental settings. The case of low frequency perception in urban context. Food Quality Prefer. 15 (2004) 884-6 [24] C.E. Osgood, G.J. Suci, P.H. Tannenbaum, The Measurement of Meaning, University of Illinois Press, Champaign, IL (1957)
[25] G.R. Kidd, C.S. Watson, The perceptual dimensionality of environmental sounds, Noise Control Eng J. 51:4 (2003) 216-31
[26] G.T. Dunne, The introduction of a sound quality engineering process to Jaguar Cars: executive summary, University of Warwick EngD Thesis (executive summary) (2003)
[27] J.S. Kerrick, D.C. Nagel, R.L. Bennet, Multiple ratings of sound stimuli, J Acoust Soc Am. 45:4 (1969) 1014-17
[28] B. Barbot, C. Lavandier, P. Cheminée, Perceptual representation of aircraft sounds, Appl Acoust. 69 (2008) 1003-16.
[29] B. Berglund, C.A. Erikson, M.E. Nilsson, Perceptual characterization of soundscapes in residential areas, In: Proceedings of the 17th international congress on acoustics. Rome, Italy (2001)
[30] J.D. Guillen and I. Lopez Barrio , “The Soundscape Experience”, In Proceedings of the 19th International Congress on Acoustics, Madrid, Spain, 2-7 September (2007)
[31] R. Cain and P. Jennings How learning from automotive sound quality can inform urban soundscape design, Design Principles and Practices: An International Journal, 3:6 (2009) 197-208
[32] R. Cain and P. Jennings, “Developing best practice for lab-based evaluations of urban soundscapes”, In Proceedings of Inter-Noise 2007, Istanbul, Turkey, August 28-31 (2007)
[33] M. Adams, and N. Bruce, , “Soundwalking as a methodology for understanding soundscapes”, In Proceedings of the Institute of Acoustics Spring Conference, Reading, UK, 30:2 552-58 (2008) [34] Favourite sounds, http://www.favouritelondonsounds.org/
[35] Favourite sounds, http://www.favouritemanchestersounds.org/
[36] J. Poxon, P. Jennings and R. Cain, “Creation and use of a simple method for displaying and analyzing soundscapes recordings”, In Proceedings of Inter-Noise 2009, Ottawa, Canada, August 23-26 (2009)
[37] G-S. Kang, C. Kook, The selection of introduced sounds to improve the soundscape in the public spaces, J Physiological Anthropology and Applied Human Science, 24:1 (2005) 55-99
[38] P. Jennings and R. Cain, “A Framework for Assessing the Change in Perception of a Public Space through its Soundscape”, In Proceedings of Inter-Noise 2009, Ottawa, Canada, August 23-26 (2009) [39] R.Cain and P.Jennings, The disconnect between the emotional dimensions of a soundscape and its metrics, In Proceedings of EuroNoise, Edinbugh, Scotland (2009)