Abstract—The aim of this work was to produce biodiesel from waste vegetable oil over ZnO/TiO2 catalysts as well as investigating the effect of co-solvent (hexane), reaction temperature and time on waste vegetable oil conversion to biodiesel. Production of biodiesel from virgin oil is still a downfall in commercial processes due to high cost. Thus, the process of producing biodiesel from waste vegetable oil over a TiO2-supported ZnO catalyst was studied in the absence and the presence of hexane as co-solvent respectively.
The conversion of waste vegetable oil was found to increase with temperature and reaction time. The highest conversion that has been achieved was 99.1% at a temperature of 200 °C after 15 min of reaction for the reaction using hexane as co-solvent. The use of hexane as co-solvent was found to increase the oil conversion at lower reaction temperature and no effect was observed at higher temperatures.
Index Terms—Biodiesel, Effect of co-solvent, ZnO/TiO2 I. INTRODUCTION
IODIESEL was found to be a renewable, non-toxic, biodegradable and environmental friendly fuel that can replace the well-known petro-diesel in a perfect way and be used directly as diesel mixture in engines with little changes [1]. The main feedstock for biodiesel production are vegetable oils such as soybean oil, rapeseed oil, etc. However, the cost of this feedstock is quite high, accounting for roughly 60–80% of the total biodiesel cost. Using cheaper feedstocks, such as waste cooking oil, animal fats, and crude vegetable oils, has been suggested to lower the cost [2]. This study will make use of waste vegetable oil as feedstock for biodiesel production. However, such low-cost materials contain high amounts of free fatty acids (FFAs) that are not compatible with the alkali catalyst most used in transesterification, causing problems like incomplete
Manuscript received March 18, 2015; revised April 02, 2015. This work was supported in part by the National Research Foundation (NRF) and the Faculty of Engineering and the Built Environment at the University of Johannesburg.
N. Mahangani is with the Department of Chemical Engineering, University of Johannesburg, South Africa (e-mail: [email protected]).
E. Vunain is with the Department of Chemistry, University of Johannesburg, South Africa (email: [email protected]).
R. Meijboom is with the Department of Chemistry, University of Johannesburg, South Africa (email: [email protected]).
K. Jalama is the Department of Chemical Engineering, University of Johannesburg, South Africa (corresponding author, e-mail: [email protected], phone: +27-11-559-6157).
recovery of the catalysts, increased purification costs, etc. To deal with such feed stocks, a ZnO/TiO2 solid catalyst
system will be used in this study. It is generally known that solid catalysts used in the transesterification reaction of vegetable oils suffer lower reaction rates compared to their homogeneous counterparts. In an attempt to improve the reaction rate of a ZnO/TiO2 catalyst system, the effect of a
co-solvent on the overall reaction rate will be evaluated. A number of studies have reported on the addition of tetrahydrofuran (THF), hexane, diethyl ether (DME) [3] and biodiesel [4] into the reaction mixture with the aim to increase the solubility of the reacting mixture and subsequently improve the mass transfer rate between oil and methanol phases. In the present study, the use of hexane will be evaluated as co-solvent and its effect of the overall waste vegetable oil conversion will be evaluated at various temperatures.
II.EXPERIMENTAL
A.Catalyst Preparation
The support for the catalyst was prepared by mixing 50 g of TiO2 (P25 Degussa) with distilled water in a mass ratio of
1:2.5 to make a paste-like mixture. The mixture was left for drying at a temperature of 100 °C overnight. This was followed by the process of calcination at 500 °C in air for 10 hours to further remove water and agglomerate the support. The calcined catalyst support was subsequently crushed and screened using the screen sizes of 106 µm and 53 µm to retain the particles (-106, +53 µm) that were used to support zinc oxide (ZnO). The support was impregnated with a solution of Zn(NO3)2·6H2O, dried overnight at 120
°C and calcined in air at 500 °C for 12 hours to decompose the Zn(NO3)2·6H2O into ZnO. The amount of
Zn(NO3)2·6H2O added to the TiO2 support was calculated in
order to achieve a loading of 10 wt.% ZnO in the calcined catalyst.
B.Catalyst Characterization
X-ray diffraction (XRD) analysis was performed on a blank TiO2 support and also on a ZnO/TiO2 sample
using a Philips PW 3040/60 diffractometer equipped with CuKα (λ=1.54 Å) radiation. Samples were scanned over a 2θ range of 4-90 degrees at a scan speed of 0.2 s/step. The mean crystallite size for ZnO was estimated
Biodiesel Production over ZnO/TiO
2
Catalyst:
Effect of Co-solvent, Temperature and Reaction
Time
Ndanganeni Mahangani, Ephraim Vunain, Reinout Meijboom, Kalala Jalama
from the full width at half maxima of the diffraction peak by the Scherrer equation.
(1)
Where:
Dp is the crystallite size in nm;
K is the shape factor;
λ is the X-ray wavelength in nm;
β is line broadening at half the maximum intensity and θ is the Bragg angle
X-ray fluorescence (XRF) analysis was performed using a Rigaku ZSX primus II on the catalyst sample to determine ZnO loading in the catalyst. Brunauer, Emmett and Teller (BET) analysis was performed to determine the surface area and the pore size for the blank TiO2 support and the
ZnO/TiO2 catalyst using Micromeritics Tristar 3000.
C.Catalyst Testing
The prepared ZnO/TiO2 catalyst was tested for the
conversion of a mixture of soybean oil (95%) and oleic acid (5%), to simulate dried waste vegetable oil, in a 300 cm3
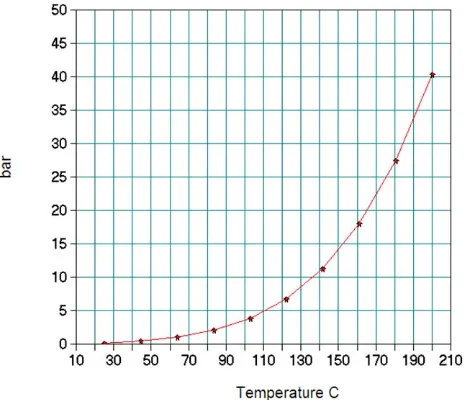
[image:2.595.54.286.526.726.2]Parr batch reactor fitted with a stirrer that was operated at a constant stirring speed 1100 rpm for all the runs. The reactor was operated under nitrogen gas pressure of 50 bar to keep methanol in the liquid phase in the whole range of temperature used in this study. ChemCad simulation software was used to plot the methanol vapour pressure as function of temperature (figure 1), and it was found that 40 bar was the methanol vapour pressure at 200 °C (the highest temperature used for testing). To be sure that the reactor pressure is always above the methanol pressure, the reactor was pressurized to 50 bar using nitrogen.
Fig. 1. Methanol vapour pressure vs temperature
Initially two runs were conducted for one hour each. For the first run the temperature was set at 150 °C and the pressure was kept at 50 bar. The second run was conducted at 200 °C. To test for the effect of co-solvent, the reactions described above were repeated under the same operating conditions but with the addition of hexane (same amount as oil) to the reactants. Samples were taken from the reactor every 15 minutes during each run and allowed to cool for phase separation. The top layer, containing the produced biodiesel, hexane (for runs where the co-solvent was used) and the unreacted oil was separated by decantation and analyzed using a gas chromatograph on a TRB-biodiesel column connected to a flame ionization detector (FID).
III. RESULTS AND DISCUSSION
A.Catalyst Characterization
X-Ray Diffraction. Figure 2 shows XRD data for the
calcined blank TiO2 support (fig.2b) and the TiO2-supported
ZnO catalyst (fig. 2a). The main peaks for the blank TiO2
support were observed at diffraction angles of ca. 25, 38, 48, 54, 55 and 63°. Comparing figure 2a and 2b, there are visible peaks for the ZnO/TiO2 catalyst at ca. 33, 35, 35.56,
47, 57 and 68° that are not present in the data for the blank TiO2 support. They represent the diffraction due to ZnO.
The most intense peak was detected at the diffraction angle of ca. 36.5° and was used to determine the crystallite size of ZnO in the sample. No new peak indicating the formation of new compounds in addition to TiO2 and ZnO was detected
in the supported catalyst. This suggests that there were no major ZnO/TiO2 compounds formation and that the
ZnO-TiO2 interactions were purely physical. The calculated ZnO
crystallite size was found to be 6.6 nm.
BET Analysis. Table 1 summarises the BET analysis
results for the blank TiO2 support and ZnO/TiO2 catalyst.
The surface area of the TiO2 support was found to be 7.6
m2/g, comparable to the value of 7.5 m2/g for ZnO/TiO 2
catalyst. The average pore diameter of the ZnO/TiO2
catalyst was ca. 24.2 nm compared to 18.8 nm for the blank calcined support. It is possible that some pores collapsed during the second calcination process upon the zinc salt addition to the TiO2 support.
The average particle size of 6.6 nm for ZnO as obtained from XRD suggests that ZnO particles were smaller than the pores of the TiO2 support and could also suggest that most
Fig. 2. XRD data for (a) ZnO/TiO2 catalyst; (b) Calcined bank TiO2 support
TABLE I: BET RESULTS
TiO2
support
ZnO/TiO2 Catalyst
BET surface area [m2/g]
7.6 7.5
Pore Volume [cm3/g] 0.039 0.050
Average pore diameter [nm]
18.8 24.2
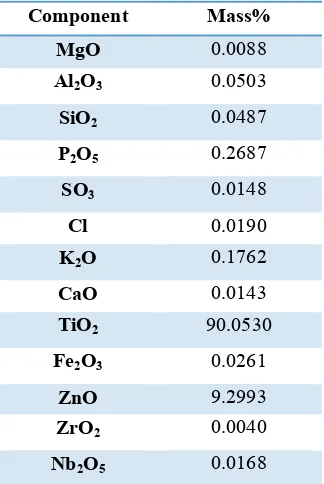
X-ray Fluorescence Results. Table 2 presents the
composition of the synthesized and calcined ZnO/TiO2
catalyst as determined by XRF.
TABLE II: XRF ANALYSIS RESULTS
Component Mass%
MgO 0.0088
Al2O3 0.0503
SiO2 0.0487
P2O5 0.2687
SO3 0.0148
Cl 0.0190
K2O 0.1762
CaO 0.0143
TiO2 90.0530
Fe2O3 0.0261
ZnO 9.2993
ZrO2 0.0040
Nb2O5 0.0168
These results show that TiO2 has higher mass percentage
of 90. This means that ZnO particles have enough pores to occupy in TiO2 particles. Although there is a presence of
other undesired components, their intensity was very small compared to ZnO and TiO2 particles, and their effect in the
reaction is negligible.
ZnO loading of ca. 9.3% as determined by XRF was satisfactorily closer to the targeted value of 10%.
B.Catalyst Testing
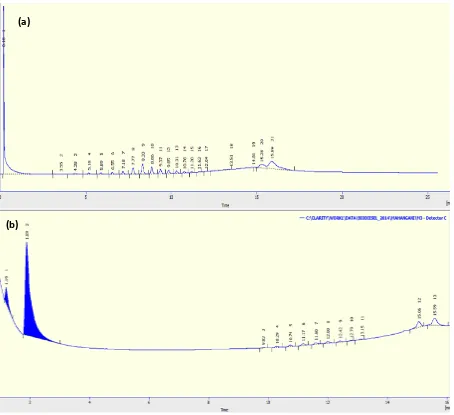
Figure 3a shows the chromatogram for waste vegetable oil before the reaction. The analysis was conducted at high temperature. The initial column temperature was 200 oC and
was increased to 350 oC during the analysis using a heating
rate of 15 oC/min. Under these conditions, the solvent peak
(hexane) was detected after 0.1 min. Figure 3b shows the chromatogram of an oil-biodiesel sample after 45 min of reaction at 100 °C where the peaks for biodiesel are highlighted at retention times of ca. 1.2 and 1.9 min. The oil conversion was determined as the mass percentage of the biodiesel peaks in the chromatograph.
Figures 4 and 5 show the waste oil conversion to biodiesel as a function of reaction time in the absence and in the presence of a co-solvent (hexane) at 150 and 200 °C respectively. These data at 150 °C (fig 4) show that the waste vegetable oil conversion increases with the increase in in reaction time in the absence of the co-solvent. Conversions of ca. 65.5, 70.3, 83.3 and 97.9% were measured after 15, 30, 45 and 60 min of reaction respectively. In the presence of hexane as co-solvent, the waste oil conversion increased with the reaction time but reached a maximum value of ca. 92.9% after 30 min of reaction. Further increase in reaction time resulted in a
[image:3.595.88.250.523.765.2](a)
[image:4.595.48.502.61.476.2](b)
Fig. 3. Sample chromatograph for a) oil before reaction and b) biodiesel containing sample after 45 min reaction at 100 °C (excluding the solvent peak)
[image:4.595.309.539.544.696.2]Fig. 4. Waste oil conversion, as function of reaction time in the absence and presence of a solvent (hexane) at 150 °C
[image:4.595.56.289.547.700.2]As the experiments were conducted in a batch reactor, a decrease in waste oil conversion to biodiesel suggests that some biodiesel that were produced during the reaction undergoes some side reactions such as glycerolysis which has been reported to happen at extended reaction times [5]. The data also show that the reaction in presence of hexane as co-solvent had higher waste oil conversions than the reaction with no co-solvent up to 45 min of reaction when side reactions affected the run with co-solvent. This improvement in oil conversion in the presence of hexane can be explained by better mass transfer in the reaction medium as a result of a decrease in viscosity by co-solvent addition. An increase in reaction temperature to 200 °C resulted in an increase in waste oil conversion (fig. 5). Conversions of 95.9 and 99.1% were measured after 15 min of reaction in the absence and the presence of hexane respectively compared to the corresponding values of 65.5 and 86.4% at 150 °C (fig. 4). Extended reaction times are not necessary at 200 °C as conversions closer to 100% were obtained after 15 min. A higher reaction temperature can decrease the viscosities of oils and result in an increased reaction rate. The data in figures 4 and 5 also show that the effect of hexane as co-solvent becomes less significant as the reaction temperature is increased. It can be seen in figure 5 that waste oil conversions for the run using hexane as solvent are comparable to those in the absence of co-solvent. As the improvement in rate of the reaction is explained here by possible improvement in mass transfer due to a decrease in the viscosity of the reacting medium, the latter is therefore affected by two factors: i) the presence of co-solvent and ii) the temperature of the reacting medium. At a lower reaction temperature, the reaction appears to be mass transfer-controlled and the addition of a co-solvent improves the waste oil conversion. However, at high temperature, mass transfer limitations appear to be reduced and the addition of co-solvent does not seem to have a significant contribution to the waste oil conversion process. From the above, it appears that hexane used as co-solvent in the conversion of waste vegetable oil to biodiesel shows some significant effects on the oil conversion only in the case where the reaction is mass transfer-controlled.
IV. CONCLUSION
The use of hexane as co-solvent in the conversion of waste vegetable oils into biodiesel increased the oil conversion at lower temperature and no significant effects were found at higher temperature. Hexane was found to only improve the oil conversion for reactions conditions which were mass transfer-controlled. The highest waste oil conversion that has been achieved in this study with ZnO/TiO2 catalyst was 99.1% after ca. 15 min of reaction at
200 °C. It was also found that the biodiesel yield is greatly influenced by the reaction temperature and time.
REFERENCES
[1] Madhuvilakku, R. & Piraman, S. 2013, "Biodiesel synthesis by TiO2– ZnO mixed oxide nanocatalyst catalyzed palm oil transesterification process", Bioresource technology, vol. 150, no. 0, pp. 55-59. [2] Wen, Z., Yu, X., Tu, S., Yan, J. & Dahlquist, E. 2010, "Biodiesel
production from waste cooking oil catalyzed by TiO2–MgO mixed oxides", Bioresource technology,vol. 101, no. 24, pp. 9570-9576. [3] Lam, M.K., Lee, K.T. & Mohamed, A.R. 2010, "Homogeneous,
heterogeneous and enzymatic catalysis for transesterification of high free fatty acid oil (waste cooking oil) to biodiesel: A review", Biotechnology Advances, vol. 28, no. 4, pp. 500-518. [4] Lee, D., Park, Y. & Lee, K. 2009, "Heterogeneous base catalysts for
transesterification in biodiesel synthesis", Catalysis Surveys from Asia, vol. 13, no. 2, pp. 63-77.