An investigation into the
behaviour of pressed-in piles
David John White
Churchill College
University of Cambridge
April 2002
A dissertation submitted for the
degree of Doctor of Philosophy
ERRATA
1) Page 5-57, Figure 5.20
The labels ‘Transition from vertical compression to extension’ and ‘Transition from horizontal extension to compession’ should be reversed.
2) Page 3-18, Equation 3.4
Corrected version of Equation 3.4:
) (
) ( ) (
s N
s R s Rn =
D
ECLARATION
I hereby declare that, except where specific reference is made to the work of others, the
contents of this dissertation are original and have not been submitted in whole or in part
for consideration for any other degree or qualification a this, or any other, university.
This dissertation is entirely the result of my own work and includes nothing which is the
outcome of work done in collaboration.
Permission to exceed the recommended limits of 65,000 words and 150 figures was
granted by the Board of Graduate Studies in their letter dated 16 April 2002, ref.
kjw/193031038/disswd. This dissertation is presented in less than the revised limits of
75,000 words and 165 figures.
D. J. White
A
BSTRACT
An investigation into the behaviour of pressed-in piles has been conducted. The press-in method of pile installation allows large pre-formed foundation piles to be constructed without the noise and vibration associated with conventional dynamic techniques, and with minimal requirement for temporary works. This investigation is divided into two parts; a fundamental study of the mechanics of press-in pile installation in sand and a sequence of field tests to examine the behaviour of pressed-in piles at full scale.
The mechanics of pile installation have been studied using a plane strain calibration chamber. A new system for deformation measurement in plane strain modelling and other forms of geotechnical testing has been developed. This system combines techniques of digital photography, Particle Image Velocimetry (PIV) and close range photogrammetry. A series of validation experiments demonstrated that the system offers greater accuracy and precision than existing measurement techniques. This improved performance is achieved concurrent with an order-of-magnitude increase in the number of measurement points that can be established within the observed soil.
A series of 8 calibration chamber tests is reported. The pattern of soil displacement during pile installation was measured. These measurements were of sufficient quality to allow soil strain paths during installation to be calculated. The influence of soil type and initial density was examined, and the post-installation strain distribution was found. The concentration of shear and volumetric strain close to the pile tip was quantified, and a reversal of strain direction as the soil passes around the pile shoulder was observed.
A zone of highly compacted soil was observed immediately below the pile tip and along the pile shaft. Contraction of this sleeve of broken soil grains was observed with continued penetration of the pile. A mechanism is proposed to link this kinematic observation to the distribution of shaft friction close to the tip of displacement piles.
A further mechanism is proposed to predict the distribution of external shaft friction along the upper part of a pile shaft. This mechanism is based on vertical arching theory, and is an extension of a previous approach for the prediction of internal shaft friction.
Four series of field tests using pressed-in piles were conducted. The first series demonstrated that internal shaft friction is well predicted by vertical arching theory. Since vertical arching evolves according to an exponential function, pile performance can be dramatically influenced by only small changes to the governing parameters. The improvement of driveability using an internal driving shoe was investigated.
A
CKNOWLEDGEMENTS
First and foremost I wish to acknowledge the supervision provided by Prof. Malcolm Bolton. Malcolm has always been generous with his time and has constantly been on hand to provide guidance and inspiration when needed. In addition, he gave me the freedom to choose my own direction by spending most of the 1st year of this research 10,000 miles away in Perth, Australia.
Secondly, without the enthusiastic technical input provided by Chris Collison and his team, I could not have completed the laboratory testing. Chris, Jason, Chrissie, Alan and John’s skills and support make the Schofield Centre an excellent laboratory in which to conduct research. Back in the Department of Engineering, Alistair Ross, Dave Pittock, Alan Bevin and John Wallis all played a part in constructing the experimental apparatus. Danny Slater made a great job of welding the calibration chamber together. Dr. Adrian Hyde of the University of Sheffield kindly provided the Dog’s Bay sand.
I am grateful to Giken Seisakusho for the opportunity to conduct field testing in Japan. A large number of staff were involved in these tests and particular thanks are due to Masaaki Katami, Takahiko Ikeda, Teruo Nagayama, Kazuo Wako, Kayoko Yamamoto and Yuichi Matsuoka. Grant Bearss of Giken America has been a very useful source of practical advice.
The geotechnical research student community in Cambridge has grown in size considerably during the past 4 years. I have benefited from this community spirit, and thank all of my colleagues, past and present. I am particularly grateful to Lis Bowman, Stuart Haigh and Andy Take- my neighbours on The Shelf. Thank you for the many drinks and discussions during the past 4 years.
Also, Dr. Kenichi Soga, Dr. Chris Martin and Dr. Aleksander Spasojevic provided useful advice during the development of the ideas in this dissertation.
Johnny Cheuk, SW Jacobsz and Xavier Borghi, when proof reading this thesis, demonstrated to me that English is best written by foreigners. Thank you, gentlemen.
I am grateful to the EPSRC for funding my extended stay in Cambridge. Churchill College contributed to the cost of attending conferences, and St John’s College elected me to a Research Fellowship during the closing months of this work. I am now checked in for a further three years of Cambridge treatment.
C
ONTENTS
Declaration i
Abstract ii
Acknowledgments iii
Contents iv
Notation xiv
Abbreviations xvii
Chapter 1: Introduction
1.1 Preface 1-1
1.2 Pressed-in piles 1-2
1.3 Prediction…. 1-2
1.4 ….and Performance 1-3
1.5 Dissertation structure 1-4
Chapter 2: Literature Review
2.1 Introduction 2-1
2.1.1 Previous piling research 2-1
2.1.2 Reliability of current prediction methods 2-2
2.1.3 Preformance, in addition to prediction 2-3
2.2 The complexity of pile behaviour 2-3
2.3 Previous observations of pile installation 2-5
2.3.1 Experiments to observe ground movements during installation 2-5
2.3.1.1 Berezantzev et al., 1961; Mikasa & Takada, 1973 2-5
2.3.1.2 Robinsky & Morrison, 1964 2-5
2.3.1.3 Chong, 1988 2-6
2.3.1.4 Davidson et al., 1981 2-6
2.3.1.5 Allersma, 1988a, 1988b 2.6
2.3.1.6 Summary 2-7
2.3.2.2 Klotz, 2000; Klotz & Coop, 2001 2-9
2.3.2.3 Wersching, 1987 2-9
2.3.2.4 Chow, 1997; Lehane, 1992 2-10
2.3.2.5 Bruno, 1999; Tomlinson, 2001: recent field data 2-12
2.3.2.6 Summary 2-13
2.3.3 Measurements of stress close to a pile 2-15
2.3.3.1 Nauroy & Le Tirant, 1983 2-15
2.3.3.2 Leung et al. 1996; Leung et al., 2001 2-16
2.3.4 Measurements of the factors affecting base resistance 2-17
2.3.4.1 Chow, 1997; Lehane, 1992 2-17
2.3.4.2 De Nicola & Randoloph, 1999; Foray et al., 1996 2-19
2.3.4.3 The influence of soil properties on base resistance 2-20
2.3.4.4 Relative density 2-20
2.3.4.5 Stress state 2-20
2.3.4.6 Compressibility 2-21
2.3.4.7 Time effects: creep and ageing 2-23
2.3.5 Measurements of the influence of installation method 2-25
2.3.5.1 Driven, bored and jacked piles 2-25
2.3.5.2 Driven piles: impact hammer vs. vibrating hammer 2-25
2.3.5.3 Driven vs. jacked piles 2-25
2.3.5.4 Jacked vs. bored piles 2-26
2.4 Pile design and analysis 2-26
2.4.1 Prediction of base capacity 2-26
2.4.1.1 Methods based on soil properties 2-26
2.4.1.2 Methods based on in situ testing 2-28
2.4.2 Prediction of shaft capacity 2-32
2.4.2.1 Methods based on soil properties 2-32
2.4.2.2 Methods based on in situ testing 2-33
2.5 Conclusions 2-34
Chapter 3: Displacement measurement technology
3.2 Measuring displacement in geotechnical models 3-1
3.2.1 A desired specification 3-1
3.2.2 Desired measurement precision: is current technology satisfactory? 3-2
3.3 Previous measurement techniques 3-3
3.3.1 X-ray film measurement 3-4
3.3.1.1 Typical system overview 3-4
3.3.1.2 Precision and area of interest 3-4
3.3.1.3 Number of measurement points 3-5
3.3.1.4 Measurement interval 3-6
3.3.1.5 Influence of measurement system on observed behaviour 3-6
3.3.1.6 Other comments 3-6
3.3.2 Photographic film measurement 3-6
3.3.2.1 Typical system overview 3-6
3.3.2.2 Precision and area of interest 3-7
3.3.2.3 Number of measurement points 3-7
3.3.2.4 Measurement interval 3-7
3.3.2.5 Influence of measurement system on observed behaviour 3-8
3.3.3 Video photography of target markers 3-8
3.3.3.1 Typical system overview 3-8
3.3.3.2 Precision and area of interest 3-8
3.3.3.3 Number of measurement points 3-10
3.3.3.4 Measurement interval 3-10
3.3.3.5 Influence of measurement system on observed behaviour 3-10
3.3.4 Review summary: the state-of-the-art 3-10
3.4 Digital photography 3-11
3.5 Particle Image Velocimetry (PIV) 3-13
3.5.1 PIV in fluid mechanics 3-13
3.5.2 PIV in soil mechanics 3-15
3.5.2.1 Natural texture 3-15
3.5.2.2 Reduced patch size 3-15
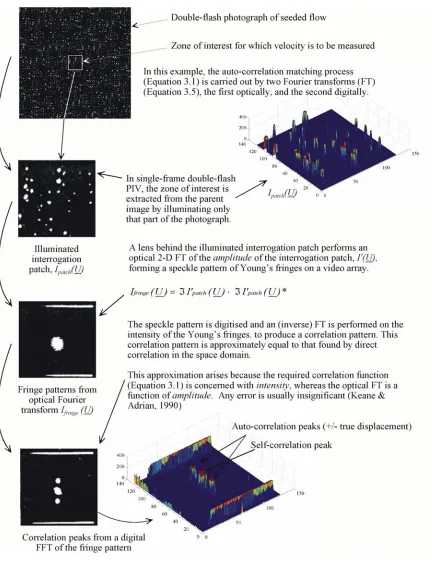
3.5.3 Matching algorithm 3-16
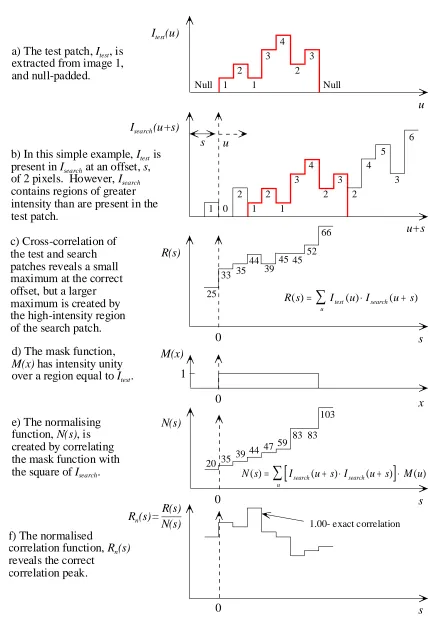
3.5.3.1 Cross-correlation 3-16
3.5.3.2 Difference minimisation 3-19
3.5.3.3 Computation time 3-19
3.5.3.4 Sub-pixel interpolation 3-20
3.6 PIV validation 3-21
3.6.1 Apparatus and procedure 3-21
3.6.2 PIV validation with sand 3-22
3.6.2.1 Procedure and analysis 3-22
3.6.2.2 PIV results: small displacement increments 3-22
3.6.2.3 PIV results: larger displacement increments 3-24
3.6.2.4 Image distortion: spatial variation in image scale 3-25
3.6.3 PIV validation with clay 3-26
3.6.3.1 Adding image texture to clay 3-26
3.6.3.2 Validation data: thresholding to define texture (White et al., 2001a) 3-26
3.6.3.3 Subsequent analysis: larger patches 3-27
3.6.4 PIV validation with target markers 3-27
3.6.4.1 Photogrammetric target 3-27
3.6.4.2 PIV measurement of sub-pixel displacement 3-28
3.6.4.3 Centroid-based displacement measurement: sources of error 3-28
3.6.4.4 Centroid-based displacement measurement: measured precision 3-29
3.6.4.5 Comparison of PIV and centroiding 3-30
3.6.5 Summary: PIV precision 3-30
3.6.6 Application to element testing 3-31
3.7 Close range photogrammetry 3-32
3.7.1 Image distortion 3-32
3.7.1.1 Is camera calibration necessary? 3-32
3.7.1.2 Non-coplanarity 3-33
3.7.1.3 Radial and tangential lens distortion 3-33
3.7.1.4 CCD non-squareness 3-34
3.7.2 Camera calibration: the image- to object-space transformation 3-34
3.7.2.1 Perspective projection 3-34
3.7.2.2 Non-linear lens distortion 3-37
3.7.2.3 Refraction 3-37
3.7.2.4 Stability of the transformation parameters 3-38
3.7.2.5 Control points 3-40
3.7.2.6 Matrix solution method and iterative procedure 3-41
3.8 Camera calibration: validation 3-42
3.8.1 Validation methodology 3-42
3.8.1.1 Conventional methods of assessing accuracy and precision 3-42
3.8.1.2 Accuracy in geotechnical modelling 3-42
3.8.1.3 Precision in geotechnical modelling 3-43
3.8.2 Evaluation of accuracy 3-44
3.8.2.1 Methodology: reconstruction of known points 3-44
3.8.2.2 Results: camera calibration 3-44
3.8.2.3 Results: camera calibration with refraction 3-46
3.8.2.4 Results: linear scaling 3-46
3.8.3 Evaluation of precision 3-47
3.8.4 Summary: camera calibration 3-47
3.9 Overall system performance 3-49
3.10 Strain formulation 3-51
3.10.1 Previous strain calculation techniques 3-51
3.10.2 Improved strain calculation technique 3-52
3.10.2.1 Rotating reference frames 3-52
3.10.2.2 Decomposition of deformation 3-54
3.11 Conclusions 3-54
Chapter 4: Model testing methodology
4.1 Introduction 4-1
4.2 Experimental concept 4-1
4.2.1 Centrifuge or 1-g? 4-1
4.2.2.1 Selection process 4-4
4.2.2.2 Field-scale equivalence 4-4
4.2.2.3 Practicality of achieving boundary condition 4-5
4.3 Chamber design and construction 4-5
4.3.1 Required specification 4-5
4.3.1.1 Boundary distance 4-5
4.3.1.2 Displacement measurement resolution 4-6
4.3.1.3 Instrumentation of model pile 4-6
4.3.1.4 Selected chamber size 4-7
4.3.2 General arrangement 4-7
4.3.3 Manufacture 4-8
4.3.4 Actuator 4-8
4.3.5 Surcharge system 4-9
4.3.6 Instrumentation 4-9
4.3.7 Influence of boundaries 4-10
4.4 Model piles 4-12
4.4.1 Design and manufacture 4-12
4.4.2 Instrumentation 4-13
4.5 Experimental programme 4-14
4.5.1 Sand properties 4-14
4.5.1.1 Crushable and uncrushable sands 4-14
4.5.1.2 Dog’s Bay carbonate sand 4-15
4.5.1.3 Leighton Buzzard Fraction B silica sand 4-16
4.5.2 Test details 4-17
4.5.3 Model preparation 4-17
4.5.4 Control points 4-17
4.5.5 Lighting 4-17
4.5.6 Test procedure 4-18
4.5.7 Post-mortem analysis 4-18
Chapter 5: Model testing results
5.2 Pile base resistance 5-1
5.2.1 Variation with pile tip depth 5-1
5.2.2 Variation with soil density 5-2
5.2.3 Variation with soil type 5-3
5.2.4 Influence of pile size 5-3
5.3 Chamber boundary stress 5-4
5.4 Overview of photographic data 5-5
5.5 Soil displacement during surcharging 5-6
5.6 Soil displacement during pile installation 5-7
5.6.1 Instantaneous velocity fields 5-7
5.6.2 Soil element trajectories during pile installation 5-8
5.6.3 Steady state deformation 5-9
5.6.4 Combination of patch columns to increase zone of observation 5-10
5.6.5 Net soil displacement during pile installation 5-12
5.6.5.1 Definition 5-12
5.6.5.2 Influence of chamber end wall 5-12
5.6.5.3 Influence of soil type 5-13
5.6.5.4 Influence of soil density 5-14
5.6.6 Net soil rotation during pile installation 5-14
5.7 Soil strain paths during pile installation 5-15
5.7.1 Mode of presentation 5-15
5.7.2 Very near field behaviour (2x0/B< 2) 5-16
5.7.3 Near field behaviour (3< 2x0/B< 6) 5-17
5.7.4 Far field behaviour (2x0/B≈ 10) 5-17
5.7.5 Volumetric strain paths 5-18
5.8 Streamlines of soil flow 5-19
5.8.1 Strain reversal points 5-19
5.8.2 Qualitative comparison with analytical solutions 5-19
5.9 Soil strain post-installation (pre-loading) 5-20
5.9.1 Spatial distribution of strain 5-20
5.9.3 Distribution of vertical and horizontal strain 5-22
5.9.4 Distribution of maximum shear strain 5-23
5.9.5 Distribution of volumetric strain 5-23
5.10 Soil strain rate during loading 5-24
5.11 Soil compression directly below pile 5-25
5.11.1 Observation of a ‘nose cone’ 5-25
5.11.2 Sampling of nose cone 5-26
5.11.3 Index properties of reconstituted nose cone soil 5-27
5.11.4 Particle breakage 5-28
5.11.5 Volumetric behaviour close to pile tip 5-28
5.12 Behaviour above pile tip 5-30
5.12.1 Additional PIV meshes 5-30
5.12.2 Soil flow around pile tip 5-31
5.12.3 Horizontal strain adjacent to pile shaft 5-31
5.12.4 Stress relief from pile shoe 5-32
5.12.5 Soil flow adjacent to straight pile 5-32
5.12.6 A contractile zone of interface shearing 5-33
5.12.7 A micromechanical hypothesis 5-33
5.12.8 Horizontal unloading and friction fatigue 5-35
5.12.9 Axisymmetric horizontal unloading 5-35
5.12 10 The influence of installation method on friction fatigue 5-37
5.13 Summary: generalised mechanism 5-38
Chapter 6: Field testing
6.1 Introduction 6-1
6.2 Plugging of tubular piles 6-2
6.3 The prediction of internal shaft friction 6-3
6.4 Fieldwork: Summer 1999 6-5
6.4.1 Site description 6-5
6.4.2 Pile and piler description 6-6
6.4.3 Pile instrumentation 6-7
6.5.1 Typical assumed profiles of external shaft friction 6-8
6.5.2 External shaft friction: the governing parameters 6-9
6.5.2.1 Recent observations 6-9
6.5.2.2 The variation of σ’v with depth 6-9
6.5.2.3 Arching: clarification of the phenomenon 6-11
6.5.2.4 Profiles of external shaft friction with vertical arching 6-12
6.5.2.5 The variation of K with depth 6-14
6.5.2.6 The variation of tan δ with depth 6-16
6.5.3 Relative magnitudes of internal and external shaft friction 6-19
6.6 Measurements of jacking force and plugging 6-21
6.7 Measurements of stress in the soil column 6-23
6.8 Optimisation of the construction process 6-24
6.8.1 Sensitivity of plug capacity 6-24
6.8.2 The use of a driving shoe to reduce K 6-25
6.8.2.1 Mechanism for the reduction of K 6-25
6.8.2.2 Finlay et al. (2001) fieldwork 6-26
6.8.2.3 Zhao et al. (2001) fieldwork 6-28
6.8.3 The use of water jetting to reduce γ’ 6-29
6.8.4 A construction process which allows arching to be ‘switched on’ 6-30
6.8.5 Fieldwork: Shinagawa, Tokyo 6-33
6.8.5.1 Test scheme 6-33
6.8.5.2 Test piles 6-33
6.8.5.3 Load tests 6-34
6.8.5.4 Force measurements during installation 6-34
6.8.5.5 Load test results 6-35
6.8.5.6 Ultimate capacity compared to installation force 6-35
6.8.5.7 Group efficiency, ζgroup 6-36
6.8.5.8 Wall efficiency, ζwall 6-36
6.8.5.9 Comparison with other measurements of group efficiency 6-38
6.8.5.10 Implications for the design of H-pile wall foundations 6-39
6.9 Conclusions 6-41
Chapter 7: Conclusions and further research
7.1 Introduction 7-1
7.2 Deformation measurement technology 7-1
7.3 Ground movements during pile installation 7-2
7.4 The behaviour of pressed-in piles 7-3
7.5 The construction of pressed-in piles 7-4
7.6 Further research 7-5
7.6.1 Improved measurement of deformations in geotechnical testing 7-5
7.6.2 The prediction of foundation behaviour: base resistance 7-5
7.6.3 The prediction of foundation behaviour: shaft resistance 7-7
7.6.3.1 Installation effects 7-7
7.6.3.2 Time effects 7-7
7.6.4 The use of pressed-in piles for large foundation structures 7-8
Appendix 1: Strain calculation procedure
Appendix 2: Random walk summation
Appendix 3: Calculation of wall friction
Appendix 4: Calibration chamber test procedure
N
OTATION
Related to geotechnical engineering
Roman
e Voids ratio
fs Shear stress on CPT friction sleeve h Distance above pile tip
hplug Length of soil column (or plug) within tubular pile p Mean pressure
qb Base resistance qc Cone tip resistance
qs Mean local shaft friction along pile length rp Pile radius
s Pile settlement t Wall thickness v Specific volume x Horizontal coordinate y Vertical coordinate
z Depth
A Area
B Pile breadth D Pile diameter
D10 10% passing particle diameter
D50 Mean (50% passing) particle diameter
E Young’s Modulus
F Flexibility ratio G Shear stiffness Gs Specific gravity ID Relative density IR Rigidity ratio
IRR Reduced rigidity ratio (Vesic, 1972) K Horizontal earth pressure coefficient L Pile length
Nq Bearing capacity factor
Pa Atmospheric pressure (101.6 kPa)
Q Capacity
R Radius
Subscripts
I, II Indicate principal directions and quantities
a Active
av Average
eng Engineering f At failure, final
h Horizontal
i Intenal
log Logarithmic
max Maximum min Minimum
o Initial, in situ conditions
o One-dimensional
o Outside (external)
p Plug
p Pile
r Radial
s Shaft v Vertical
w Wall
Greek
αcone Reduction factor on cone tip resistance β Shaft friction parameter, K tan δ
βinit Anti-clockwise inclination of bedding plane from horizontal δ Interface friction angle
δh Small change in cavity radius ε Direct strain
φ Angle of friction
ψ Angle of dilation γ Shear strain γ Bulk density
η Vertical shear transfer factor
κ Unloading stiffness (in log stress- volume space)
µ Friction fatigue decay rate (Randolph et al., 1994)
σ Direct stress
τ Shear stress
τs Local shaft friction ζ Group efficiency
∆ Change in value
∆ Volumetric compression
Related to image analysis and photogrammetry
Roman
f Focal length
k1, k2 Coefficients of radial lens distortion n Refractive index
p1, p2 Coefficients of tangential lens distortion s Search zone coordinate vector
smax Maximum component of s t Time
t Window thickness
t1, t2, t3 Translation components of PR u0, v0 Pixel coordinates of principal point
x Image-space coordinate vector (x,y), (x,y,z)
D Difference matrix
Dv, Dh CCD pixel height and width F Deformation gradient matrix
H Distance from projective centre to object plane in Z-direction I Digital image matrix
L Patch width
L Displacement gradient matrix M Mask vector or matrix (unity) N Normalisation matrix PC CCD calibration matrix PP Perspective projection matrix PR Rotation-translation matrix R Autocorrelation matrix
Rn Normalised autocorrelation matrix U Stretch matrix
U Image coordinate vector (u,v)
X Object-space coordinate vector (X,Y), (X,Y,Z)
W Width
Subscripts
CTRL Control point
Greek
α CCD pixel aspect ratio
A
BBREVIATIONS
API American Petroleum Institute
CAF Cell action factor
CCD Charge coupled device
CNS Constant normal stiffness
COV Coefficient of variation
CPT Cone penetration test
CPU Central processing unit
CSL Critical state line
DBS Dog’s Bay sand
EURIPIDES European initiative on piles in dense sands
FEM Finite element method
FFT Fast Fourier transform
FMM Film measurement machine
IC Imperial College
LBS Leighton Buzzard sand (Fraction B)
NCL Normal compression line
OCR Over-consolidation ratio
PIV Particle image velocimetry
PTFE Polytetrafluoroethylene
SPM Strain path method
SPT Standard penetration test
TX Triaxial
C
HAPTER
1
______________________________________________________________________
I
NTRODUCTION
______________________________________________________________________
1.1
PREFACE
For many thousands of years, piles have been used to support heavy structures by
transferring loads to deeper and more competent soil strata (Kerisel, 1985). The
construction of heavier, taller structures at increasingly marginal sites, and the
technological improvements of the equipment used to install piles, make the economics
of deep foundations ever more attractive (Salgado, 1995).
These technological improvements have led to a proliferation of pile types and
installation methods. Displacement piles, driven into the ground by hammering or
vibration, remain widely used for offshore and nearshore foundations. For onshore
foundations, non-displacement piles have increased in popularity during the late 20th
century since these can be installed without the noise and vibration associated with
conventional methods of pile driving. Increasingly stringent noise and vibration
legislation virtually precludes the installation of displacement piles by dynamic methods
in urban Europe and Japan.
This is a study into the behaviour of displacement piles in sand. Particular attention is
given to one novel pile installation technique: the press-in method. This is a
recently-developed pile installation technique which allows displacement piles to be installed
Chapter 1 Introduction
________________________________________________________________________________________________________
1.2
PRESSED-IN PILES
Pre-formed displacement piles can be installed by static jacking force alone if sufficient
reaction force is available. Small rigs capable of forcing micro-piles into the ground for
underpinning have been widely used for many years. Reaction is often provided by the
weight of the structure being underpinned.
A refinement of this approach is the ‘press-in method’, in which large capacity
pre-formed displacement piles are installed by static force, with reaction being provided by
adjacent previously installed piles. The static force is applied by a press-in piling
machine that stands on the advancing pile wall, ‘walking’ forward after the installation
of each pile (Figure 1.1). This technique is widely used in Japan for the installation of
sheet piles. The recent development of stronger press-in pilers has provided a new
alternative to dynamic methods for the installation of large high-capacity displacement
piles for axially loaded foundations or retaining structures.
The most obvious difference between the press-in method and conventional dynamic
methods of displacement pile installation is the reduced noise and vibration. White et al.
(2002) demonstrated that ground vibrations during press-in pile installation are more
than an order of magnitude lower than those created by dynamic methods. Also, noise
emissions from press-in pilers are below current legislative limits.
1.3
PREDICTION….
Although piles are well established as a foundation solution, their behaviour remains
one of the largest sources of uncertainty in geotechnical engineering. In spite of the
>6500 papers which have been published on this subject1, current design methods offer
low reliability (Chow, 1997) and are not based on the physical processes which govern
pile capacity (Randolph et al., 1994). As a result, large factors of safety are required in
1
Within the database of soil mechanics publications held by the Swedish Geotechnical Institute
Chapter 1 Introduction
________________________________________________________________________________________________________
design. Alternatively, costly field trials must be conducted to deduce site-specific
design parameters.
This dissertation tackles prediction by examining the mechanisms that govern pile
installation, and subsequent loading. The physical processes underlying this behaviour
are examined using controlled laboratory testing. A novel technique for quantifying the
deformation and strain induced during installation of a displacement pile is developed,
and applied to a programme of plane strain calibration chamber testing. By revealing
the life-cycle of soil elements close to a displacement pile, this testing demonstrates the
regime of soil behaviour operative during pile installation and loading. Aspects of pile
behaviour in which pressed-in piles differ from those installed by conventional methods
are highlighted.
Further investigations are carried out using field-scale test piles to examine the
prediction of plugging and installation force of pressed-in tubular displacement piles. A
comparison is made with current design methods, which are derived primarily from
experience of dynamically-installed piles.
1.4
….AND PERFORMANCE
Recent advances in construction technology have led to a variety of novel pile types and
installation techniques, including the press-in method. The study of pile behaviour has
historically concentrated on relating the in situ soil condition to the behaviour of the
completed foundation. This is the domain of prediction. A relatively small amount of
attention has been devoted to the influence of the installation method, or construction
process, on the behaviour, or performance of the foundation. In this dissertation,
performance is used to describe the influence of the installation procedure, since this
construction process can be altered and optimised, whereas the in situ soil conditions
can not.
Chapter 1 Introduction
________________________________________________________________________________________________________
force capacity of the piler. Techniques for reducing this soil resistance are examined
through field testing of instrumented piles.
Secondly, the performance of a completed pressed-in pile foundation is studied. A
novel foundation for large onshore structures is considered, in which the installation
procedure and foundation geometry are optimised to gain maximum capacity. Field load
tests demonstrate that this solution is extremely efficient. A very high capacity
foundation can be constructed using only a relatively weak piling machine, and causing
minimal environmental impact. This is high performance.
1.5
DISSERTATION STRUCTURE
Chapter 2 reviews the literature relating to axially-loaded piles in sand. The review is
divided into two parts. Firstly, previous research into the mechanics of pile behaviour is
highlighted. Secondly, current design methods for axial pile capacity are examined.
Links are drawn between the complex and often contradictory behavioural observations,
and the relative unreliability of current design methods.
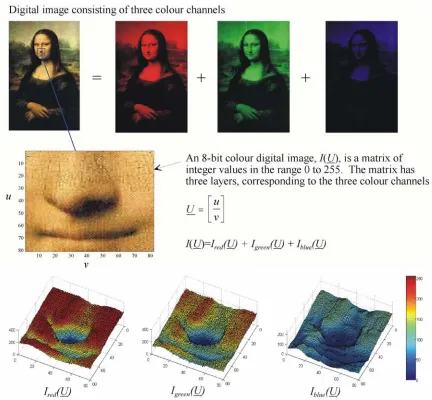
Chapter 3 describes the development of a new technique for the measurement of
displacements in geotechnical physical modelling. This technique is based on digital
imaging technology, Particle Image Velocimetry (PIV) and close range
photogrammetry. The operation and validation of the technique are described, and the
resulting performance is compared to previous experimental techniques.
Chapter 4 explains the methodology of the calibration chamber testing programme. The
design of the chamber and instrumentation is described, and the details of the test
programme are outlined.
Chapter 5 presents the results from the calibration chamber testing. A series of tests in
silica and carbonate soil are reported. The penetration mechanism is quantified,
throwing light on the origin of both base resistance and shaft friction. The pattern of soil
flow around an advancing pile is examined, and the resulting distribution of strain is
Chapter 1 Introduction
________________________________________________________________________________________________________
Chapter 6 describes the three programmes of field testing conducted in Japan during the
course of this research. The first test programme prompts an examination of shaft
friction, leading to a re-examination of the origin of this component of pile capacity.
The distribution of shaft friction inside and outside of pressed-in tubular piles is
examined within the framework of vertical arching. This leads to a study into the
optimisation of this installation method. Techniques for improving the driveability of
individual piles and the efficiency of the completed foundation are demonstrated.
Chapter 7 summarises the key conclusions from this work, and makes suggestions for
Chapter 1 Introduction
________________________________________________________________________________________________________
a) A 300 tonne press-in piler for installing b) The installation of a wall of interlocking 1000-1200 mm diameter steel tubular piles steel tubular piles near New York
Diagram courtesy of Giken Seisakusho c) A schematic diagram of a press-in piler for installing steel tubular piles
C
HAPTER
2
______________________________________________________________________
L
ITERATURE
R
EVIEW
______________________________________________________________________
2.1
INTRODUCTION
2.1.1
Previous piling research
The literature on piles is extensive. The largest database of soil mechanics publications
is held by the Swedish Geotechnical Institute (http://public.swedgeo.se/index-e.html),
and contains over 50,000 references catalogued by keyword. ‘Pile’ is the fourth most
popular keyword, after the generic terms ‘soil’, ‘clay’ and ‘test’, and features on over
6500 papers at the time of writing. Such prolific research is in contrast to the advice of
Terzaghi & Peck (1967), who stated that:
“…theoretical refinements in dealing with pile problems … are completely
out of place and can be safely ignored.”
In spite of this pessimism, pile capacity in sand represents one of the most widely
discussed topics in geotechnics, partly due to the rapidly advancing technology of pile
construction methods and partly since it remains, despite so much debate, “arguably the
area of greatest uncertainty in foundation design” (Randolph et al., 1994).
This uncertainty led the recent draft Eurocode 7 (1997), when discussing the design of
Chapter 2 Literature review
________________________________________________________________________________________________________
Class A prediction from site investigation data is considered by the Eurocode panel to
be unsafe. This Chapter examines the origin of this mistrust of pile design methods by
reviewing the current understanding of pile behaviour.
2.1.2
Reliability of current prediction methods
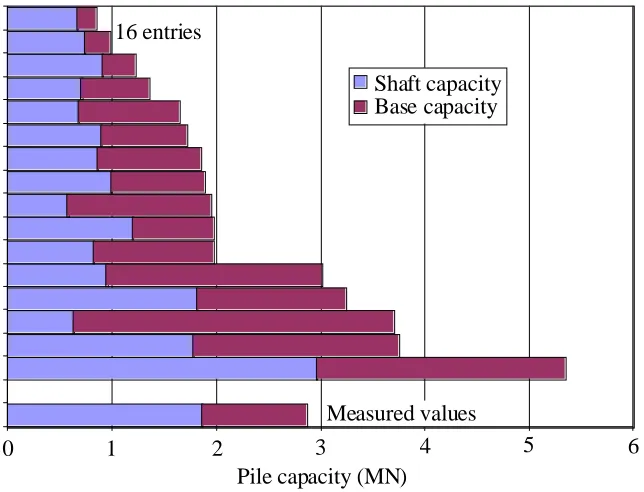
The lack of confidence in pile design methods derives from the wide range of
predictions for ultimate capacity that are produced by current methods. A prediction
contest was recently held as part of the “Geotechnics in the New Millenium”
Symposium at Imperial College, London (Jardine et al., 2001). Contestants were asked
to predict the ultimate capacity of a single 457 mm diameter tubular pile driven into
dense sand at Dunkirk, France. The design problem was well defined, without the
complications of group effects or unusual ground conditions, and the contestants were
provided with the results of an extremely thorough site investigation. However, the
scatter of predictions was wide (Figure 2.1a). This scatter is comparable with a
reliability assessment of pile design methods carried out 13 years previously by Briaud
& Tucker (1988) (Figure 2.1b). Little improvement in reliability is evident. Subsequent
publication of the winning design procedure revealed that the base capacity had been
predicted using a limit equilibrium solution first published by Berezantzev et al. in 1961
(Ground Engineering, November 1999).
To elucidate this disparity between the quantity of research output concerned with piles
and the continuing uncertainty surrounding the prediction of pile capacity, this literature
review aims to:
• outline the fundamental differences between pile behaviour and other
better-understood geotechnical processes,
• examine previous experiments that have aimed to observe the processes
underlying pile installation, and shed light on the governing variables,
• examine the assumptions and input parameters required by current pile design
methods, and
• contrast the observed governing variables with those used in current design
Chapter 2 Literature review
________________________________________________________________________________________________________
Reflecting the particular interest of this dissertation in the press-in method of pile
installation in sand, the review concentrates solely on displacement piles, and in
particular those installed by jacking into granular soil.
2.1.3
Performance, in addition to prediction
A second particular concern of this dissertation is performance. Reliable prediction can
lead to cost savings through reduced safety factors. Similarly, improved performance
through optimised construction procedures and novel installation techniques can lead to
more economic design. However, prediction methods that are wholly empirical
(category 1 in the classification system of Poulos, 1989) offer no cues for improving
performance. Instead, improvements in performance can only be derived from an
understanding of the underlying physical processes, and the influence of the installation
procedure on these processes.
Therefore, this review concentrates on studies of the ground behaviour and governing
soil parameters during pile installation, and less regard is given to research which,
although perhaps offering reliable prediction, does not provide insight into the
underlying mechanics of pile behaviour.
2.2
THE COMPLEXITY OF PILE BEHAVIOUR
The strength and stiffness of soil have a non-linear dependency on stress and strain level
and history. During the installation of a displacement pile in sand, the stress and strain
within the deforming soil vary from the in situ stress level and zero strain to tens of
MPa stress and of the order of 100% strain. The strain levels, and hence operative
stiffness ranges, experienced in other geotechnical processes are considerably lower
(Figure 2.2).
Coop (1999) highlighted the lack of understanding of the behaviour of sands at high
stress levels, as encountered during pile installation. He noted that few triaxial
Chapter 2 Literature review
________________________________________________________________________________________________________
used reference state, since a more reliable stress state linked to the critical state line or
normal compression line cannot be identified without high pressure testing.
Furthermore, whereas conventional soil constructions typically consist of a single event,
pile installation and subsequent loading is better considered as a process. This process
begins with the gross deformation during installation. The nature of this deformation
depends not only on the in situ soil properties and the geometry of the completed
foundation, but also the installation technique. Jacking is characterised by monotonic
loading and soil deformation. Hammering and vibro-installation methods are both
characterised by cyclic loading, but can yield differing capacities (e.g. Mansur &
Hunter, 1970).
The process continues with a period during which the pile head is unloaded prior to
construction of the supported building, or load testing of the completed pile. During this
period, pore pressure dissipation (e.g. Randolph & Wroth, 1979), soil ageing
(Schmertmann, 1991) and creep of locked in stresses (Åstedt et al., 1992) may occur,
with a resulting change in pile stiffness and strength. Figure 2.3 links each stage of this
process with the deformation experienced by a typical soil element.
The complex history of a soil element close to a displacement pile shown in Figure 2.3
encompasses most facets of soil behaviour. Noting the constitutive complexity of
geo-materials, and the near-impossibility of sampling and characterising each aspect, Hight
(1999) emphasised that progress is best made by determining which features of soil
behaviour control performance. This point is particularly relevant to the analysis of
piles in sand. Simplification of processes shown in Figure 2.3 by identifying the
controlling aspects is essential if pile behaviour is to be rationalised. Thereafter, only
the relevant characterisation and appropriate analysis need be conducted.
A number of experimental studies have been conducted with the aim of observing the
Chapter 2 Literature review
________________________________________________________________________________________________________
2.3
PREVIOUS OBSERVATIONS OF PILE INSTALLATION
2.3.1
Experiments to observe ground movements during installation
2.3.1.1
Berezantzev
et al.
, 1961; Mikasa & Takada, 1973
Berezantzev et al. (1961) report a series of model pile tests conducted at the Leningrad
Institute of Railway Engineers. By installing a model pile into layered sand, the pattern
of ground movement was revealed as a series of distinct slip surfaces on alternate sides
of the pile (Figure 2.4a). This observed deformation pattern motivated a limit
equilibrium solution for pile base capacity governed by angle of friction that remains
widely quoted today (e.g. Craig, 1997, Simons & Menzies, 2000).
It should be noted that the experiments of Berezantzev et al. were conducted without
surcharging the soil. With an overburden of 1 m, the in situ vertical stresses were less
than 20 kPa.
These experiments of Berezantzev et al. can be contrasted with those of Mikasa &
Takada (1973), which are geometrically similar, but are conducted both at 1-g and in a
centrifuge (Figure 2.4b). No quantitative measurement of the displacement pattern is
possible, but stereoscopic photography offers an indication of the penetration
mechanism. At 1-g the observed behaviour matches that of Berezantzev et al., with slip
surfaces extending to the ground surface. However, when the field stress level is
replicated under centrifuge conditions, a confined penetration mechanism is evident,
involving compression close to the pile tip. Mikasa & Takada attribute this to the
influence of stress level on dilatancy.
2.3.1.2
Robinsky & Morrison, 1964
A series of model pile tests are reported by Robinsky & Morrison (1964). These
followed the general format of the Berezantzev et al. tests, using dry silica sand, with
installation by jacking. An X-ray method was used to track the movement of lead shot
Chapter 2 Literature review
________________________________________________________________________________________________________
observed (Figure 2.5a), with compressive volumetric strain of up to 11% in loose sand
(initial relative density= 17%).
2.3.1.3
Chong, 1988
Chong (1988) used a penetrometer equipped with thermal probes to measure density
variations close to and at the surface of a model pile. An 18 mm diameter probe was
installed to a depth of up to 360 mm in a tank of silica sand on the laboratory floor. No
quantitative measurements of density change are reported, but four general zones of
behaviour were identified (Figure 2.5b).
2.3.1.4
Davidson
et al.
, 1981
Davidson et al. (1981) installed a model penetrometer, cut longitudinally, against the
window of a glass-sided tank of dry sand. A stereo-photogrammetric method was used
to record sand movement and deduce volumetric strain. Once again, a seemingly erratic
variation in compression was observed, with the authors stating that their study is
“primarily qualitative” (Figure 2.5c).
2.3.1.5
Allersma, 1988a, 1988b
Allersma (1988a, 1988b) studied the penetration of a plane strain penetrometer into
crushed glass using a photoelastic method to observe the principal stress directions. The
crushed glass was observed to flow around the soil tip at constant volume, with failure
occurring by a wedge-type Prandtl mechanism creating heave at the top surface. This
led to the proposition that base capacity is governed by the angle of friction, according
to conventional bearing capacity theory (Figure 2.6).
It should be noted that the Allersma probe was not installed from the ground surface,
but partially “wished in place”. The stress within the soil adjacent to the probe shaft
would be different had the pile been installed from the ground surface. Furthermore, the
constitutive behaviour of crushed glass at the stress levels experienced during the
reported testing is significantly different to that of sand during pile installation.
Although Allersma reports a similar friction angle to sand of 38º, the maximum stress
level measured close to the pile tip is 150 kPa. This value is significantly lower than
Chapter 2 Literature review
________________________________________________________________________________________________________
To reach the correct constitutive regime, a comparable state relative to the CSL or NCL
is desirable. Joer et al. (1999) note that the normal compression line of glass particles is
reached at a stress level of around 10 MPa, which is comparable to that of silica sand,
and an order of magnitude higher than that of carbonate sand. This suggests that the
stresses in experiments using crushed glass should be comparable or higher than in sand
if similitude is to be maintained.
2.3.1.6
Summary
In summary, previously conducted experiments to observe ground movements during
pile installation, with the exception of Mikasa & Takada (1973), have all taken place at
a low stress level, at which more dilatant behaviour is expected than in the field. This is
partly due to the difficulty of constructing apparatus that allows ground movement to be
observed, and which is sufficiently strong to resist the loads associated with penetration
at a realistic stress level.
Small but scattered variations in density were recorded, usually accompanied by heave.
It is not clear whether the scatter is evidence of random variations in density or random
errors in the displacement measurements. The observation of heave and shear planes at
low stress has lead to the general conclusion that pile behaviour is governed by
frictional strength, with relative density influencing the arrangement of shear planes and
the angle of friction. However, it is unlikely that the penetration mechanisms observed
in these experiments match that around field-scale piles.
2.3.2
Experiments to observe the stress distribution in and near a pile
The measurement of stress distribution in or near a pile is more straightforward than the
measurement of ground movement. Instrumented piles and buried total stress cells have
been used in a large number of research projects. In particular, the measurement of
stress rather than ground movement has previously been the only source of insight into
shaft friction. The kinematics of shaft friction are of very small magnitude; no soil
Chapter 2 Literature review
________________________________________________________________________________________________________
laboratory or the field. Instead, sophisticated load cells to measure normal and shear
stress acting on the pile interface have been developed.
This literature review does not aim to cover every reported use of instrumented piles.
Instead, the research that provides some insight into the penetration mechanism, and the
resulting development of base resistance and shaft friction will be discussed.
2.3.2.1
De Nicola, 1996; Bruno, 1999
The measurement of the shaft friction distribution on piles installed in the centrifuge is
reported by De Nicola (1996) and Bruno (1999). A model pile driving actuator was
used to install piles in-flight by hammering. Scaling similitude laws for dynamic
installation were satisfied by either reducing particle size or by using a viscous pore
fluid.
The distribution of shaft friction measured during load testing reported by De Nicola
and Bruno features a sharp decrease in local shear stress away from the pile tip. This is
coupled with a decrease in shear stress at a given soil horizon as the pile tip penetrates
further (Figure 2.7).
This characteristic behaviour is referred to as ‘friction fatigue’ (Heerema, 1980) or the
‘h/R effect’ (Bond & Jardine, 1991). De Nicola and Bruno compared their measured
profiles of shaft friction with the design approach proposed by Randolph et al. (1994).
This approach attributes the decay in local shaft friction at a given soil horizon to a
progressive reduction in horizontal earth pressure coefficient, K, with continued
shearing at the pile-soil interface. The value of K at a given soil horizon varies with h,
the vertical distance from that soil horizon to the pile tip.
The resulting design equation is shown below (Equation 2.1). The variables in this
formulation are the maximum and minimum values of horizontal earth pressure
Chapter 2 Literature review
________________________________________________________________________________________________________
• compressibility and/or crushability of the surrounding soil
• roughness of the pile surface
• incremental driving energy required to advance the pile, and
• the effective displacement ratio at the pile tip
) / ( min max
min ( )
)
(h K K K e h D
K = + − −µ (2.1)
2.3.2.2
Klotz, 2000; Klotz & Coop, 2001
Klotz (2000) designed an instrumented model pile capable of measuring radial stress in
addition to shaft friction distribution, allowing the separate influences of K and interface
friction angle, δ, on local shaft friction to be detected. The model pile was jacked into
dry carbonate and silica sands in the centrifuge.
The measured profiles of shaft friction differ sharply from those observed by De Nicola
(1996) and Bruno (1999). The maximum radial stress occurs some distance behind the
pile tip, and decays gently towards the ground surface (Figure 2.8). Klotz & Coop
(2001) note that this profile compares well with that reported by Vesic (1970), although
no mechanism to explain the observed behaviour is proposed. However, the Vesic data
was shown by Fellenius & Altaee (1995) to be polluted by residual stresses, with the
true profile likely to fall closer to the form observed by De Nicola and Bruno (Figure
2.9). The Klotz (2000) data is not influenced by residual stress since continuous
measurement of load was made throughout installation and loading, and so these
contrasting observations are unresolved.
2.3.2.3
Wersching, 1987
Earlier measurements of radial stress acting on a model pile are reported by Wersching
(1987). An instrumented model pile equipped with a “Cambridge-type” load cell,
capable of measuring both shear and normal load, was jacked into Leighton Buzzard
sand. Although hampered by the unrealistically low ambient stress level, these tests
provide an insight into the mobilisation of shaft friction during loading. Figure 2.10
Chapter 2 Literature review
________________________________________________________________________________________________________
increase in radial stress of typically 80% is evident. This variation in radial stress is
attributed to contraction followed by dilation of the soil adjacent to the pile.
2.3.2.4
Chow, 1997; Lehane, 1992
A major programme of field testing in sand using a heavily instrumented 7 m pile is
reported by Chow (1997) and Lehane (1992). The instrumented pile featured
measurement of local shaft friction and radial stress at three locations along the shaft.
Two key observations relating to the mechanism of shaft friction were made.
Firstly, ‘friction fatigue’, or the ‘h/R effect’, was quantified. Figure 2.11a demonstrates
the reduction in radial effective stress at a given soil horizon as the pile tip penetrates
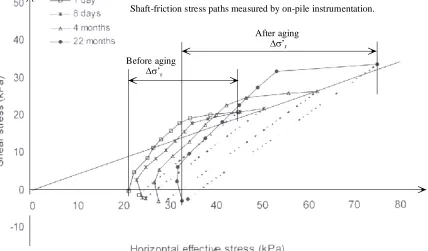
further. Secondly, the stress path during loading was quantified. A sharp increase in
radial effective stress during loading was observed, corroborating Wersching’s (1987)
observation of an increase in σ’r as failure is approached (Figure 2.10). This increase is attributed to dilation at the pile-soil interface (Figure 2.11b). The resulting design
equations are shown below (Equations 2.2-2.4). The notation is as follows:
τf Local shear stress at failure
σ’rf Local radial effective stress at failure
δf Interface friction angle at failure
σ’rc Local radial effective stress after installation and equalisation
∆σ’r Dilatant increase in local radial effective stress during loading qc Cone tip resistance
Pa Atmospheric pressure h Distance above the pile tip
R Pile radius
G Shear stiffness, estimated using Baldi et al.’s (1989) correlation with qc
δh Pile roughness, equal to 2 Rcla(twice the centreline average roughness)
(
rc r)
ff rf
f σ δ σ σ δ
τ = ' tan = ' +∆ ' tan (2.2)
(
) (
0.13)
0.380/ /
' 029 . 0
'rc= qc σ v Pa h R −
Chapter 2 Literature review
________________________________________________________________________________________________________
R h G
r 2 /
' δ
σ =
∆ (2.4)
Lehane (1992) and Chow (1997) propose that the following factors govern the ‘h/R
effect’ (Figure 2.12):
• Free surface effects: heave of soil away from the pile shaft reduces the radial
stress- i.e. a geometric effect
• Lateral pile movements during driving: ‘whipping’ or ‘gapping’ after each
impact at the pile head- i.e. a function of the installation method
• Soil’s stress history: the relative location of the soil adjacent the shaft, and the
region of high stress close to the pile tip- i.e. a geometric effect, also influenced
by the magnitude of base resistance and shape of the pressure bulb
• Cyclic stress decay: the tendency for soil elements adjacent to the pile to
collapse under the cyclic loading induced by a series of jacking strokes, or more
significantly a series of hammer blows- i.e. a function of the installation method
and the cyclic compressibility of the soil.
The governing variables, primarily installation method and soil compressibility, are in
broad agreement with those hypothesised by Randolph et al. (1994).
The change in radial stress during loading, ∆σ’r, is attributed by Chow (1997) to the following factors:
• An initial reduction in σ’r due to contraction of the soil as the applied shear
stress creates a rotation of the principal stress direction, following laboratory
observations by Symes et al. (1988). This factor is small and variable and can be
ignored during compression loading.
• A subsequent increase in σ’r due to dilation of a thin band of soil at the
interface. This is attributed to the rolling of sand particles out from roughness
Chapter 2 Literature review
________________________________________________________________________________________________________
roughness asperity height, yet no particles are allowed to roll back into the
troughs (Figure 2.13b). The effect is for the interface layer to expand a
cylindrical cavity by a change in radius equal to the peak-to-trough asperity
height.
These observations on interface dilation contrast with the observations of Dietz (2000).
In Dietz’s interface direct shear box tests, interface dilation was measured during cyclic
loading analogous to that experienced by a soil element adjacent to a pile. On each
change in the direction of shear, an initial contraction is followed by gentle dilation
(Figure 2.14). This dilation accumulates over an interface slip displacement of 20
particle sizes, rather than the single particle diameter hypothesised in Figure 2.13. The
magnitude of dilation only exceeds the contraction during the first two cycles,
suggesting that in constant volume or constant normal stiffness conditions around a pile,
the net effect would be a reduction in radial stress.
De Nicola & Randolph (1993) add a further contribution to the increase in radial stress
on loading, by noting that Poisson strains cause radial expansion and contraction of a
pile during compressive and tensile loading respectively.
2.3.2.5
Bruno, 1999; Tomlinson, 2001: recent field data
Two final examples of shaft friction distribution are from load testing of 762 mm
diameter open-ended tubular steel piles. The first load test is reported by Bruno (1999),
and forms part of the EURIPEDES project (Zuidberg & Vergobbi, 1996). This pile is
equipped with instrumentation to measure shaft friction at 12 locations along the 49 m
length. The measured distribution of shaft friction features a sharp decay away from the
pile tip (Figure 2.15a). This decay rate is comparable to Bruno’s (1999) centrifuge
modelling of driven piles, and larger than that exhibited by the shallower jacked piles of
Lehane (1992) and Chow (1997).
Tomlinson (2001) presents data from load testing of a 762 mm diameter open-ended
Chapter 2 Literature review
________________________________________________________________________________________________________
River Bridge in Bangladesh (Figure 2.15b). Once again, the shaft friction is
concentrated very close to the pile tip, decaying rapidly along the shaft.
2.3.2.6
Summary
The recent development of highly-instrumented model and field-scale piles has shed
light on the distribution of load within a pile. ‘Friction fatigue’ and changes in radial
stress during loading have been identified as key factors governing the magnitude of
shaft friction.
However, attempts to improve prediction and performance are hampered because:
• the underlying physical mechanisms are not clear
• different behaviour is observed at model and field scale
• the influence of installation method is not quantifiable
These points can be demonstrated by attempting to normalise the profiles of local shaft
friction reported above. The design approaches of Randolph et al. (1994) and Jardine &
Chow (1996) describe the variation in local shaft friction with depth using an
exponential or power law. For the purposes of this example, the Randolph et al.
approach will be used since it has a convenient variable, µ, to describe this rate of
decay.
The design framework described by Randolph et al. (1994) captures the ‘h/R effect’ by
predicting the horizontal earth pressure coefficient, K, to decay exponentially with
distance from the pile tip (Equation 2.1). Design values for µ have been deduced from
four of the sources referenced above (Table 2.1). Figure 2.16 shows normalized curves
of local shaft friction for each decay rate shown in Table 2.1, assuming Kmin = 0.2, Kmax= 1 and L/D = 20. These curves predict significantly different profiles of local shaft friction.
Chapter 2 Literature review
________________________________________________________________________________________________________
similitude condition. The different scales and embedment ratios of the pile tests shown
in Table 2.1 should offer some insight into which of the factors listed in Sections 2.3.2.1
and 2.3.2.4 govern µ.
If the initial (‘unfatigued’) local shaft friction is defined as the shear stress acting one
diameter behind the pile tip, a reference length, h50%, can be defined as the distance over which the shearing process reduces local shaft friction by a factor of 2 (Figure 2.16b).
This definition neglects any change in τmax over the short distance h50%. This reference length has been extracted from the original data reported in Table 2.1, and has been
normalised by three local length scales; pile diameter, original D50 grain size, and pile length. No clear trend is evident.
Author Description Pile size Decay rate, µ
Randolph et al. 1994)
Best fit to database of field tests Database of various L/D=15–60
0.05
De Nicola (1996)
Best fit to database of centrifuge tests.
L= 150 mm D= 16 mm
0.25 – 0.35
Bruno (1999)
Best fit to database of centrifuge tests.
L= 200 mm D=11.5 mm
0.65
Bruno (1999)
Best fit to field test. L= 45 m
D= 0.76 m
0.2
Distance from pile tip to τs= τmax/2 (h50%) Author
Actual h50% Prototype h50% h50%/D h50%/D50 h50%/L Randolph
et al. (1994)
20 m* 20 m* 13* ≈200000*
(D50 ≈ 0.1mm)
0.4
De Nicola (1996)
66 mm 6.6 m 3.7 1300
(D50 = 45 µm)
0.44
Bruno (1999)
24 mm 2.4 m 2.1 500
(D50 = 45 µm)
0.12
Bruno (1999)
4 m 4 m 5.2 ≈40000
(D50 ≈ 0.1 mm)
0.09
* Data from worked example in original reference for L= 50m, D= 1.5m.
Chapter 2 Literature review
________________________________________________________________________________________________________
The scatter of data in the lower part of Table 2.1 shows that the decay in normal
effective stress is not a direct function of absolute distance sheared (prototype or
centrifuge scale), or distance sheared normalised by pile diameter, pile length or
original D50 grain size. Therefore the geometric effects listed in Section 2.3.2.4 based on a continuum stress distribution around the pile tip do not alone govern the decay rate.
Alternative governing factors could derive from the installation method. All the pile
tests listed in Table 2.1 involve dynamic installation, and demonstrate higher decay
rates than measured during the jacked field tests of Chow (1997), indicating the possible
influence of cyclic loading during installation.
The sharply differing profiles of shaft friction distribution presented above indicate that
further research is required to understand the properties which govern friction fatigue
and the increase in radial stress during loading. This uncertainty is highlighted by
Thompson (1997), who applied the Jardine & Chow (1996) method of shaft friction
prediction to carbonate sands. Jardine & Chow’s decay rate is independent of soil type
and installation method and offers excellent prediction in silica sands
(Qcalculated/Qmeasured = 1.00, COV = 0.20). However, when applied to carbonate sands, shaft friction is dramatically overpredicted (Qcalculated/Qmeasured = 7.3) and a new set of empirical factors is required (Thompson & Jardine, 1997).
It is concluded that although current empirical prediction methods accounting for
friction fatigue can offer good reliability in the soil conditions from which they were
derived (Randolph et al., 1994; Jardine & Chow, 1996), the apparent strong influence of
installation method indicates that there is scope for improving performance. Also, a
unified understanding which encompasses both silica and carbonate sand remains to be
found.
2.3.3
Measurements of stress close to a pile
A small number of experiments have been conducted to measure the stress distribution
Chapter 2 Literature review
________________________________________________________________________________________________________
2.3.3.1
Nauroy & Le Tirant, 1983
Nauroy & Le Tirant (1983) carried out calibration chamber tests in which open- and
closed-ended piles were hammered or jacked past a buried total stress cell (Figure 2.17).
Two key observations can be drawn from this data:
• The zone of high stress surrounding the advancing pile has an approximate
extent of 10 pile diameters
• The stress level measured during jacking is approximately one third higher than
during hammering
• The stress level measured in a carbonate soil is approximately four times lower
than in a silica soil
Thus, installation method and soil type have a strong influence on the mechanism of
penetration.
2.3.3.2
Leung
et al.
, 1996; Leung
et al.
, 2001
Leung et al. (1996) report a series of centrifuge tests in which a model pile is jacked
past an array of buried vertical and horizontal total stress cells. The results follow the
general pattern observed by Nauroy & Le Tirant (1983) (Figure 2.18). ‘Locked in’
horizontal stresses are apparent after the pile tip has passed. Close to the ground surface
the vertical stress reduces to below the geostatic level after the pile has passed. At
depth, vertical stress appears to be ‘locked in’. These results may have been influenced
by cell action factor effects due to the relative movement of the load cell and the
surrounding soil.
After installation of the test pile, Leung et al. conducted a 12.5 hour maintained load
test without stopping the centrifuge. This revealed creep of the pile head, which plotted
as a straight line on settlement-log time axes (Figure 2.19a). During a su