ORIGINAL RESEARCH
HEAD & NECK
Radiologic-Pathologic Correlation of Tumor Thickness and Its
Prognostic Importance in Squamous Cell Carcinoma of the
Oral Cavity: Implications for the Eighth Edition Tumor, Node,
Metastasis Classification
XE.A.M. Weimar,XS.H. Huang,XL. Lu,XB. O’Sullivan,X B. Perez-Ordonez,XI. Weinreb,XA. Hope,XL. Tong,XD. Goldstein, XJ. Irish,X J.R. de Almeida,XS. Bratman,XW. Xu, andXE. Yu
ABSTRACT
BACKGROUND AND PURPOSE: Addressing the performance of an imaging-based parameter compared to a “gold standard” pathologic measurement is essential to achieve accurate clinical T-classification. Our aim was to determine the radiologic-pathologic tumor thickness correlation and its prognostic value in oral squamous cell carcinoma.
MATERIALS AND METHODS: All pathologic T1–T3 (seventh edition of theCancer Staging Manualof the American Joint Committee on Cancer) oral squamous cell carcinomas diagnosed between 2010 and 2015 were reviewed. Radiologic tumor thickness was measured on preoperative CT or MR imaging blinded to pathology. The radiologic-pathologic tumor thickness correlation was calculated. The impact of the imaging-to-surgery time interval and imaging technique on the correlation was explored. Intra-/interrater reliability on radiologic tumor thickness was calculated. The correlation of radiologic-versus-pathologic tumor thickness and its performance as the seventh edition T-category modifier was evaluated. Multivariable analysis assessed the prognostic value of the radiologic tumor thickness for overall survival adjusted for age, seventh edition T-category, and performance status.
RESULTS: For 354 consecutive patients, the radiologic-pathologic tumor thickness correlation was similar for the image-to-surgery interval ofⱕ4.0 weeks (⫽0.76) versus 4 – 8 weeks (⫽0.80) but lower in those with more than an 8-week interval (⫽0.62). CT and MR imaging had similar correlations (0.76 and 0.80). Intrarater and interrater reliability was excellent (0.88 and 0.84). Excluding 19 cases with an imaging-to-surgery interval of⬎8 weeks, 335 patients were eligible for further analysis. The radiologic-pathologic tumor thickness correlation was 0.78. The accuracy for upstaging the T-classification based on radiologic tumor thickness was 83% for pathologic T1 and 74% for pathologic T2 tumors. Multivariable analysis confirmed the prognostic value of radiologic tumor thickness (hazard ratio⫽1.5,P⫽ .02) for overall survival.
CONCLUSIONS: This study demonstrates a good radiologic-pathologic tumor thickness correlation. Intrarater and interrater reliability for radiologic tumor thickness was excellent. Radiologically thicker tumor was predictive of inferior survival.
ABBREVIATIONS:DOI⫽depth of invasion; HR⫽hazard ratio; OS⫽overall survival; OSCC⫽oral cavity squamous cell carcinoma; pDOI⫽pathologic depth of invasion; pTT⫽pathologic tumor thickness; rDOI⫽radiologic depth of invasion; rTT⫽radiologic tumor thickness; TNM⫽tumor, node, metastasis; TT⫽tumor thickness
T
umor thickness (TT) and depth of invasion (DOI) are inde-pendently prognostic in oral cavity squamous cell carcinoma (OSCC).1-7Although often used interchangeably, the precise def-initions of TT and DOI differ. DOI assesses primary tumorinva-siveness (measured from the adjacent normal mucosal basement membrane to the deepest point of tumor invasion), while TT represents the distance from the tumor surface to the deepest point of invasion.8Recognizing the prognostic significance and clinical relevance, the eighth edition of theCancer Staging Manual of the American Joint Committee on Cancer tumor, node,
metas-Received March 17, 2018; accepted July 9.
From the Departments of Neuroradiology and Head and Neck Imaging (E.A.M.W., E.Y.), Radiation Oncology (S.H.H., B.O., A.H., L.T., S.B.), Biostatistics (L.L., W.X.), Pa-thology (B.P.-O., I.W.), and Otolaryngology–Head and Neck Surgery/Surgical On-cology (D.G., J.I., J.R.d.A.), Princess Margaret Cancer Centre/University of Toronto, Toronto, Ontario, Canada.
S.H.H., E.Y., and W.X. contributed equally to this project.
The Bartley-Smith/Wharton Fund, the Gordon Tozer Fund, the Wharton Head and Neck Translational Fund, the Dr. Mariano Elia Fund, the Joe’s Team Fund, and the Petersen Turofsky Fund at the Princess Margaret Foundation supported the aca-demic activities of B.O., S.H.H., L.T., and W.X.
Please address correspondence to Shao Hui Huang, MD, MRT(T), MSc, Depart-ment of Radiation Oncology, Princess Margaret Cancer Centre/University of Toronto, 610 University Ave, Toronto, ON, Canada, M5G 2M9; e-mail: shaohui. [email protected]; Emilie A.M. Weimar, MD, Department Neuroradiology and Head and Neck Imaging, Princess Margaret Cancer Centre/University of Toronto, 610 University Ave, Toronto, ON, M5G 2M9, Canada; e-mail: [email protected]/[email protected]
Indicates article with supplemental on-line photo.
tasis (TNM) classification has differentiated both terms and in-troduced DOI into the OSCC T-classification.9,10
Inclusion of DOI is applicable to both clinical and pathologic T-classifications, though its prognostic value is primarily derived from surgical specimens.5Although mainly managed via an op-eration, some patients with OSCC do not undergo an operation due to the high risk, functional considerations, and personal choice. In these cases, radiologic measurement combined with clinical assessment is the only way to assess TT and DOI to stage a tumor when an operation is not undertaken. Therefore, address-ing the performance of an imagaddress-ing-based parameter compared with a criterion standard pathologic measurement is essential to achieve an accurate T-classification. Robust data confirming the reliability of measuring radiologic depth of invasion (rDOI) versus pathologic depth of invasion (pDOI) do not exist, likely due to the unavailability of the latter because insti-tutions traditionally only reported pathologic TT (pTT) not pDOI. Several studies have reported that TT measured on MR imaging11-14or CT15correlates well with pTT. However, the interrater and intrarater reliability and prognostic value of ra-diologic tumor thickness (rTT) remain elusive.
Confirming the reliability of radiologic-versus-pathologic measurement of a parameter and its prognostic value is para-mount to ensuring feasible implementation of the eighth edition clinical T-classification for OSCC. Ideally, this requires a compar-ison of rDOI versus pDOI. However, because only pTT was avail-able in our institution during the study period, we confined the radiologic-pathologic correlation to TT, though both rTT and rDOI were recorded. We hypothesized that the rTT-pTT correla-tion could be indicative of the rDOI-pDOI correlacorrela-tion. Because pTT has a similar implication for the T-classification compared with pDOI,16we further evaluated the prognostic value of both rTT and rDOI for overall survival (OS).
MATERIALS AND METHODS
Study PopulationFollowing ethics board approval, we reviewed all newly diagnosed pathologic T1-T3 (seventh edition) OSCCs treated with definitive surgery from 2010 to 2015. We included all OSCC subsites except the lip (typically different etiology [ie, sun exposure] rather than smoking/drinking).17Exclusion criteria included unavailable im-aging or pTT, a⬎12-week imaging-to-surgery time interval, or unassessable rTT due to imaging artifacts. Clinical and pathologic information was obtained from our institutional data base,18in which pTT and outcomes were prospectively recorded.
Image Analysis
Occasionally (⬍1% of cases), preoperative CT was provided from referring institutions using 5-mm collimation. Standard MR im-aging protocol in our center includes nonenhanced T1, T2, and T2 fat-saturated sequences in axial, coronal, and sagittal planes with 3-mm thicknesses. We used outside MR imaging studies that included contrast-enhanced T1 sequences. However, rTT was usu-ally assessed via nonenhanced T1 and T2 sequences in the most ap-propriate plane perpendicular to the mucosal surface. T2 fat-satu-rated images helped to identify tumor, especially if the lesion was small because such lesions are accentuated by their brighter T2 signal
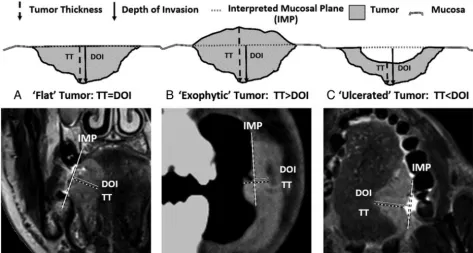
against the saturated background. Nonenhanced T1 images best de-lineated tumor margins with lower intermediate signal intensity con-trasted against the brighter (fatty) signal of the adjacent tissues. To appreciate the difference between rTT and rDOI, we also recorded rDOI, measured from an “interpreted mucosal plane” across the closest intact surface of the normal mucosa (Fig 1). If both CT and MR imaging were available, rTT and rDOI were measured on both imaging modalities. If the same imaging technique was available at multiple time points, rTT and rDOI were measured on the examina-tion most closely approximating the date of the operaexamina-tion.
MR imaging or CT or both were reviewed, and rTT and rDOI were measured by the first author (E.A.M.W.) blinded to the his-topathologic findings. To ensure consistency of radiology-pathol-ogy rTT measurements, we consulted our pathologists (B.P.-O. and I.W.), who confirmed that the maximum pTT value recorded on synoptic pathology reports represented the value measured on the slice with the thickest tumor chosen after evaluating the entire gross tumor and all slices of a specimen. In the case of rTT mea-surements, we followed the same process (ie, going through the entire series of scans to find the best orientation, axial, coronal, or sagittal, and the image slice that visually represented the “thick-est” portion of tumor to measure).
Statistical Analysis
To appreciate the practicality, we evaluated the difference in rTT and rDOI in “exophytic,” “ulcerated,” and “flat” tumor. To avoid potential confounding from tumor growth during the “wait time period” to an operation, we calculated the rTT-pTT Spearman correlation coefficient () amongⱕ4.0-, 4.0- to 8.0-, and⬎ 8.0-week subgroups to determine the acceptable time interval. To justify whether CT and MR imaging rTT measurements can be combined to increase study power, we compared the performance of CT-versus-MR imaging on the rTT assessment. Finally, to de-termine the reliability and reproducibility of rTT measurements, interrater and intrarater reliability was assessed using the Cohen coefficient in a subset of patients. Blinded rTT re-assessment by the initial interpreter (E.A.M.W.) and a second experienced neu-roradiologist (E.Y.) was undertaken after a 3-month interval.
and rDOI separately, adjusting for age, seventh edition Tumor/ Node category, and Eastern Cooperative Oncology Group perfor-mance status. We also calculated the HR of the eighth edition T-category using rTT and rDOI as the seventh edition T-category modifier, separately adjusted for the aforementioned covariates.
All statistical analyses were 2-sided, and aPvalue ofⱕ.05 was considered statistically significant.
RESULTS
Of 463 consecutive OSCCs during the study period, 109 were ex-cluded (lip tumors:n⫽6; imaging-to-surgery time interval⬎12 weeks:n⫽12; unavailable pathologic reports:n⫽26; nonassessable tumor due to imaging artifacts:n⫽65). The remaining 354 were eligible for exploratory analyses (On-line Figure).
Primary Tumor Type and Difference in rTT-versus-rDOI Measurements
Both rTT and rDOI were measured on all scans. Most (311/354, 87.9%) were flat tumors, where rTT and rDOI yielded the same measurement. Only 36 (10%) were exophytic (rTT⬎rDOI) and 7 (2%) were ulcerated tumors (rTT⬍rDOI). The median differ-ences between rTT and rDOI were 4.4 mm (range, 0.2–17.6 mm) and 1.7 mm (range, 0.1–14.4 mm) for exophytic and ulcerated tumors, respectively.
Influence of the Imaging-to-Surgery Time Interval on the rTT-pTT Correlation
To explore the potential impact of the imaging-to-surgery time interval on the rTT-pTT correlation, we stratified the 354 cases into 3 subgroups: 0 – 4 weeks (n⫽205, 58%), 4.1– 8.0 weeks (n⫽ 130, 37%), and⬎8 weeks (n⫽19, 5%). The rTT-pTT correlation
was similar between⬍4.0 weeks (⫽0.76) and 4.1– 8.0 weeks (⫽0.80) (P⫽.83), but it was nonsignificantly lower for⬎8 weeks (⫽0.62,P⫽.69).
Comparison of the rTT-pTT Correlation on CT versus MR Imaging
A total of 206 patients had preoperative CT, and 187 had MR imaging (49 had both CT and MR). While MR imaging showed slightly better correlation, the difference was minor (⫽0.80 versus 0.78 for all cases; 0.75 versus 0.67 for MR imaging/CT both available cases) after adjusting for the imaging-to-surgery interval (P⫽.83). Thus, we combined rTT on CT and MR imaging as a composite rTT for subsequent analyses.
Interrater and Intrarater Reliability for rTT Measurements
On the basis of the power calculation, 85 cases (provided at least 85% power to detect significant difference) were randomly se-lected for the intrarater and interrater reliability assessment. The intrarater and intrarater concordance of rTT was 0.88 (95% CI, 0.83– 0.92) and 0.84 (95% CI, 0.77– 0.90), respectively.
rTT-pTT Correlation and rTT as the T-Category Modifier
After we excluded 19 cases with more than an 8-week imaging-to-surgery interval due to their suboptimal rTT-pTT concordance, the remaining 335 cases (189 oral tongue and 146 other oral cavity subsites) were eligible for further analyses. The clinical character-istic of these 335 cases are listed inTable 1.
[image:3.594.55.528.48.301.2]surgery time interval was 0.78 for the entire cohort and 0.74 for both oral tongue and other subsite subgroups with shrinkage fac-tors of 0.81, 0.90, and 0.71, respectively (Table 2). Because 0.80 was the most commonly used shrinkage factor18and almost iden-tical to 0.81 derived herein, we used 0.80 as a shrinkage factor to account for potential shrinkage of tumor during specimen pro-cessing and fixation.
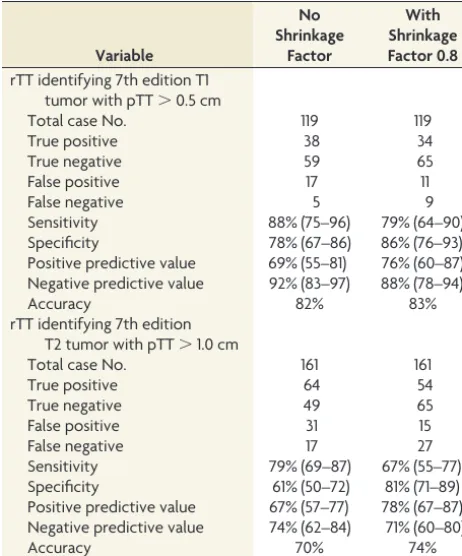
Sensitivity, specificity, positive predictive value, negative pre-dictive value, and accuracy for the ability of rTT to upstage the original size-based T-category from T1 to T2 (TT⬎0.5 cm) and from T2 to T3 (TT⬎1.0 cm), with and without correction for the shrinkage factor of 0.80, are summarized inTable 3. The overall
accuracy in the entire cohort was high for both T1 and T2 tumors (83% and 82% and 74% and 70% with and without correction for the shrinkage factor, respectively).
The Prognostic Value of rTT and rDOI for Overall Survival
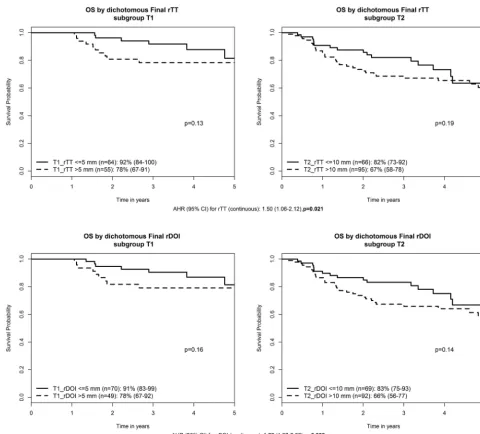
[image:4.594.59.531.55.262.2]The median follow-up was 3.6 years. A trend toward lower OS was observed in thicker tumors within each seventh edition T-cate-gory: Three-year OS for T1_rTT⬎5 mm (n⫽55) versusⱕ5 mm (n⫽64) was 78% versus 92% (P⫽.13); T2_rTT⬎10 mm (n⫽ 95) versusⱕ10 mm (n⫽66) was 67% versus 82% (P⫽.19). Only 2 T3 tumors wereⱕ10 mm, and no deaths occurred. Three-year OS for T3_rTT⬎10 mm (n⫽53) was 49% (P⫽.23). If one replaced rTT with rDOI, the results were almost identical: T1_rDOI⬎5 mm (n⫽49) versusⱕ5 mm (n⫽70) was 78% versus 91% (P⫽.16); T2_rDOI⬎10 mm (n⫽92) versusⱕ10 mm (n⫽69) was 66% versus 83% (P⫽.14). Only 3 T3 tumors had rDOIⱕ10 mm, and no deaths occurred. Three-year OS for T3_rDOI⬎10 mm (n⫽52) was 50% (P⫽.23). Multivariable analysis confirmed, similar to pTT (HR 1.38,P⫽.01), that both rTT and rDOI were prognostic for OS with HRs of 1.50 (1.06 – Table 1: Clinical characteristics of 335 patients
Covariate Entire Cohort Oral Tongue Other Subsitea PValueb
Total case No. 335 189 (56%) 146 (44%)
Age (median) (range) (yr) 62 (22–96) 60 (22–96) 64 (28–96.4) .004c
Sex .260
Female 129 (39%) 78 (41%) 51 (35%)
Male 206 (61%) 111 (59%) 95 (65%)
Smoking PY (median) (range) 10 (0–100) 5 (0–100) 20 (0–86) ⬍.001c
pT Category (7th edition) ⬍.001c
T1 119 (36%) 47 (25%) 72 (49%)
T2 161 (48%) 101 (53%) 60 (41%)
T3 55 (16%) 41 (22%) 14 (10%)
pN Category (7th edition) ⬍.001c
N0 181 (54%) 83 (44%) 98 (67%)
pN⫹ 154 (46%) 106 (56%) 48 (33%)
pTT (median) (range) (cm) 0.9 (0.1–4.0) 1.1 (0.1–4.0) 0.6 (0.1–3.9) ⬍.001c
rTT (median) (range) (cm) 1.0 (0.1–3.4) 1.2 (0.1–3.0) 0.6 (0.1–3.4) ⬍.001c
rTT on CT (median) (range) (cm) 1.0 (0.1–3.4) 1.3 (0.1–2.7) 0.7 (0.1–3.4) ⬍.001c
rTT on MR (median) (range) (cm) 1.2 (0.1–3.0) 1.3 (0.1–3.0) 0.3 (0.1–2.8) ⬍.001c
rDOI on CT (median) (range) (cm) 0.9 (0.0–3.1) 1.3 (0.1–2.7) 0.6 (0.0–3.1) ⬍.001c
rDOI on MR (median) (range) (cm) 1.1 (0.1–3.0) 1.3 (0.1–3.0) 0.3 (0.1–2.8) ⬍.001c
Note:—PY indicates pack-year; pN⫹, pathologic-positive lymph nodes. a
Other oral cavity subsite included the following:n⫽75, floor of mouth;n⫽37, buccal mucosa;n⫽16, lower alveolar and gingiva;n⫽8, retromolar trigone;n⫽6, upper alveolar and gingiva;n⫽4, hard palate.
b
Pvalue was for comparison between oral tongue and other oral cavity subsites. c
Significant.
FIG 2. Distribution of radiologic and pathologic tumor thickness.
Table 2: Radiologic-pathologic tumor thickness concordance adjusted for imaging-to-surgery time interval and diagnostic accuracy of rTT as the seventh edition T-category modifier
rTT vs pTT
Spearman Correlation Coefficient () (95% CI)
[image:4.594.52.534.316.468.2] [image:4.594.53.286.523.578.2]2.12) (P⫽.021) and 1.77 (1.22–2.56) (P⫽.003), respectively (Fig 3). Finally, when the T-category was reclassified to the eighth edition T-category using either rTT or rDOI as T-modifiers (ad-justed for age, N-category, and ECOG performance status), an incremental HR with higher eighth edition T-category was appar-ent: HRs for eighth edition T2, T3, and T4 compared with T1⫽ 1.88 (0.76 – 4.68), 2.86 (1.20 – 6.84), and 4.65 (1.86 –11.6) based on rTT (P⬍.001), and 1.67 (0.72–3.88), 2.88 (1.26 – 6.58), and 4.2 (1.77–9.95) based on rDOI, respectively (P⬍.001).
DISCUSSION
This large cohort study shows a high rTT-pTT correlation. By means of pTT as a reference, the diagnostic accuracy of rTT for upstaging seventh edition T1 and T2 tumors is good (⬎70%). An excellent intrarater and interrater reliability of measuring rTT confirms the reliability of recording this parameter in clinical practice. In addition, most OSCCs are flat tumors, in which the rTT and rDOI are identical. Both rTT and rDOI confer indepen-dent prognostic significance in addition to a size-based T-cate-gory, supporting inclusion of either parameter in the eighth edi-tion TNM classificaedi-tion. Suboptimal rTT-pTT correlaedi-tion when imaging is performed⬎8 weeks before an operation suggests that repeat staging imaging might be required to accurately depict tu-mor extent when a protracted interval to treatment occurs. While MR imaging– based rTT seems to have a slightly higher correla-tion with pTT compared with CT-based rTT, the difference was nonsignificant, permitting the combining of CT and MR imaging measurements to ensure a sufficiently large sample size.
The high rTT-pTT correlation (0.78) in this study is consistent with others.11-15,19-21The correlation was similar for both oral tongue and other OSCC subsites. We found that pTT is generally thinner than rTT, potentially attributable to tumor shrinkage
af-ter formaldehyde fixation, like findings in other studies. Most interesting, the shrinkage factor was smaller for oral tongue com-pared with other subsite tumors (0.91 versus 0.70). This was also observed by Lwin et al,13who reported shrinkage factors of 0.87, 0.65, and 0.59 for oral tongue, floor of mouth, and others, respec-tively. We hypothesized that the tongue, an organ with more free margins, has less propensity to shrink than tumors that are more deeply embedded in surrounding tissues.
Because the eighth edition TNM includes DOI for the clinical T-classification, confirming its reliability and prognostication clinically and radiologically is important because not all patients undergo an operation. Clinicians need to use both clinical assess-ment and imaging to best determine the clinical T-classification for this population. A practical challenge in assessing rDOI is the starting point of the “plumb line.” Pathologic assessment used the adjacent mucosal basement membrane, which is invisible on im-aging because the thickness of the oral mucosal epithelium is⬍0.5 mm,11representing a negligible difference between the potential originating points of measurement (mucosal surface versus base-ment membrane). Correspondingly, for practical reasons, we proposed that imaging could use an interpreted mucosal plane across the “surface” of the adjacent normal mucosa for rDOI measurement.
Our study confirmed that both rDOI and rTT are indepen-dently associated with inferior OS in addition to seventh edition T-category. When one applies rTT and rDOI to modify seventh edition T1 and T2, the separation in OS is evident (though non-significant due to an insufficient sample size). Nonetheless, the trend supports consideration of either for modification of a pre-viously size-based T-classification. Furthermore, the multivari-able analysis confirmed that both the rTT- and rDOI-based eighth edition T-categories demonstrate a clear distinction in HRs be-tween each T-category, an essential requirement for staging. Thus, rTT can be a surrogate if rDOI is unavailable. The similar prognostic performance of rTT and rDOI echoes pathology-based findings. Dirven et al16compared pTT and pDOI in 927 patients with OSCC and found that 79% of cases had a⬍1-mm difference between both parameters and prognostic performance, like those of T-category modifiers, and suggested that TT can be used as a surrogate in retrospective studies for eighth edition TNM classification.
Study limitations include its retrospective nature and unavail-ability of pDOI. pTT was obtained prospectively from synoptic reports and by convention, measured from the tumor surface to the deepest point of invasion. pDOI was unavailable as the refer-ence for rDOI. However, it was difficult to recognize whether a tumor had an exophytic or ulcerative component on imaging, and in most, rTT and rDOI were similar. Because spatial resolution remains a disadvantage on imaging compared with pathology, very thin tumors that were not reliably measurable on imaging were coded as rTT⬍1 mm for this study. Because the smallest cutoff for rDOI in the eighth edition T-category is 5 mm, this arbitrary coding is not expected to affect the reclassification of the T-category.
[image:5.594.53.284.64.342.2]Although most CT scans were obtained at our institution us-ing 2-mm slice thickness, rarely (⬍1% cases) did preoperative CT from referring institutions use a 5-mm slice thickness. On careful Table 3: Diagnostic accuracy of rTT as the seventh edition
T-category modifier Variable No Shrinkage Factor With Shrinkage Factor 0.8 rTT identifying 7th edition T1
tumor with pTT⬎0.5 cm
Total case No. 119 119
True positive 38 34
True negative 59 65
False positive 17 11
False negative 5 9
Sensitivity 88% (75–96) 79% (64–90)
Specificity 78% (67–86) 86% (76–93)
Positive predictive value 69% (55–81) 76% (60–87) Negative predictive value 92% (83–97) 88% (78–94)
Accuracy 82% 83%
rTT identifying 7th edition T2 tumor with pTT⬎1.0 cm
Total case No. 161 161
True positive 64 54
True negative 49 65
False positive 31 15
False negative 17 27
Sensitivity 79% (69–87) 67% (55–77)
Specificity 61% (50–72) 81% (71–89)
Positive predictive value 67% (57–77) 78% (67–87) Negative predictive value 74% (62–84) 71% (60–80)
review of the data, our statisticians (W.X., L.L.) determined that this difference would not significantly influence our results.
CONCLUSIONS
rTT measurement assessed by either CT or MR imaging is an acceptable representation for pTT in OSCC. rTT can upstage the seventh edition size-based T-category to the eighth-edition T-cat-egory with good accuracy. Both rTT and rDOI are independent survival predictors and can stratify risk of death in addition to traditional tumor size. Similar to pTT for pDOI, rTT can be a surrogate for rDOI. Finally, we propose using the interpreted mu-cosal plane (ie, a plane crossing an adjacent normal mumu-cosal sur-face) to measure rDOI.
ACKNOWLEDGMENTS
The author (B.O.) would like to acknowledge the O. Harold War-wick Prize of the Canadian Cancer Society for supporting his ac-ademic activities.
REFERENCES
1. Asakage T, Yokose T, Mukai K, et al.Tumor thickness predicts cer-vical metastasis in patients with stage I/II carcinoma of the tongue. Cancer1998;82:1443– 48CrossRef Medline
2. Fukano H, Matsuura H, Hasegawa Y, et al.Depth of invasion as a predictive factor for cervical lymph node metastasis in tongue carcinoma.Head Neck1997;19:205–10CrossRef Medline
3. Mohit-Tabatabai MA, Sobel HJ, Rush BF, et al.Relation of thickness of floor of mouth stage I and II cancers to regional metastasis.Am J Surg1986;152:351–53CrossRef Medline
4. Spiro RH, Huvos AG, Wong GY, et al.Predictive value of tumor thickness in squamous carcinoma confined to the tongue and floor of the mouth.Am J Surg1986;152:345–50CrossRef Medline
5. Ebrahimi A, Gil Z, Amit M, et al. International Consortium for Outcome Research (ICOR) in Head and Neck Cancer.Primary tumor staging for oral cancer and a proposed modification in-corporating depth of invasion: an international multicenter ret-rospective study.JAMA Otolaryngol Head Neck Surg2014;140: 1138 – 48CrossRef Medline
[image:6.594.50.531.43.477.2]carcinoma of the oral cavity: a meta-analysis of reported studies. Cancer2009;115:1489 –97CrossRef Medline
7. Kane SV, Gupta M, Kakade AC, et al.Depth of invasion is the most significant histological predictor of subclinical cervical lymph node metastasis in early squamous carcinomas of the oral cavity. Eur J Surg Oncol2006;32:795– 803Medline
8. Lydiatt WM, Patel SG, O’Sullivan B, et al.Head and neck cancers: major changes in the American Joint Committee on Cancer eighth edition Cancer Staging Manual.CA Cancer J Clin2017;67:122–37
CrossRef Medline
9. Amin M, Edge S, Greene F, et al.AJCC Cancer Staging Manual.8th ed. New York: Springer-Verlag; 2017
10. Brierley J, Gospodarowicz M, Wittekind C.UICC TNM Classification of Malignant Tumours. 8th ed. Southern Gate, Chichester, West Sus-sex, UK: John Wiley & Sons, Ltd; 2017
11. Iwai H, Kyomoto R, Ha-Kawa SK, et al.Magnetic resonance de-termination of tumor thickness as predictive factor of cervical metastasis in oral tongue carcinoma. Laryngoscope 2002;112: 457– 61CrossRef Medline
12. Lam P, Au-Yeung KM, Cheng PW, et al.Correlating MRI and histo-logic tumor thickness in the assessment of oral tongue cancer.AJR Am J Roentgenol2004;182:803– 08CrossRef Medline
13. Lwin CT, Hanlon R, Lowe D, et al.Accuracy of MRI in prediction of tumour thickness and nodal stage in oral squamous cell carcinoma. Oral Oncol2012;48:149 –54CrossRef Medline
14. Preda L, Chiesa F, Calabrese L, et al.Relationship between histologic thickness of tongue carcinoma and thickness estimated from pre-operative MRI.Eur Radiol2006;16:2242– 48CrossRef Medline
15. Madana J, Laliberte´ F, Morand GB, et al.Computerized tomography based tumor-thickness measurement is useful to predict postoper-ative pathological tumor thickness in oral tongue squamous cell carcinoma. J Otolaryngol Head Neck Surg 2015;44:49 CrossRef Medline
16. Dirven R, Ebrahimi A, Moeckelmann N, et al.Tumor thickness ver-sus depth of invasion: analysis of the 8th edition American Joint Committee on Cancer Staging for oral cancer.Oral Oncol2017;74: 30 –33CrossRef Medline
17. Park JO, Jung SL, Joo YH, et al.Diagnostic accuracy of magnetic resonance imaging (MRI) in the assessment of tumor invasion depth in oral/oropharyngeal cancer.Oral Oncol 2011;47:381– 86
CrossRef Medline
18. Wong K, Huang SH, O’Sullivan B, et al.Point-of-care outcome as-sessment in the cancer clinic: audit of data quality.Radiother Oncol
2010;95:339 – 43CrossRef Medline
19. Alsaffar HA, Goldstein DP, King EV, et al.Correlation between clin-ical and MRI assessment of depth of invasion in oral tongue squa-mous cell carcinoma. J Otolaryngol Head Neck Surg 2016;45:61
CrossRef Medline
20. Jung J, Cho NH, Kim J, et al.Significant invasion depth of early oral tongue cancer originated from the lateral border to predict regional metastases and prognosis.Int J Oral Maxillofac Surg2009;38:653– 60
CrossRef Medline