Building capabilities in the voluntary sector: A review of the market
Full text
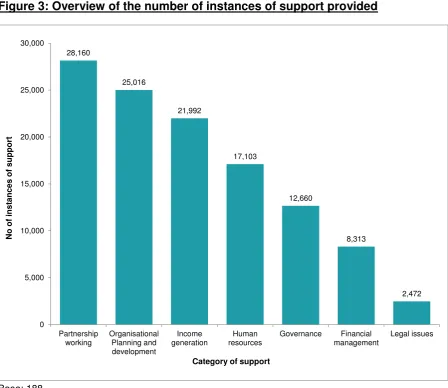
Figure


Related documents
The use of sodium polyacrylate in concrete as a super absorbent polymer has promising potential to increase numerous concrete properties, including concrete
The objective of this study was to develop Fourier transform infrared (FTIR) spectroscopy in combination with multivariate calibration of partial least square (PLS) and
Figure 3 Component planes of three parallel flue gas oxygen content measurement, scale from dark blue (low value) to dark red (high value).. As seen in Figure 4, live steam flow and
Additionally, a change in the light field (e.g., by changing the incident light) may also con- tribute greatly to the coordination of the positions of the vortex cores and the
Hence, this study was conducted to examine the distribution, diversity, role, management condition and associated traditional knowledge of underutilized wild edible plants with a
The study findings, particularly the number of factors identified, the differences between importance and feasi- bility, and the identification of several factors of import- ance
TURKMENISTAN AMANMAMMEDOV Tirkesh Turkmen National Institute of Sports and Tourism Dean of Tourism Department [email protected] Room 1 TURKMENISTAN BERDIYEVA Aybolek Turkmen
