Effects of Atomic Deviatoric Distortion on Local Glass Transition
of Metallic Glasses
Junyoung Park, Yoji Shibutani, Shigenobu Ogata and Masato Wakeda
*Department of Mechanical Engineering, Osaka University, Osaka 565-0871, Japan
The dependence of the glass transition on the local volumetric strain of each atom has been shown by Egami and others. The atomistic strain defined by the deformation tensor of the Voronoi polyhedra exhibits a different tendency from that of the total strain of the whole system. Even below the glass transition temperature, some percent of the atoms have strains that are already over the critical strain predicted by theory. In addition, the atomic deviatoric distortion has a non-zero value, while the total deviatoric distortion remains zero at the glass transition in the heat cycle. In this paper, the strain states at the glass transition, such as the volumetric strain and deviatoric distortion, are investigated for Cu and Zr based amorphous metals with three different compositions. We found that the local glass transition depends on the deviatoric distortion of atoms and, in these cases, starts at 600 K, a lower temperature, than that of the global glass transition at 1100 K.
(Received June 27, 2005; Accepted September 8, 2005; Published December 15, 2005)
Keywords: metallic glasses, glass transition, atomic strain
1. Introduction
In the three decades since the first synthesis of a system with an amorphous phase by the rapid solidification tech-nique, a great number of amorphous alloys have been
produced.1) Limitations in the achievable cooling rate
essentially restricted the dimension of the metallic glasses to a thin cross-section. Exploring this issue, Inoue reported that, for amorphous alloys, the critical cooling rate is inversely proportional to the reduced glass transition temper-ature, defined by the ratio of the glass transition temperature
to the melting temperature.2)Other researchers state that the
highest cooling rate, corresponding to the lowest reduced glass transition temperature, is as low as 0.1 K/s; the corresponding sample thickness is about 100 mm. The glass forming ability (GFA), which indicates how easy it is to make an amorphous structure, is proportional to the reduced glass transition temperature. Since the GFA, one of the most important properties relevant to the manufacturing process for an amorphous material, is a function of the glass transition temperature, a study from the point of view of the glass transition mechanism is essential.
Since the metallic bonding between atoms in metallic systems can be readily described by a central force, a simple isotropic bonding model can be applied to an amorphous metal. Thus, because eventually we need the discussion to be on the atomic scale, molecular dynamics may be the best way to simulate the glass transition. There have been a lot of research on the glass transition using molecular dynamics or other theoretical approaches, such as local topological instability, free volume theory and percolation
concentra-tion.3–5)Egami’s intuitive theoretical analysis starts with the
local topological instability. In this approach, the local instability is described by the geometric changes in the
system; i.e. volume expansion is discussed in terms of
changes in the volume occupied by atoms. This local instability is often represented by atomic volumetric strain, instead of volume expansion. And, one of the three empirical
rules suggested by Inoue also points out the limitation of size ratio, namely that the atomic radius ratio between two atoms
must exceed a 12% size difference.2)Now, it is clear that the
glass transition depends on the local topological instability described in terms of atomic volumetric strain. The glass transition temperature can be calculated from the critical atomic volumetric strain created by the local instability, the averaged local volume, the bulk modulus of atom, and the Boltzmann constant. Egami’s approach employs the atomic hydrostatic pressure, rather than the atomic level strain, and is based on the assumption of a constant bulk modulus, as the measure to describe the degree of randomness of the dense,
random-packed structure.6)In spite of relatively unrealistic
assumptions such as a dependency on geometric factors alone and the adoption of hydrostatic pressure, the results show a
good agreement with experiment. For instance, for Fe80B20
his procedure gives Tg¼652K, which compares well with
the experimental value of 660 K.
As described in the local topological instability theory, a glass transition should be accompanied by a coordination
number change and perhaps an atom position exchange.3)
However, an atom position exchange accompanies the deviatoric distortion and volume expansion. Alternatively, the glass transition theory has been explained by the free volume (volume expansion) and by diffusion which is in inverse proportion to the viscosity (deviatoric distortion). In particular, Egami and others point out that there can be two glass transitions, corresponding to the freezing of, first, the shear stress fluctuations and, second, the pressure
fluctua-tions.7)
On the basis of the local topological instability, Egami has developed a theory of atomic transport, based on nearest
neighbor bond-exchange.8) As a result of this process, the
system undergoes a shear transformation. The existence of such a bond-exchange process is experimentally confirmed by an X-ray diffraction study of anelastically deformed
metallic glass ribbons.9) In spite of the importance of
twofold: first, to compare the calculated critical strain states in terms of local topological theory and by the critical strain values obtained from global molecular dynamics simulations and second, to present the status of atomic strains from the local point of view. In addition, it includes a discussion of the local deviatoric strain distribution, which previous studies could not address, implications of the local (atomic) strain values.
2. Computational Model
The 2000-atom Cu64Zr36 system is chosen as a
represen-tative model since it is known to easily adopt an amorphous
structure.10)As a basis for comparison, we have included the
Cu57Zr43 and the Cu71Zr29 systems which have slightly
different compositions. We employ molecular dynamics study using modified Lennard–Jones potential.
In the first step, copper and zirconium atoms are randomly positioned in a 3 nm cubic cell. Then, for 100 ps, the cell is fully relaxed using periodic boundary condition at 300 K and a 1fs timestep. Figure 1 represents the final structure obtained after the relaxation. Note that the small atoms are copper and the others are zirconium. The density of the relaxed atom
configuration of Cu64Zr36is 7.398 g/cm3, as compared to the
experimental value of 7.382 g/cm3 for Cu
57Zr43.11)In order
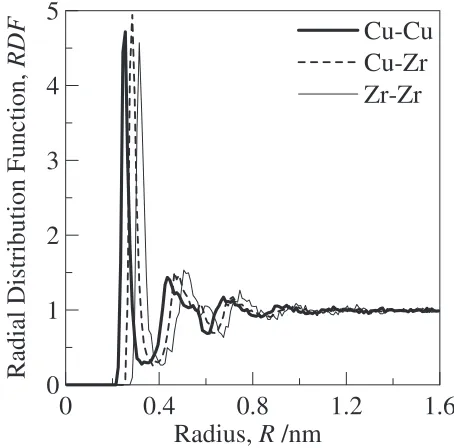
to validate this model, we also measured the Radial Distribution Function (RDF) shown in Fig. 2. The first peak
obtained from the Cu64Zr36 system shows a maximum at
0.255 nm for Cu–Cu, 0.285 nm for Cu–Zr, and 0.315 nm for Zr–Zr distances; experimental values are 0.265 nm for Cu–
Cu, 0.280 nm for Cu–Zr, and 0.315 nm for Zr–Zr.12) As
shown in Fig. 2, the second peak is split in two, with the intensity of the former first peak larger than the second. It is already known that this splitting is characteristic of the
metallic glasses.12)In order to save time in reaching the glass
transition temperature, we chose a heating process from 300 K to the over-melting temperature rather than a cooling process from the over-melting temperature to 300 K. Both
processes, the cooling process and the heating process, show almost identical results. The heating proceeds in a stepwise
fashion, with increases of 1 K, and includes 103 annealing
steps, a rate corresponding to 0.001 K/fs.
3. Theoretical Approach
At this point, we provide the essential background needed for the definition of the atomic strain tensor and critical strains based on local topological instability theory.
3.1 Atomic strain
To clarify the glass transition mechanism, most research has focused on the atomic behavior of the material. In spite of
such efforts, many unknowns remain,e.g.the distribution of
the atomic strain, and the exact state of the strain tensor. These difficulties arise from the fundamental assumption of the strain definition, the ‘continuum’ assumption: the atomic strain cannot be defined as it would be in continuum mechanics, because the continuum assumption is already contravened at the atomic scale.
However, there is still a way, suggested by Mott and others, to define the atomic strain that relies on another assumption: that materials consist of continuous atomic
volumes known as Voronoi polyhedra.13)An arrangement of
atoms is tessellated into Delaunay tetrahedra and Voronoi polyhedra, representing interstices and atomic domains, respectively. The displacement gradient tensor for the interstitial space can be defined as the displacement incre-ment of the corner atoms of the Delaunay tetrahedra. The atomic site strain tensor is then obtained from the common volume between the Delaunay tetrahedra and the Voronoi polyhedra, accumulating the individual displacement gradi-ent contributions of the intersected Delaunay tetrahedral into the Voronoi polyhedra. A more detailed procedure can be
found in the reference provided.13)Now, we can expect two
Fig. 1 Fully relaxed atomic configuration of the model system, Cu64Zr36.
The smaller atom is copper. The others are zirconium.
0
0.4
0.8
1.2
1.6
0
1
2
3
4
5
Radial Distribution Function,
RDF
Cu-Cu
Cu-Zr
Zr-Zr
Radius,
R
/nm
Fig. 2 Radial distribution function (RDF) for the Cu64Zr34model, showing
[image:2.595.312.539.75.299.2] [image:2.595.65.274.75.272.2]strain, "cell. Note that "cell cannot be equal just to the
summation of "atom. Instead, the equality of cell strain and
atomic strain can be given by:
Vcell"cell¼ X atoms
V"
"cell¼ X atoms
V Vcell"
¼ X
atoms
f" ð1Þ
where f is the volume fraction of each atom, and,V and
Vcell are the volumes of each atom and cell, respectively.
Thus, the total strain of a cell must be equal to the summation of the product of the volume fraction and the atomic strain. A direct comparison between the total cell strain and the atomic strain is meaningless, since, to compare two strains, the distribution of the atomic volume should be considered. Therefore, a difference could exist between the average of atomic strain and total cell strain. The average atomic strain can be equal to the total cell strain only when the volume of each atom has a uniform distribution. However, in real measurement compared to actual measurements, eq. (1) shows a negligible inequality below 1%.
In order to represent the deviatoric distortion, we express the octahedral strain as follows:
oct2 ¼1
3Tr "i j
1
3"Vi j
ð2Þ
where"V is the volumetric strain. This definition and more
detail concerning it can be found in any textbook. It is assumed that the reference state for the strain measurement is the atomic configuration at room temperature, 300 K.
To validate the developed program, we perform two example calculations: a uniaxial tension and simple shear test for perfect crystal materials. For the uniaxial tension, a 1%
strain is applied to theXdirection. The obtained strains,"xx,
for each atom have a distribution between 0.99 and 1.01%. The error is below 1% of the applied strain. In the simple
shear test, a 2% shear deformation is employed on the x–z
plane. The distribution of "xz for each atom also returns a
value between 1.99 and 2.01%. The other components of the strain tensor are negligible below 0.001%. In general, the magnitude of the error strongly depends on the atomic strain,
i.e. the deformation of the Delaunay tetrahedron. In
partic-ular, if there is extreme local deformation around a tetrahedron consisting of 4 atoms, the error could be over the limit, which here is 1%, because of a volume mismatch. This limitation prohibits measuring the strain after melting or a glass transition with accompanying severe atomic move-ment.
3.2 Local topological instability14)
The following constitutes a brief introduction to Egami’s
theory. More details can be found elsewhere.14) The main
idea of this theory is that there is a critical volumetric expansion threshold beyond which the local atomic structure changes its topology. The local topology of the structure can
be estimated by the number of nearest neighbors,i.e.by the
local coordination number. The starting point of this theory is the area occupied by each atom, defined by the solid angle
embedded atoms (RB), that is used to calculate the
coordi-nation number (NC). The volume change for topological
instability, then, is accompanied by an integer change in the
coordination number. Thus, the amount of change inx, which
is the radius ratio,RA=RB, is needed to bring about the change
inNC; it is given by
xC¼
1
2
@x
@NC
¼ 1 4
ðxþ1pffiffiffiffiffiffiffiffiffiffiffiffiffiffiffiffixðxþ2ÞÞ2pffiffiffiffiffiffiffiffiffiffiffiffiffiffiffiffixðxþ2Þ
2pffiffiffi3 : ð3Þ
From this equation, the critical volumetric strain for local
topological instability,"critV , is given by
"critV ¼3xC
2x : ð4Þ
It is noteworthy that the critical volumetric strain, "crit
V , is
0.0554, when RA¼RB, i.e. x¼1. The total energy of the
given system can be expressed in terms of the associated elastic energy by the mean-field approximation:
E¼ 2K
X
ðpÞ2þ
4G
X
ðÞ2 ð5Þ
where , K, G, and are the atomic volume, the bulk
modulus, the shear modulus and the number of atoms. According to the virial theorem, one-half of the thermal
energy, 3kBT, becomes potential energy, which is evenly
distributed among the six components of the atomic level stress energies. The average of the volume fluctuation is given by
2Khp
2i ¼ 4Gh
2i ¼kBT
4 ð6Þ
where the parenthesis means the average of the properties,
and kB and T are the Boltzmann constant and the
temper-ature. If the local pressure exhibits a Gaussian distribution with a standard deviation, the averaged pressure can be obtained as:
p¼ hp2i1=2¼ KkBT 2
1=2
ð7Þ
Since the local volume strain is expressed as "V ¼p=K
where K is the local bulk modulus for atom , it has a
normal distribution.
We finally reach the glass transition temperature,Tg, in the
following equation:
Tg¼ 2K
kB
ð"critV Þ2 ð8Þ
whereis the atomic volume,Kis the bulk modulus andkB
is Boltzmann’s constant. Using the first and second terms in eq. (6), we can define one more criterion for deviatoric deformation as follows:
hp2i
K ¼
h2i
2G ð9Þ
where p¼K"V,¼G, and is the deviatoric strain. The
2¼2K
G "
2
V ¼
4ð1þÞ
3ð12Þ"
2
V: ð10Þ
Here,is Poisson’s ratio, which is equal to 0.25 for a central
force system.7)
Therefore,
¼
ffiffiffiffiffiffi 10
3 r
"V ð11Þ
Note that the critical deviatoric strain corresponding to the
critical volumetric strain,c, is 0.1011. We do not have any
physical interpretation for this relation. This equation, however, could provide some basic understanding of the relationship between the deviatoric strain and the volumetric strain. On the other hand, because it contains a relatively unrealistic assumption, it is too simple to offer quantitative accuracy.
4. Results and Discussion
4.1 Global view
First, we report the overall behavior at the glass transition. We examined the strain state of atoms from an initial state at 300 K to the glass transition state at 1100 K. Figure 3 shows
the change in the averaged atomic volume for Cu64Zr36,i.e.
the total cell size divided by the number of atoms, versus
temperature. We plot the results only for Cu64Zr36, since all
the models studied show almost the same tendency and glass transition temperature. As the temperature rises from 300 K,
corresponding to an averaged atomic volume of 0.0163 nm3,
the volume increased almost linearly. At around 1100 K, as reported by other workers, the slope of the volume increases changes; this point of slope change is taken to be the glass transition. All the models studied here have almost identical glass transition temperatures. Further, we found that this point can be reproduced by either a heating process or a
cooling process, when they are fully relaxed. After the glass transition point, the volume monotonically increased with further increase in temperature to beyond the melting point. To obtain the volumetric expansion of the cell, we measure
the volumetric strain, "V, using the developed atomic strain
program to obtain the results shown in Fig. 4. Up to 600 K, the volumetric strains of each cell rises monotonically, with almost identical results for materials of different composi-tion. Above this temperature, the three models start to be distinguishable. This temperature could be regarded as a starting point of the local glass transition because the percentage of atoms with deviatic strain that exceeds the critical value. We will discuss this point in more detail later. In this context, the local glass transition represents the local structural relaxation. It is also noteworthy that the volumetric strains in each model will produce a bumpy area, such as
700–800 K at Cu57Zr43, 900–1000 K at Cu64Zr36 and 800–
900 K at Cu71Zr29as seen in Fig. 4. In spite of the presence of
these features in the plot, they cannot be correlated with distinguishable atomic configurations or with other measure-ments at those temperatures. However, such features also can be found in the results of calculations using modified LJ potentials for a totally different system, that of pure
amorphous Fe.15)Unfortunately, we do not have any physical
interpretation for this phenomenon in this time. The volumetric strains corresponding to 1100 K are 0.045,
0.055 and 0.056 for Cu57Zr43, Cu64Zr36 and Cu71Zr29,
respectively. These strain values are almost same as the
critical volumetric strain of 0.054 suggested by Egami,14)
except in the case of Cu57Zr43. This exception might arise
from the similarity of the copper and zirconium composition, having just a 10% difference. Furthermore, the glass transition temperature obtained here (1100 K) compares closely with that of 1044 K calculated for a copper atom surrounded by copper atoms, using eq. (8). Although there are many possible ways to make a combination of a central atom surrounded by two types of atoms, copper and zirconium, the combination of a central copper atom surrounded by only copper atoms is adopted because of the majority of copper atoms in the material.
We adopted the octahedral strain to represent the devia-toric distortion. In the global view, the octahedral strain is
zero because all of the deviatoric components, "i j, are zero
0
1000 2000 3000 4000 5000
Temperature
T
/K
0.016
0.02
0.024
0.028
0.032
Averaged Volume of Atom, /nm
3
Fig. 3 The relationship between the averaged atomic volume and temper-ature. The point where the slope changes is known as the glass transition point.
0 0.01 0.02 0.03 0.04 0.05 0.06 0.07 0.08
0 200 400 600 800 1000 1200 Temperature, T /K
Volumetric Strain,
V
Cu57Zr43 Cu64Zr36 Cu71Zr29
ε
[image:4.595.315.541.76.223.2] [image:4.595.55.282.533.747.2]not accompany any deviatoric distortion. However, in the atomic view, each atom has its own deviatoric component of strain.
4.2 Local view
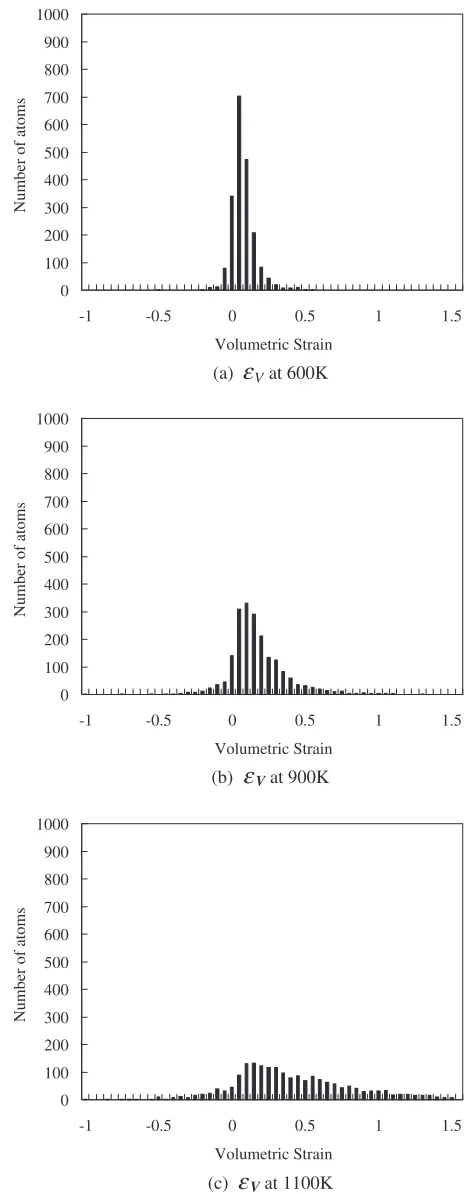
Figures 5(a), (b) and (c) respectively depict the
distribu-tion of the volumetric atomic strain, "V, at 600, 900 and
1100 K (glass transition temperature) of Cu64Zr36. To avoid
redundancy, we omit the results for Cu57Zr43 and Cu71Zr29,
as their distributions are almost identical. As expected, the range of atomic strain distribution is narrow at 600 K because the amount of thermal volume expansion is still small. However, as the temperature goes up to 1100 K, the distribution becomes wider and flatter, the range of the
distribution changing from 0:25 þ0:5 at 600 K to
0:5 þ1:5 at 1100 K. However, the extent of the range
in the minus direction, corresponding to volume contraction, is apparently narrower than in the plus direction, correspond-ing to volume expansion. It is natural that the atomic volumetric strain is concentrated on the expansion part during the thermal expansion process. Because of the asymmetric range extension, the distribution exhibits a step near zero strain. This distribution of atomic volumetric distribution does not seem to have the expected Gaussian distribution.
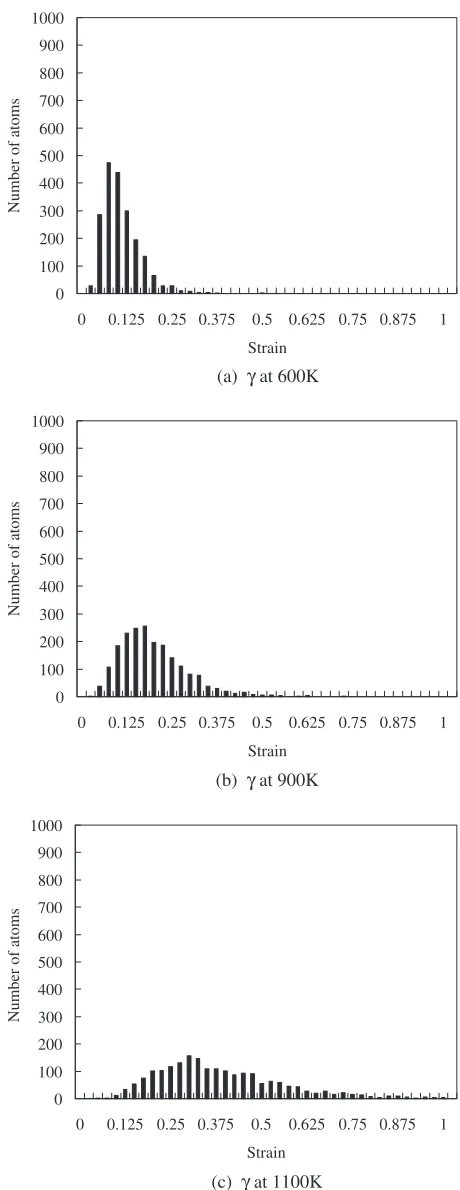
Although the deviatoric strain for a cell is zero, the deviatoric strain for each atom has the distributions shown in Figs. 6(a), (b) and (c), corresponding respectively to
temper-atures of 600, 900 and 1100 K for Cu64Zr36. At low
temperatures, most of the atoms have very small positive value of deviatoric strain since octahedral strain is always positive. However, the peak strain moves to higher strain values as the temperature rises. In addition, the range of the deviatoric strain becomes wider with temperature in a similar manner to the volumetric strain.
Based on the agreement between the theoretical and global values of the critical strain, we measure the percentage of atoms having volumetric strain over the critical value of 0.055 or 5.5%, as shown at Fig. 7. Note that the atomic strain
state of Cu71Zr29at 1100 K is not presented here, because the
error is already over the limit at that temperature. Like the volumetric strain of a cell, the percentage linearly increased with temperature until 700 K. Then, from 800 K, the slope lessens. Even at the low temperature of 400 K, 15% of the atoms have already reached the critical volumetric strain. The number of atoms starts to saturate over 800 K, and the percentage reaches over 80% at the glass transition temper-ature of 1100 K. We also find that the variation of the percentage with temperature is similar for both copper and zirconium atoms. Hence, the ratio of atoms of different types with volumetric strains exceeding the critical value is independent of temperature.
On the other hand, the percentage of number of atoms with deviatoric strain over the critical value is presented in Fig. 8. The critical deviatoric strain is 0.1011, a value corresponding to the critical volumetric strain. Since the local glass transition involves diffusion processes, it could be possible that the deviatoric strain abruptly increases when the local glass transition starts. The local glass transition should be
accompanied by volume expansion and deviatoric distortion on the atomic level, while the deviatoric distortion of a cell is zero. Before an atom occupies enough volume to make diffusion possible, its deviatic distortion will be small, because there has been no change in atom positions. However, when the atom has enough space to move, it will
0 100 200 300 400 500 600 700 800 900
-1 -0.5 0 0.5 1 1.5
Volumetric Strain
Number of atoms
(a)
ε
V at 600K0 100 200 300 400 500 600 700 800 900 1000
-1 -0.5 0 0.5 1 1.5
Volumetric Strain
Number of atoms
(b)
ε
V at 900K0 100 200 300 400 500 600 700 800 900 1000
-1 -0.5 0 0.5 1 1.5
Volumetric Strain
Number of atoms
(c)
ε
V at 1100K [image:5.595.308.543.71.668.2]result in an increase in the deviatic distortion. As expected, the deviatoric strain suddenly increased over a short range of temperature, from 15% at 500 K, to 85% at 800 K. Above that temperature the strain starts to be saturated. Hence, the local glass transition will start around 500 K, while the global glass transition does not occur until 1100 K.
Figure 9 depicts the root-mean-square (RMS) value of the atomic volumetric strain at each temperature. We choose the RMS value rather than the average since atomic volumetric strain has a distribution that encompasses both minus and plus values. In addition, some studies suggest that the glass transition occurs when the RMS of the volumetric strain is 0
100 200 300 400 500 600 700 800 900 1000
0 0.125 0.25 0.375 0.5 0.625 0.75 0.875 1
Strain
Number of atoms
(a) γ at 600K
0 100 200 300 400 500 600 700 800 900 1000
0 0.125 0.25 0.375 0.5 0.625 0.75 0.875 1
Strain
Number of atoms
(b) γ at 900K
0 100 200 300 400 500 600 700 800 900 1000
0 0.125 0.25 0.375 0.5 0.625 0.75 0.875 1
Strain
Number of atoms
(c) γ at 1100K
Fig. 6 The distribution of atomic deviatoric strain for Cu64Zr36.
0% 10% 20% 30% 40% 50% 60% 70% 80% 90% 100%
0 200 400 600 800 1000 1200 Temperature, T /K
Percentage of atoms over
εc Cu57Zr43
Cu64Zr36 Cu71Zr29
Fig. 7 The percentage of atoms with volumetric strain in excess of the critical value. At the glass transition temperature, the percentage reaches approximately 80%.
0% 10% 20% 30% 40% 50% 60% 70% 80% 90% 100%
0 200 400 600 800 1000 1200 Temperature, T /K
Percentage of atoms over
γc Cu57Zr43
Cu64Zr36 Cu71Zr29
Fig. 8 The percentage of atoms with deviatoric strain in excess of the critical value. At the glass transition temperature, the percentage is approximately 100%.
0.0 0.1 0.2 0.3 0.4 0.5
0 200 400 600 800 1000 1200
Temperature, T /K
Root Mean Square of
V
Cu57Zr43 Cu64Zr36 Cu71Zr29
ε
Fig. 9 Root–mean–square (RMS) of the atomic volumetric strain,"V, at
[image:6.595.53.283.69.664.2] [image:6.595.313.543.75.223.2] [image:6.595.313.543.289.438.2] [image:6.595.313.544.507.656.2]equal to the critical volumetric strain.6) If the atomic volumetric strain has a Gaussian distribution increased, the percentage of atoms over the critical volumetric strain should be 15%. And this fraction happens to correspond to the
percolation concentration for a close-packed sturucture.5)
Unfortunately, we cannot compare our results with this value since the distributions we found do not follow a Gaussian distribution and the definition for atomic volumetric strain is different. The volumetric strain we obtained reaches 0.055 around 600 K, a value that coincides with the critical local volumetric strain suggested by Egami. It is noteworthy that temperature-dependence of the volumetric strain is a non-linear increase while that of the total volumetric strain of a cell increases linear. This difference could be related to the distribution of the volumetric strain, in that the strain distribution is skewed to higher values of strain at higher temperatures.
The averaged atomic deviatoric strain is presented in Fig. 10. Although this is the averaged value, it has the same statistical meaning as the RMS value, because the deviatoric strain is always positive. Like the volumetric strain (Fig. 4), the deviatoric strain also shows a non-linear increase with temperature. However, this is to be expected as eq. (11) shows that the deviatoric strain is proportional to the volumetric strain. The deviatoric strain also reaches the critical value of 0.1011 at around 600 K. The deviatoric strain is unaffected by composition below 600 K, but above that temperature, the curves for different compositions part company.
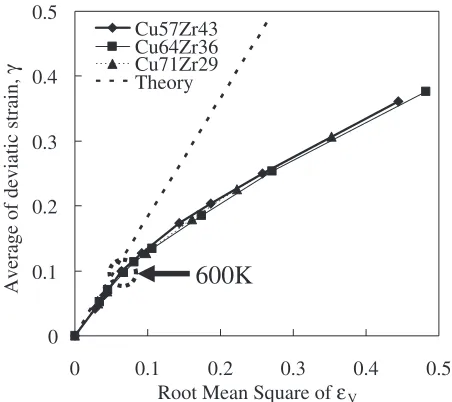
In order to check the proportionality between volumetric strain and deviatoric strain, the plot for the RMS of volumetric strain vs. the average of deviatoric strain is presented in Fig. 11. In the figure, the dashed line without any markers represents eq. (11). As can be seen in the figure, the theoretical curve and the calculated results show reasonable agreement until an atomic volumetric strain of 0.055 and an atomic deviatoric strain of 0.1, corresponding to a temperature of 600 K. However, beyond that point, the measured results start to be diverged from the line predicted by eq. (11). The strain state at the point of divergence at 600 K also coincides with the critical local volumetric and deviatoric strain.
5. Conclusion
The theoretical approach suggested by Egami, and the atomic strain approach suggested by Mott have both been
applied to the glass transition process for Cu57Zr43, Cu64Zr36
and Cu71Zr29. In the global view, the glass transition of each
material occurs at 1100 K, corresponding to a volumetric strain of 0.055 in molecular dynamics computations. This shows reasonable agreement with the results, 1044 K and 0.054, computed using the local topological instability theory. The volumetric strains of a cell start to depend on its composition above 600 K, which temperature can be regarded as the starting point of glass transition. This temperature assignment is supported by the observation of a jump in the plot of the percentage of atoms with critical deviatoric strain at 600 K. In addition, the strain states at 600 K on the curve of volumetric or deviatoric strain versus temperature coincide with the critical values of 0.055 for volumetric strain and 0.1011 for deviatoric strain. Finally, the plot for the volumetric strain vs. deviatoric strain also starts to diverge at 600 K from the expected linearity. However, just about 45% of atoms have strains greater than these critical values until 600 K. In the global view, the numbers of atoms with strains over the critical values are not yet saturated. By 1100 K, where the global glass transition occurs, the degree of saturation of the atoms with strains over the critical value reaches 80% for volumetric strain and 95% for deviatoric strain.
Acknowledgement
We gratefully acknowledge support from the Ministry of Education, Culture, Sports, Science and Technology in Japan, Grant-in-Aid for Scientific Research on Priority Areas (15074214). We thank Dr. Mott and Professor Argon for providing the source code to find atomic strain. We also thank Professor Egami for valuable advice.
0.0 0.1 0.2 0.3 0.4
0 200 400 600 800 1000 1200
Temperature, T /K
Average of deviatoric strain,
γ Cu57Zr43
[image:7.595.314.540.73.274.2]Cu64Zr36 Cu71Zr29
Fig. 10 Average of the atomic deviatoric strain at each temperature. Note that the deviatoric strain is always positive, using the same definition as for octahedral strain.
600K
0 0.1 0.2 0.3 0.4
0 0.1 0.2 0.3 0.4 0.5
Root Mean Square of εV
Average of deviatic strain,
γ
Cu57Zr43 Cu64Zr36 Cu71Zr29 Theory
[image:7.595.57.284.76.223.2]REFERENCES
1) W. Klement, R. H. Wilens and P. Duwez: Nature187(1960) 869. 2) A. Inoue: Acta Mater.48(2000) 279–306.
3) T. Egami and Y. Waseda: J. Non-Cryst. Solids64(1984) 113–134. 4) D. Turnbull and M. H. Cohen: J. Chem. Phys.52(1970) 3038–3041. 5) R. Zallen:The Physics of Amorphous Soilds, (Wiley, New York, USA,
1983) pp. 170–171.
6) T. Egami: Mater. Sci. Eng.226–228(1997) 261–267. 7) T. Egami and D. Srolovitz: J. Phys. F12(1982) 2141–2163. 8) T. Egami: Z. Metallkd.93(2002) 10–24.
9) Y. Suzuki and T. Egami: J. Non-Cryst. Solids.75(1985) 361–366.
10) D. Xu, B. Lohwongwatana, G. Duan, W. L. Johnson and C. Garland: Acta Mater.52(2004) 2621–2624.
11) S. Kobayashi, K. Maeda and S. Takeuchi: J. Phy. Soc. Jpn.48(1980) 1147–1152.
12) Y. Waseda and T. Masumoto: J. Phys. B22(1975) 235–245. 13) P. H. Mott, A. S. Argon and U. W. Suter: J. Comput. Phys.101(1992)
140–150.
14) T. Egami:Supercooled Liquids, Glass Transition and Bulk Metallic Glasses, Materials Research Society Symposium Proceedings, ed. By T. Egami, A. L. Greer, A. Inoue and S. Ranganathan, (MRS, Warrendale, Pennsylvania, 2003) pp. 47–52.