Abstract—Smart grid solutions for the energy distribution industry are receiving significant attention globally as a means for improving the efficiency and reliability of the electrical power grid. These solutions infuse intelligent monitoring and control devices throughout the distribution network to report on electrical properties such as voltage, current and power, as well as raising network alarms and events. A further aspect of the smart grid embodies the dynamic rating of electrical assets of the network. This fundamentally involves a rating of the load current capacity of electrical assets including cables, transformers and switches. The mainstream approach to rate assets is to apply the vendor plate rating, which often under utilizes assets, or in some cases over utilizes when environmental conditions reduce the effective rated capacity, potentially reducing lifetime. Using active intelligence we have developed a rating system that rates assets in real time based upon several events. This allows for a far more efficient and reliable electrical grid that is able to extend further the life and reliability of the electrical network. In this paper we describe our systems architecture, the observations made during development of the solution, and illustrate how this solution blends with the smart grid by proposing a dynamic rating system for the smart grid.
Index Terms—Smart Grid, Dynamic Rating, Reliability.
I. INTRODUCTION
Until recently, only the high voltage transmission network has received detailed monitoring and control to manage the electrical distribution network. This has been carried out with Supervisory Control and Data Acquisition (SCADA) systems. The onset of smaller and more cost effective intelligent monitoring and control devices, together with ubiquitous wireless networks has allowed energy distributors to extend this monitoring and control to the remainder of the electrical grid. This expansion of intelligent devices throughout the electrical grid and the IT systems to visualize, analyze and report on the received data has given rise to the smart grid.
A smart grid bestows the opportunity to improve the overall efficiency and reliability of the network. Many distribution networks world wide have aging assets deployed
Manuscript received on the 26th July, 2010, accepted 5th August, 2010. J. Cheema is with EnergyAustralia, Sydney, NSW, Australia. He is Engineer and Delivery Manager, Smart Grids (e-mail: [email protected]).
A. Clark is with EnergyAustralia, Sydney, NSW, Australia. His current position is Manager, Smart Grids (e-mail: [email protected]).
J. Kilimnik is with IBM, Brisbane, Australia. He is a Senior IT Architect of Smart Grid Projects at IBM (e-mail: [email protected]).
C. Pavlovski is with the IBM, Brisbane, Australia. He is the Chief Architect, Technology & Innovation (e-mail: [email protected]).
D. Redman is with IBM, Sydney, Australia. He is the Smart Grid Project Manager at IBM (e-mail: [email protected]).
M. Vu is with IBM, Sydney, Australia. She is the Smart Grid Business Analyst at IBM (e-mail: [email protected]).
that may impact considerably upon the reliability of the network. The smart grid provides a mechanism for accurate reporting on the electrical behavior and performance of the network and is a key factor cited to improve operational performance of the electrical network. In addition, smart grids also allow energy distribution to accommodate newer and cleaner forms of power generation such as wind farms, solar panels, and micro generation. As these new forms of energy become available to the network increased monitoring and control will become more important.
A further capability that can be applied to improve the reliability and efficiency of the distribution grid is the rating of electrical network assets. By monitoring characteristics of the network, the main idea of rating assets is to determine the load carrying capacity, in order to extend life, improve network efficiency, and reduce instances of network failure. The assets typically rated include cables, transformers, and switches. To date, energy distributors have taken a straightforward approach to rating equipment, which is often to use the vendor nameplate rating stamped upon the electrical asset. Furthermore, other distributors may decide run these assets beyond the plated ratings as standard practice.
In this paper we describe our experiences developing an intelligent rating system, whereby the rated load of both the transmission and distribution electrical equipment is re-evaluated in real-time on a range of events, such as network changes, reference data temperature changes, and variations in asset characteristics. In addition, our ratings are grouped to rate clustered equipment such as substations in a way to detect vulnerabilities. We also build into our architecture the capability to accommodate telemetry data received from a smart grid to enable dynamic ratings. Our system has completed development of major system components and is due to go live.We present our experiences in developing the solution thus far and outline a dynamic ratings blueprint that may be useful to other energy distributors wishing to build such systems for the smart grid. Hence, the key contributions of the paper are to:
1. outline our system architecture and solution components;
2. describe our experiences and lessons learned in building an intelligent ratings system; and
3. extend our experiences to propose a framework for a dynamic rating system for the smart grid.
Our system is novel by rating a wide range of transmission and distribution electrical equipment, together with a capability to incorporate dynamic ratings with a smart grid.
The remainder of this paper is structured as follows. In the next section we provide some background to the domain of equipment rating. This is followed by a review of the related work in this field. We then outline our developed solution as
Intelligent Rating Systems for the Smart Grid
a case study and describe the key system components and interactions. Next we provide insight to the key observations and lessons learned during development. We then outline a blueprint for building a dynamic rating system that integrates with the smart grid. Finally, we summarize our work and describe several areas of further work.
II. BACKGROUND AND MOTIVATION
Any asset within a transmission network that directly conducts current or whose failure would disrupt the conduction of current, should theoretically receive a rating. At a high level, these assets can be classified into three categories: substations, cables and cable bays. Each of these categories is composed of sub components that also receive individual ratings.
Substation assets are those assets that exist within the boundaries of the substation and are responsible for the quality and voltage regulation of electricity in the network. This includes transformers, busbars, tap changers, circuit breakers, fuses, and relays.
Cable assets exist outside the boundaries of the substation and are responsible for the transmission of electricity over distance, usually from substation to substation or generator to substation. This typically includes underground covered conductors and overhead bare conductors.
We designate cable bay assets as items at the junction where cables connect to substations. These assets may also belong in either substations or cable categories depending on the operating procedures and/or network configuration. This includes isolators, wave traps, thermal relays, and reactors
A. Rating Paradigms
Electrical assets are supplied with manufacturer specified ratings, often referred to as nameplate ratings. Nameplate ratings provide a recommended operating load (i.e. current) that if not exceeded by the user will provide an expected asset lifetime, expressed in terms of years.
The reality of electricity distribution is that there is rarely a constant operating load profile over time. Rather, the load profile is cyclical with highs, usually during the day, and lows at night, and is impacted by seasonal variances. Therefore an asset will spend considerable time operating below its nameplate rating, which represents an under utilization of the asset and hence the network. This also means that in certain circumstances an asset is able to operate above its nameplate rating without adversely affecting its life expectancy.
A straightforward form of rating is the adjusted rating,
where a nameplate value is altered by some factor (i.e. 130%). In practice this adjustment is often based on asset type, manufacturer, testing, and engineers’ experiences.
A more complex form of asset rating is calculated adjusted ratings which applies a more detailed set of variables and coefficients to calculate more precise factors to apply against nameplate ratings. This involves the adjustment of complex rating equations and may include the application of average temperature values, average load information, asset life, top oil temperatures in transformers, and mutual heating effects in conductors. Such equations are outlined in [1]. Since these formulas are used by manufactures for nameplate ratings, the
idea is to modify these for the specific needs of the distributor.
The similarities of the previous ratings types (nameplate, adjusted rating, and calculated adjusted ratings) represent forms of static ratings. The calculations are generally performed in batch in a regular cycle and based on average operating values.
Dynamic ratings are a newer paradigm which is largely possible due to advances in low cost monitoring devices and communications networks. This approach extends the concept of calculated adjusted ratings using real-time operating data to enable assets to be constantly re-rated based upon the environment that they are situated. This allows for a set of ratings that are more accurate and allows the engineers to make decisions based on more current data. A number of environmental parameters may be monitored including wind [2], temperature, power, and mechanical line sag [3].
B. Motivations
There are several motivations for applying dynamic ratings. Systems such as Dynamic Thermal Rating (DTR) systems are able to increase network capacity and defer investment [4]. Moreover, it is suggested that thermal monitoring can improve capacity of transmission lines between 10 and 30% [5]. Asset ratings provide the ability for utilities to build a network that is designed for standard loads and can also be extended to higher loads for limited times without compromising asset lifetimes. Use of more accurate ratings therefore may achieve a higher utilization and a higher return on investment for the distributor. A further motivation for rating all assets within the network relates to capacity planning. Knowledge of load limiting assets, i.e. lowest rated equipment, within a transmission path may allow a utility to significantly increase transmission loads by upgrading a single component. For example, if one transformer has suffered loss of life and is rated 10% below all other assets in a substation, replacement of a single transformer may increase the total substation throughput rating.
III. RELATED WORK
In [6] the authors provide an overview of dynamic thermal ratings for overhead transmission conductors and circuits. The authors review and discuss the current approaches associated with dynamic ratings, highlighting the factors that may be measured in real-time such as temperature, wind speed, and conductor composition.
network coverage.
In addition to monitoring thermal behavior, there is also a study on a commercial implementation that monitored water ingress [9]. Monitoring equipment was applied to the 110kV distribution cable, enabling users to view real-time ratings based on temperature and load.
There is some work on analyzing the mathematical models for computing dynamic ratings. In [10], the authors apply an outdoor dynamic line rating system to analyze the mechanical actions for overhead lines. The authors refine the equations and demonstrate results that increase line capacity. Miura et al. apply a dynamic rating system and validate this with respect to Available Transfer Capability [11]. The authors also observe that dynamic rating systems are now more realizable with the advances in monitoring devices and communications technologies.
The work in dynamic ratings has largely focused on thermal and mechanical behavior for the transmission network. While dynamic line ratings may increase transmission line capacity by up to 25% [12], this technology is as yet to be deployed widely, with one survey indicating that between 0.3% and 0.5% of respondents’ transmission lines are dynamically rated [13]. In addition, the existing work and industry implementations has yet to address dynamic rating of the both the transmission and distribution network that accommodates the smart grid. Together with telemetry data from the smart grid that reports voltage, current, and power, a dynamic rating system is able to produce more accurate prediction of load for the electrical grid, optimizing further the capacity and reliability of the grid.
[image:3.595.306.550.148.390.2]IV. CASE STUDY:SYSTEM DESIGN &ARCHITECTURE We now describe the architecture and system components of our intelligent rating system. The system calculates the load (current) rating and impedance for a range of transmission and distribution electrical equipment (11kV through 132kV). This is shown in the Table 1 below. When modeling sub-stations and circuits, the nameplate ratings for switches, isolators, tap-changers, relays, reactors, fuses are applied.
Table 1. Rated Electrical Equipment
Equipment Load Impedanc
e
Transformer
Underground Cable
Overhead Cable
Cable and transformer circuit
Busbar
Sub-transmission substation
Zone substation
Ratings are computed for several scenarios including normal operation, emergency (accepting loss of asset life), and short-term ratings to exceed throughput capacities without loss of asset life. In the initial release of the solution the ratings are computed in real-time based upon several events including network connectivity changes, equipment
asset data refreshes, and manual user-override to ratings. This rating process is fundamentally an event driven process where changes to the network configuration and substation assets trigger a rating calculation. This may be considered partially dynamic in the initial release. Later in this paper, in section VI, we build upon this to propose a blueprint for a full dynamic ratings system that uses additional sensory input form the smart grid.
Figure 1. Solution Outline
The key sub-systems of the intelligent rating system are shown in Figure 1 above, this includes Visualization, Business Rules Engine, Ratings Database, Power Network Model, Asset Model and a Rules Management engine consisting of four sub components.
[image:3.595.43.295.579.694.2]Figure 2. Spatial Map Based Location View of Assets
The spatial map allows network engineers to view the topography and location of rated assets. This serves as the means for browsing the electrical network with a map view and allows users to retrieve ratings for the selected asset. A further extension that may be applied in future is a street level view. This capability exists within our deployed smart grid system and can be leveraged to provide the control room with additional visibility of the environment surrounding the asset. The ratings database stores all calculated results for impedance and load ratings. This also serves as a repository for historical calculations so that longitudinal assessment of ratings may be viewed by network planners. Ratings formulas and the business rules associated with ratings equations are also held in this database. The business rules represent the network planning design steps that determine when and which rating equation is to be run to re-rate an asset.
A novel characteristic of our system is the ability for network engineers to modify the rating formulas to be applied, rather than the software programmers. This also means that in future releases network engineers are able to conduct what-if scenarios on ratings, where various parameters and measurements may be altered. The following diagram (Figure 3) illustrates how a rating formula is presented to engineers in modeling the system. The modeling language is an abstract representation of the mathematical formula, and also supports the representation of network planning design rules to be applied.
Figure 3. Rating Rules Modelling Language
The functions that provide the modeling language environment are supported by a rules management environment. This is composed of four sub components: Rules Management, Rules Validation, Rules Execution Environment (server and execution units). These components
are described further below in two categories.
Rules Management and Validation: Responsible for providing the user environment for developing the business rating rules and rating formula. This includes creation, maintenance, governance, management, validation, and deployment of business rules and equations.
Rule Execution Server: Consists of the rules server and spawned execution units, provides a coordination environment for execution of deployed business rules, rating formula, and impedance calculations.
[image:4.595.307.549.258.421.2]When equipment is re-rated this may be displayed via the visualization screens. As ratings are automatically run, the network engineer may view this activity in real-time. In addition, the network engineer is able to override these current or newly rated assets. The following diagram (Figure 4) illustrates how these load ratings are presented to the engineer.
Figure 4. Computed Ratings
V. OBSERVATIONS DURING DEVELOPMENT
Our system has completed development of the major system components and is currently under test. During development and execution of test-bed scenarios a number of observations have been made and are reported in this section. These observations will assist our development of the solution as we continue to integrate the system with the smart grid for a full dynamic rating capability.
Data availability, and the quality of that data, is paramount to achieving an accurate ratings and impedance calculation system. Since data capture and clean up requires large duration and effort, it is important to have solutions for dealing with incomplete data sets. We employed a number of strategies to deal with this problem, including calculation quality indicators (presented to the users as Traffic Light indicators), the ability for users to flag data quality issues, and manual rating overrides.
calculations and rules from the main application source code. The rules and calculations are represented in a language familiar to the business, and this allows the engineers to be involved in the authoring and maintenance of the rules; without direct involvement from computer programmers. This also means that rule changes can be made without new releases of the system, or the re-engagement of a development team. An additional benefit of this feature is the ability for engineers to obtain an up-to-date view of the rating rules used in the system at any point in time.
To be able to dynamically rate entire network segments requires detailed consideration of performance. After initial performance challenges, we found that significant portions of the network can be recomputed within two hours. In order to expand the solution to accommodate a fully dynamic rating capability for the smart grid, an order of magnitude increase of rating events will emerge. Hence, a mechanism is required to filter and prioritize these ratings across the grid so these remain timely and meaningful to the control room engineer.
A further observation from our project was that intellectual capital relating to rating methodology was not readily available. A significant challenge of the project was finding subject matter expertise to specify the ratings rules based upon the IEC standards. With this information now captured within the rules engine, the maintenances and documentation of rating formulas will be automated.
It was also important that the new ratings system did not dramatically increase or decrease the previously accepted capacity of the network. To address this problem, emphasis was placed on the tuning of calculations, with exceptions requiring a detailed explanation of why the system output differs from the established rating. Where the output rating is not acceptable for a particular asset then the option to apply a manual rating may be taken. Hence this is a critical feature for any proposed dynamic ratings system.
Given that the conventional approach to carrying out a rating is to apply the static (nameplate) rating and ensure the current is below the rating. It follows that network planners are generally assured that failure will be avoided during the expected life. This however, prevents optimal usage of the network, with much of this being under utilized. In contrast,
network designers are unable to make long term planning decisions for the network based on ratings that vary from day to day. For planning purposes, engineers require a more stable set of parameters. This means that dynamic ratings are more suited for optimizing the network during operational support activities on a day to day basis. Thus two sets of ratings are required, a static set for planning purposes and a dynamic set for operational support of the network.
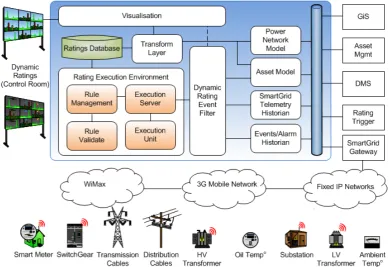
VI. AN ARCHITECTURE FOR RATING THE SMART GRID We now describe a framework and architecture for a dynamic ratings system that leverages the real-time monitoring capabilities of the smart grid. This framework builds upon our experiences in developing an intelligent rating system and smart grid solution. The smart grid solution has been previously developed and deployed to the transmission and distribution network [14]. The solution monitors in real-time network voltage, power, current, network events and alarms. The blueprint illustrates how to accommodate this additional sensory input. The diagram below illustrates the architecture of the dynamic ratings system for the smart grid (Figure 5).
Figure 5. Smart Grid Dynamic Ratings Architecture
The smart grid telemetry historian records all electrical grid measurements. This includes voltage, current, power, and reactive power for each phase of the electrical asset. This historian also serves as a repository to record environmental observations such as temperature changes including transformer oil temperature, ambient air temperature, and equipment thermal measurements. The Events and Alarm Historian is similar in function, although this component is responsible for storing only the network alarms and events. In particular, significant temperature changes reported by smart grid monitoring devices will forward these events as an alarm. This is in addition to the regular periodic temperature measurements forwarded to the smart grid historian.
The range of measurements, events, and alarms monitored and reported by a smart grid is extensive and can be overwhelming. Our experiences show that the computational effort for re-rating large sections of the grid make this a time consuming task and in some instances may take several hours. This means that continuous re-rating for entire grid sections may be impractical for real-time representation. In addition, the source for triggering a re-rating may emerge from several destinations meaning that multiple requests will arrive simultaneously, forcing the re-rating of the same equipment. The Dynamic Rating Event Filter component of the framework is responsible for addressing these problems. This is achieved by filtering all the input stimuli to evaluate which measurement changes, and events, shall result in a re-rating task. Certain analog parameters could yield continuous rating assessments, such as temperature changes. In such circumstances a re-rating event is triggered at designated intervals or variations; for example at 5o interval changes in temperature. This component also accepts user initiated request to re-rate components via Visualization screens.
The smart grid gateway is a component which interfaces
with the various intelligent monitoring devices deployed to the electrical grid. The intelligent devices establish a connection with the smart grid gateway and communicate data periodically. To ensure coverage of the electrical grid, the communications network includes both wireless and fixed line networks. The architecture also designates the smart meter at the household and low voltage transformers as potential sources for measurements or events. This is considered due to the potential for green energy to be deployed at houses. Hence the traditional monolithic power generation plants may also be supplemented with local power generation such as solar and wind. As renewable dependency increases, the need to monitor, control and rate electrical assets for these sources of power will increase in importance.
VII. CONCLUSIONS AND FURTHER WORK
In this paper we have presented our architecture and design for an intelligent ratings system which re-rates in real time electrical assets at predetermined trigger events. We elaborate upon our experiences and key observations from building such a system. Together with experiences from our existing smart grid infrastructure, deployed to the transmission and distribution network, we outline an architecture and framework for a dynamic rating system that integrates and leverages the capabilities of the smart grid.
Our ratings system has completed development of major system components and is due to go live. Based upon our experience in building both a smart grid and an intelligent rating system, it is hoped that the outlined blueprint for a dynamic ratings system will be useful to other energy distributors wishing to develop such capability to further extend the life and reliability of their electrical grids.
capability for the control room. Remote surveillance of critical infrastructure is also becoming an increasingly important strategy for energy distributors. By incorporating a video surveillance capability, control room engineers may also observe critical assets under certain abnormal conditions such as excessive temperature. Finally, providing dynamic ratings for a wide range of electrical equipment may not be cost effective in the short term. As such, there is further work to analyze those distribution assets that warrant a dynamic rating to ensure economic return from investment.
ACKNOWLEDGMENTS
We thank Steve McHardy for his insightful feedback and comments on this paper.
REFERENCES
[1] International Standard IEC60287-1-1. Electrical Cables – Calculation of the Current Rating, Part 1-1; Current rating equations (100% load factor) and calculation of losses – General, 2nd Ed. December, 2006
[2] S. Abdelkader, S. Abbott, J. Fu, B. Fox, D. Flynn, L. McClean, L. Bryans, Dynamic Monitoring of Overhead Line Ratings in Wind Intensive Areas, Proceedings of European Wind Energy Conference and Exhibition (EWEC 2009), France, March 2009.
[3] M. Muhr, S. Pack, S. Jaufer, Usage and Benefit of an Overhead Line Monitoring System, International Conference on High Voltage Engineering and Application, November 2008, pp.557-561.
[4] D. Roberts, P. Taylor, A. Michiorri, Dynamic thermal rating for increasing network capacity and delaying network reinforcements, SmartGrids for Distribution, June 2008, Frankfurt, pp.1-4.
[5] T.O. Seppa, Increasing transmission capacity by real time monitoring , IEEE Power Engineering Society Winter Meeting, August 2002, Vol. 2, pp.1208-1211.
[6] K.E. Holbert, G.T. Heydt, Prospects for dynamic transmission circuit ratings, The 2001 IEEE International Symposium on Circuits and Systems (ISCAS 2001), Vol.3 , May 2001, pp.205-208.
[7] D.A. Douglass, D.C. Lawry, A.A. Edris, E.C. Bascom, Dynamic thermal ratings realize circuit load limits, IEEE Computer Applications in Power, August 2002, Vol.13 Iss.1, PP.38-44.
[8] M.V. Vijaya Saradhi and S. Nagaraju, Development of a Low-Cost ZIGBEE and GSM SMS-Based Conductor Temperature and Sag Monitoring System, International Journal of Engineering Science and Technology, Vol. 2(4), 2010, pp.372-381.
[9] L. Goehlich, F. Donazzi, et al., First commercial application of new monitoring systems against water ingress and overtemperatures in HV-XLPE cables, Eighth International Conference on Dielectric Materials, Measurements and Applications, August 2000. IEE No.473, pp.452-457.
[10] L. Ren, X. Jiang, G. Sheng, W. Bo, Design and calculation method for dynamic increasing transmission line capacity, WSEAS Transactions on Circuits and Systems archive, Vol.7, Iss.5, pp.348-357.
[11] M. Miura, T. Satoh, S. Iwamoto, I. Kurihara, Application of dynamic rating to increase the available transfer capability, Wiley Periodicals, Electrical Engineering in Japan, 2009, Vol.166(4), pp.40-47.
[12] T.O. Seppa, Real Time Rating Systems, Presented at the EPRI Workshop on Real Time Monitoring and Rating of Transmission and Substation Circuits: A Technology Increasing Grid Asset Utilization, San Diego, CA, February 26-28, 1997.
[13] Smart Grid System Report, US Department of Energy, July 2009. Available at http://www.smartgrid.gov/sites/default/files/pdfs/sgsr_ main.pdf.