Method of the Aquatic Environment Image Processing
for Determining the Mineral Suspension Parameters
D.A. Antonenkov
Marine Hydrophysical Institute, Russian Academy of Sciences, Sevastopol, Russian Federation e-mail: [email protected]
The present article features the developed method to determine the mineral suspension characteristics by obtaining and following processing of the aquatic environment images. This method is capable of maintaining its performance under the conditions of considerable dynamic activity of the water masses. The method feature consists in application of the developed computing algorithm, simultaneous use of morphological filters and histogram methods for image processing, and in a special calibration technique. As a whole it provides a possibility to calculate size and concentration of the particles on the images obtained. The developed technical means permitting to get the environment images of the required quality are briefly described. The algorithm of the developed software operation is represented. The examples of numerical and weight distribution of the particles according to their sizes, and the totals of comparing the results obtained by the standard and developed methods are represented. The developed method makes it possible to obtain the particle size data in the range of 50–1000 μm and also to determine the suspension concentration with ~12 % error. This method can be technically implemented for the instruments intended for in situ measurements using the gauges, allowing obtaining exposure time short values, such as applying the electron-optical converter, which acts as the image intensifier, and the high-speed electronic shutter. The completed method testing in the laboratory makes possible to obtain the results similar in accuracy with the results of the in situ measurements.
Keywords: image, suspension concentration, particle size, image processing.
DOI: 10.22449/1573-160X-2016-5-36-44
© 2016, D.A. Antonenkov © 2016, Physical Oceanography
Nowadays methods based on image processing are widely applied in various fields of science due to their universality and possibility to obtain the real-time results. Their application and adaptation, development of the new methods for the aquatic environment research on the basis of the aforementioned ones (particularly the suspension characteristics) are promising and actual tasks.
measurement of the suspension terrigenous origin parameters in the coastal area due to the design features.
The main purpose of this work is to show the possibilities of the developed method of determining the mineral suspension characteristics by processing the aquatic environment images. This method permits to obtain simultaneously the data on the concentration and size of suspended particles in the water under the high speeds and concentration.
The essence of the method is to obtain "instant" images (exposure time frame is about 4 microseconds, allowing to obtain the clearer contours of particles (without tracks)) of a thin water layer with the suspension particles, immediately adjacent to the porthole. Further, by processing the images obtained with the help of developed software the suspension concentration and size are determined.
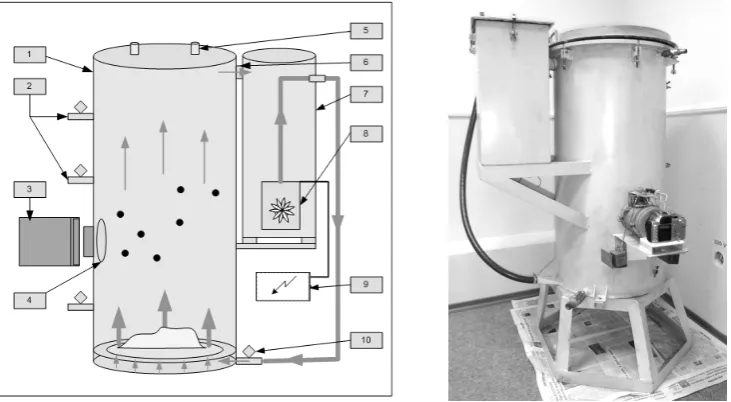
To test the method, a test stand with a specialized photorecorder was designed. Its recorder allowed to create a suspension field with some vertical distribution of its concentration and to obtain a series of experimental images of the environment. A construction diagram and photo of the stand are shown in Fig. 1.
Fig. 1. A construction diagram and photo of the test stand: 1 – steel tank; 2 – valves for sampling; 3 – photorecorder; 4 – porthole; 5 – sealed cover; 6 – a connecting branch for water return to the tank; 7 – pumping container; 8 – pump
For the processing of the obtained environment images and the following determination of suspension parameters the special software was developed. Its algorithm consists in the subsequent implementation of a number of subprograms.
gamma power function [4] the contrast conversion is performed, the result of which is an image with optimal contrast.
For image segmentation the method based on the analysis of the luminance differences between the background pixels and the pixels of objects is used. This method consists in determining the a priori luminance threshold between the background pixels and particles and further segmentation by the threshold method [5]. To determine the threshold the calibration image 1 is used. It contains no various artifacts with the suspension particles of the same nature and of the same size as in experiment.
After the segmentation the particles with the radius of less than 50 microns are removed. Their size is not included in the study range due to the insufficient resolution of the photographic equipment applied. The final image is formed using morphological filter performed on the image resulting after pre-processing. This filter is based on the erosion operation [4] applying the structure-forming element in the form of a circle with the radius of 50 mm and the subsequent dilation. The structure-forming element radius in pixels is calculated based on the calculated pixel size by the technique described below. Stages of the image processing are shown in Fig. 2.
Fig. 2. Stages of processing of the images obtained: 1 – original image; 2 – image pre-processing result; 3, 4 – image after segmentation and filtration
Further the pixel size and the volume of the registered layer, for which the calculations are carried out, are determined. For this purpose the calibration image 2 (with the porthole boundaries) is used, on which the rectangle bounding the information area is constructed and its length, in pixels, is calculated. Knowing the exact size of the porthole the images are registered through, we can calculate the size of a pixel. Finding out the study volume consists of calculating of two test parameters: the filter mask radius and the registered layer thickness.
The filter mask radius is found by the bounding rectangle and further calculation of its length similar to the calibration image processing.
1 2
The registered layer thickness corresponds to the value of the Depth of Field (DOF) of the photorecorder.
The calculation of DOF is carried out in accordance with the relations described by V. Yashtold-Govorko [6]:
z -f R +K f f R = R ) n ( n p 2 2 ⋅ , z -f R -K f f R = R ) n ( n z 2 2 ⋅ , p z-R R=R ,
where Rp is the front boundary of the DOF; Rn is the distance, which the sharpness setting is carried out at; Rz is the rear boundary of the DOF; f is the equivalent focal length; K is the aperture; z is the blur disc diameter; R is the DOF.
Based on the specifications of the camera Canon EOS 300D the focus distance (from the front lens to the subject photographed) Rn is equal to 16.5 cm. Image registration is done in the long-focus mode corresponding to the focal length f = 55 mm. F-stop number K is 5.6. Permissible diameter of the confusion circle z is 0.0037 cm. The diameter confusion circle of the photorecorder is taken equal to 5 pixels of the matrix, which corresponds to 37 microns (the size of a pixel according to the camera specifications is 7.4 microns). As a result of the calculations, the registered layer thickness will be 2.5 mm. This parameter can be corrected by comparison with standard methods for reducing of the concentration calculation error.
Thus, knowing the filter mask radius and the registered layer thickness, it is possible to determine the volume of the study environment layer:
2 2 5 10 5 2 2 10
2 − ⋅ ⋅ −
⋅ ⋅
= Width PS .
V π ,
where V is the registered layer volume in dm3; Width2 is the diameter of the
circular layer area in pixels; PS is the pixel size in microns.
Determining the particle concentration and size in the image, it is assumed that its information region contains no overlapping particles. This assumption holds true for the experiments carried out in the coastal zone at a ~ 10 cm distance from the bottom, where the suspension concentration may be too small.
Thus, the registered layer volume with the thickness h = 2.5 mm and diameter Dsl = 60 mm is equal to
3 6 3 2 3 2 m 10 7 10 5 2 10 60 4 1 sl 4 1
sl= π⋅D ⋅h= π( ⋅ − ) ⋅ . ⋅ − = ⋅ −
V .
When average concentration of the C particles is equal to 3 g/l, taking into consideration a uniform distribution of particles in the volume, the mass of particles in the registered layer is
kg 10 21 sl
ch= ⋅ = ⋅ −3
V C
Taking the specific weight of sand γ equal to 2.2 g/cm3 (taken specifically for
the sand, applied in the experiment), we define the volume occupied by the particles in the registered layer:
.
. 9 3
m 10 5 9 ch
ch= = ⋅ −
γ M V
These calculations show that the volume occupied by the particles in the registered layer is almost three orders less than the analyzed space, and therefore, because of their uniform distribution in the volume, it can be argued that the probability of their overlap is rather small. It is confirmed by K. Shifrin when considering a similar problem for the fluctuation method [7]. The statistical model of the motion of suspended particles, applied in this method, is quite general and can be used in the description of other optical measurement methods of suspension characteristics, such as the direct counting method of particles by research environment images.
The counting error appearing due to mutual shading of the particles can be estimated on the basis of the following relations [7]:
) ( .
)
( 2 3 4
77
1 τ τ
τ τ
ϕ = − +O .
Limiting the quadratic contribution of the optical density τ in the value of the function K (τ), which characterizes the dependence of the dispersion of fluctuations from T by ten percent, we’ll obtain τ0.1 = 0.057. Assuming that the particles with
the diameters ranging 50 μm – 1 mm are subjected to the direct counting, for the average diameter d0 of the distribution function f(d)≈d−1 we’ll obtain d0≈300
μm, the radius is r0≈150 μm. Accordingly, the area is 0 02 7 10 6dm2.
− ⋅ ≈ = r
s π
Since the image diameter is 60 mm, the average amount of particles in the image 3
( ) 1, 6 10
N = ×n lS ≈ ⋅ pcs. It can be expected that this number of particles in the image will be calculated with an error ~ 10% due to mutual shading. As the experiments carried out on the test stand show, the average number of particles detected in the images, is 700 – 800 pcs. In accordance with the aforementioned information, it can be assumed that the counting error of the number of particles at a concentration of 3 g/l is ~ 5%. Naturally, with increase of the concentration, this error will also increase, but a complete "failure" of the method of determining of the suspension characteristics (as in the majority of the existing methods) will not occur due to the use of the foreground image.
In consideration of the foregoing, the determination of the concentration and size of the particles in the image is performed in several following steps:
1. After the segmentation the total number of elements is calculated and the number of pixels belonging to each of them is determined. The result is a numerical concentration of the particles in the registered region and the area of each particle in the pixels.
2. For each particle the radius of the equivalent sphere is calculated. It is is taken as the radius of the particles based on the assumption that the particle is close to the shape of a ball.
3. The next step is the calculation of the volume of each particle.
5. Having determined the total weight of the particles and calculated the volume of the study layer, it is possible to calculate the mass concentration of particles.
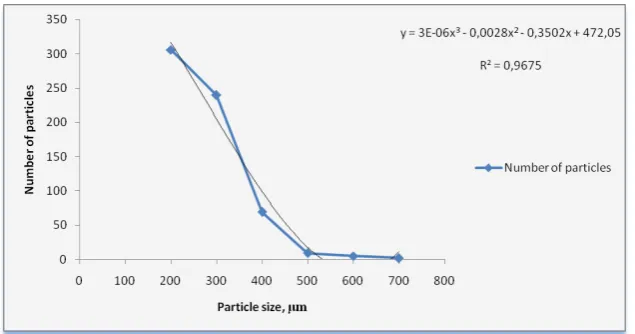
The result of the calculations carried out are the following data: an array of the areas occupied by the particles; array containing particle radii; an array containing the mass of the particles; number of particles; mass concentration of particles in the study volume.
At the final stage of processing after analyzing the entire series of images the average concentration of suspended particles in the water is calculated.
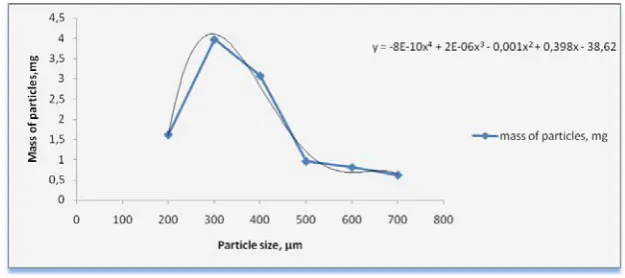
During laboratory testing of the developed method we obtained arrays of the aquatic environment images. The experiments were carried out applying the designed test stand. For maximum approximation of the laboratory experiment to the field ones the sea sand from samples taken during field research in the Bakal Spit (Western Crimea) was used. As the result of the necessary software computations the data on the average suspension concentration, being 2.05 g/l, were obtained. In addition, the quantitative and mass distributions of the particles by fractions, comprising the particles having size of 100 μm – 800 μm with the step
of 100 μm, were also obtained. The results are shown in Fig. 3 and 4.
To estimate the efficiency of the method the determination of the values of the concentration and particle size were performed by conventional methods of sifting and weighing [7 – 10]. For analysis the samples were taken by means of the valves provided in the test stand. The moment of sampling was synchronized with the moment of registration of images.
Tab. 1 shows the results of gravimetric analysis of samples taken at the 49 cm horizon from the bottom of the experimental tank at 1 min intervals, namely: the mass concentration of each sample and the average concentration of the suspension.
Fig. 4. Mass distribution of the particles for each fraction
T a b l e 1
Results for the Sample Analysis of the Substance Suspended in Water
Sample No.
Mass of the suspension with
a filter, g
Filter mass,
g
Suspension mass, g
Water mass, g
Water volume, l
Suspension concentration,
g/l
1 1.94 0.98 0.96 378 0.38 2.54
2 1.79 0.99 0.8 343 0.34 2.33
3 1.53 1.03 0.4 340 0.34 1.47
4 1.68 1.01 0.47 348 0.35 1.93
Average suspension concentration, g/l 2.07
Tab. 2 shows the results for the software processing of the obtained series of images, namely: average value of the concentration of the suspension particles for each series individually and average value of the concentration for all the series.
T a b l e 2
Average Values of the Suspension Concentration Obtained after Software Processing of the Experimental Images
Series No.
Average concentration of the suspension particles, g/l
1 3.25
2 2.94
3 1.54
4 2.01
Average concentration for four
series, g/l 2.44
Fig. 5. Diagram of the percentage of the sediment fractions in accordance with the results obtained by the standard sieve method
The particle size data, obtained by means of developed methods, are shown in Fig. 6.
Having completed analysis of the results, we can draw a conclusion that the differences in the final values of the concentration determined by both methods, does not exceed 12%. It is a good result for the indirect method of determining the suspension parameters under their high temporal variably.
Having compared the particle size analysis data with the data after the software processing of the images, the following conclusion can be drawn: both methods showed that the main mass of the particles of the given sand samples are the fractions having diameter of 100 –500 μm. Particularly, the sieve method demonstrated that the greatest share (70 %) occupy the particles having of 100 – 500 μm, and the developed method showed the particles of 200 – 500 μm in diameter occupy 64% of the total mass. The slight difference in the particle size is
due to the due to the fact that in the developed method the fraction up to 200 μm is
represented by the narrow range of the particles of 160 – 200 μm in diameter.
Common mass particle size distributions determined by both methods are sufficiently identical. So, it can be concluded that the results obtained applying the developed method are reliable and the given method can be used to determine the particle size of suspension.
Inaccuracy of the developed method consists of the errors related to lubrication and shading effects of one particle by the other ones. As these errors are statistically independent, their total inaccuracy of the developed method will be equal to
% 12 zaten smaz
sum= ∆ 2 +∆ 2 ≈
∆ .
Thus, the developed method makes it possible to obtain the particle size data in the range of 50 – 1000 μm and also to determine the suspension concentration with ~12 % error. This method can be technically implemented for the instruments intended for in situ measurements using specialized gages, allowing obtaining exposure time short values, such as applying the electron-optical converter, which acts as the image intensifier, and the high-speed electronic shutter. The completed method testing in the laboratory makes possible to obtain the results similar in accuracy with the results of the in situ measurements.
REFERENCES
1. Antonenkov, D.A., 2008, “Tekhnicheskie sredstva dlya naturnykh issledovaniy razmernogo sostava i kontsentratsii vzveshennogo v vode veshchestva [Technical equipment for field studies of size composition and concentration of suspended matter in water]”, Sistemy kontrolya okruzhayushchey sredy. Sredstva, informatsionnye tekhnologii i monitoring, pp. 83-87 (in Russian).
2. Davis, C.S., 2005, “A three-axis fast-tow digital video plankton recorder for rapid surveys of plankton taxa and hydrography”, Limnol. Oceanogr.: Methods, no. 3, pp. 59-74.
3. 2010, Video plankton recorder (VPR), access mode
http://www.whoi.edu/instruments/viewInstrument.do?id=1007#1034.
4. Gonsales, R., Vuds, R. & Eddins, S., 2006, “Tsifrovaya obrabotka izobrazheniy v srede Matlab [Digital processing in Matlab environment]”, Moscow, Tekhnosfera, 616 p. (in Russian).
5. Gonsales, R., Vuds, R., 2005, “Tsifrovaya obrabotka izobrazheniy [Digital image processing]”, Moscow, Tekhnosfera, 1072 p. (in Russian).
6. Yashtold-Govorko, V.A., 1977, “Fotos"emka i obrabotka. S"emka, formuly, terminy, retsepty [Photographing and processing. Shooting, formulas, terms and recipes.]”, Moscow, Iskusstvo, 343 p. (in Russian).
7. Shifrin, K.S., 1983, “Vvedenie v optiku okeana [Introduction to the ocean optics]”, Leningrad, Gidrometeoizdat, 280 p. (in Russian).
8. 2006, “DSTU ISO 11277:2005. Kachestvo grunta. Opredelenie granulometricheskogo sostava i mineral'nogo materiala grunta Metod proseivaniya i sedimentatsii. (ISO 11277:1998, IDT) [DSTU ISO 11277:2005. Soil quality. Determination of particle size distribution in mineral soil material – Method by sieving and sedimentation], Kiev, Derzhspozhivstandart Ukrainy, 29 p. (in Russian).
9. 1988, “GOST 12536-79. Grunty. Metody laboratornogo opredeleniya granulometricheskogo (zernovogo) i mikroagregatnogo sostava [Methods of laboratory granulometric (grain-size) and microaggregate distribution]”, Moscow, Izdatel’stvo standartov, 22 p. (in Russian). 10. Petelin, V.P., 1967, “Granulometricheskiy analiz morskikh donnykh osadkov [Granulometric